the Prediction of G Protein-Coupled Receptor Structures
Thesis by
Jenelle K. Bray
In Partial Fulfillment of the Requirements
for the Degree of
Doctor of Philosophy
California Institute of Technology
Pasadena, CA
2010
© 2010
Acknowledgments
I have been fortunate to have had such a supportive advisor as Bill Goddard during my time at Caltech. He has allowed me great freedom in my academic pursuits, and he has also taught me to be confident in my abilities as a scientist. I am also very grateful for the help given to me by many of my group members, and the biogroup as whole. I would especially like to thank Ravi Abrol, Adam Griffith, Victor Kam, John Wendell, and Heather Wiencko.
More than anyone, it was my undergraduate advisor at University of Oregon, Marina Guenza, who encouraged me to pursue a graduate degree. She was extremely generous in her time, and it was in her group that I discovered my passion for research. She was an excellent example of a successful woman in science, and I hope I can follow in her footsteps and encourage other young women to go into chemistry.
I have been lucky to have had outside research opportunities during my time as a graduate student. Both Lubomir Rulisek at the Institute of Organic Chemistry and Biochemistry in Prague and Teresa Head-Gordon at UC Berkeley were great advisors. They were very welcoming and they helped me to learn a great deal in a short amount of time.
them that I have had some amazing musical opportunities while at Caltech, from performing at Carnegies to playing Messiaen’s Quartet for the End of Time.
I could not have survived my time here without my amazing friends. Kana Takematsu and Adrienne Erickcek were the most caring, understanding, and fun friends possible. I am going to miss the girls’ nights with them, and I hope we can have many more in the future. I will also miss my nights watching bad dance movies with Kana and Laurence Yeung. I look forward to the time when we can revive our tiny instrument band. The times spent with my friends at Caltech will be my fondest memories of my graduate career.
Abstract
Computational methods for the prediction of G protein-coupled receptor (GPCR) structures were applied to serotonin receptors, and new methods were developed to predict an orphan GPCR structure. First, the MembStruk procedure was used to predict the structures of the serotonin 2b and 2c receptors. Ligand binding sites for agonists and antagonists were predicted for both receptors. In addition, the SAR data for a series of psilocybin analogs bound to serotonin 2c were predicted. There was good agreement with binding and mutagenesis experiments.
A new structure prediction procedure called SuperBiHelix was developed to predict an ensemble of low-lying structures. SuperBiHelix samples the tilt and sweep angles of the transmembrane helices along with the rotation of the helices along the helical axes. The procedure was validated on the β2-adrenergic
receptor and A2A adenosine receptor crystal structures. This procedure was then
Table of Contents
List of Figures iii
List of Tables v
Introduction 1
Chapter 1: The Structures of Human Serotonin 2b and 2c
G Protein-Coupled Receptors Bound to Agonists and Antagonists 3
Abstract 3
Introduction 4
Methodology 7
TM Predictions 7
Packing of the TM Helices into a Seven-Helix Bundle 10 Rigid Body Dynamics of the Bundle in an Explicit Lipid Bilayer 12 Optimization of Individual Helices within the Bundle 13
Prediction of Ligand Binding Sites 21
Molecular Dynamics Simulation 24
Binding Energy Calculations 27
Results and Discussion 29
Serotonin Binding 29
Bound Serotonin Dynamics 31
Comparison to Mutagenesis Experiments 35
Ritanserin Antagonist Binding 38
Metergoline Antagonist Binding 39
Methiothepin Antagonist Binding 41
SAR for Psilocybin Analogs 41
Discussion of Binding Energies 49
Comparison to 5-HT2B Predictions 52
Conclusion 60
Chapter 2: SuperBiHelix: A New Method for Predicting an Ensemble
of Low-Lying GPCR Structures 62
Abstract 62
Introduction 62
Methodology 63
Validation 69
SuperBiHelix on Crystal Helices in an Incorrect Template 69 The Effect of SuperBiHelix on Binding Site Predictions 82
SuperBiHelix on Crystal Structures 87
Chapter 3: The Structure of the Orphan G Protein-Coupled Receptor
GPR88 with Predicted Ligands 93
Abstract 93
Introduction 94
Methodology 95
Results and Discussion 99
BiHelix and ComBiHelix 99
SuperBiHelix and SuperComBiHelix 103
Ligand Docking 108
Conclusion 120
List of Figures
1 Serotonin 2c hydrophobic profile 9
2 Serotonin 2c rotational profiles 18
3 Final predicted structure of serotonin 2c 20
4 Ligand structures and binding constants for docking to serotonin 2c 21
5 Serotonin 2c antagonist docking spheres 23
6 Energy and volume of serotonin 2c simulation 26
7 Predicted structure of serotonin bound to serotonin 2c 30
8 Structure of serotonin bound to serotonin 2c after 5 ns of dynamics 32
9 Distances between serotonin and residues on serotonin during dynamics 33
10 Predicted structures of antagonists bound to serotonin 2c 40
11 Predicted structures of SAR ligands bound to serotonin 2c 43
12 Calculated vs. experimental binding energies for ligands bound to serotonin 2c 51
13 Alignment of the predicted serotonin 2b and 2c structures 53
14 Predicted structures of serotonin and ritanserin bound to serotonin 2b 55
15 The coordinate system used to described the seven-helix bundle 64
16 Diagram of the SuperBiHelix method 65
17 Diagram of the helical bundle partitioned into quadhelix bundles 67
18 Charged termini residues in the β2-adrenergic and the A2A adenosine receptors 74
19 Β2-adrenergic helices in the A2A adenosine template before and after SuperBiHelix 79
20 A2A adenosine helices in the β2-adrenergic template before and after SuperBiHelix 81
21 Β2-adrenergic structures before and after SuperBiHelix bound to carazolol 85
22 A2A adenosine structures before and after SuperBiHelix bound to ZM241385 86
23 GPR88 hydrophobic profile 97
24 Lowest energy GPR88 ComBiHelix structure 102
25 Lowest energy GPR88 SuperComBiHelix structure 105
26 Second-lowest energy GPR88 SuperComBiHelix structure 106
27 The three lipid molecules docked into GPR88 109
28 Predicted GPR88 structures bound to FFA 114
29 Predicted GPR88 structures bound to LPA 115
List of Tables
1 Serotonin 2c TM helix predictions 11
2 Serotonin 2c combinatorial analysis 20
3 Nonbond interactions between each bound ligand and individual residues in
the predicted serotonin 2c structure 30
4 Mutations for each ligand that are predicted to decrease binding affinity 49
5 Experimental binding constants and calculated binding energies for
ligands bound to serotonin 2c 50
6 Experimental binding constants and calculated binding energies for
ligands bound to serotonin 2b 60
7 The differences between the A2A adenosine receptor and β2-adrenergic
receptor templates 69
8 SuperComBiHelix results for β2-adrenergic receptor with A2A adenosine
template φ and θ values 71
9 SuperComBiHelix results for the A2A adenosine receptor with
β2-adrenergic template φ, θ and η values 72
10 SuperComBiHelix results for the β2-adrenergic receptor with A2A
adenosine template φ, θ and η values 73
11 SuperComBiHelix results for the β2-adrenergic receptor with A2A
adenosine template φ, θ and η values, with termini residues mutated to
alanine during the SuperBiHelix and SuperComBiHelix procedures 75
12 SuperComBiHelix results for the β2-adrenergic receptor with A2A
adenosine template φ, θ and η values, with termini residues mutated to
alanine during the SuperBiHelix procedures 76
13 SuperComBiHelix results for the β2-adrenergic receptor with A2A
adenosine template φ, θ, η, x and y values 78
14 SuperComBiHelix results for the A2A adenosine receptor with β2-
adrenergic template φ, θ, η, x and y values 80
15 The ranking of the crystal structure conformation for each helix after the quadhelix protocol that determines which helix conformations to
include in the SuperBiHelix bundle energy calculations 88
16 SuperBiHelix and SuperComBiHelix results for the β2-adrenergic
receptor crystal structure 89
17 SuperBiHelix and SuperComBiHelix results for the A2A adenosine
receptor crystal structure 90
18 Proteins sequentially related to GPR88 96
19 TM helix predictions for human GPR88 98
20 ComBiHelix results for GPR88 in the β2-adrenergic receptor
template 100
21 SuperComBiHelix results for GPR88 103
23 Nonbond interactions between each bound ligand bound and
Introduction
An important class of transmembrane proteins is the G protein-coupled receptor
(GPCR) superfamily, which regulates signal transduction. GPCRs are of great
interest pharmacologically, for they are the targets of 50% of recently released
drugs and 25 of the top 100 best-selling drugs.[1] Malfunctions in GPCRs play a
part in diseases such as ulcers, allergies, migraines, anxiety, psychosis,
schizophrenia, hypertension, asthma, congestive heart failure, Parkinson’s, and
glaucoma.[2] Despite the great deal of interest in GPCRs, progress in obtaining
atomic level experimental structures has been slow, due to challenges involved
in GPCR expression, purification, and crystallization. There are currently
structures of only four GPCRs: rhodopsin,[3] the β1-adrenergic receptor,[4] the β
2-adrenergic receptor,[5] and the A2A adenosine receptor.[6] Consequently, there is a
great need for GPCR structure predictions, which computational methods can
help fill. Many GPCRs have similar enough structures that an antagonist or
agonist targeted at one receptor will bind another type of receptor and lead to
unwanted side effects. Thus, atomic-level structures are essential for the rational
design of subtype-specific drugs.
The Membstruk procedure[2, 7] was used to successfully predict serotonin 2b
and 2c structures and binding sites,[8] as described in Chapter 1. The serotonin
study led to some important developments in the method, most significantly the
neutralization of complexes for binding energy calculations. However,
heavily dependent on the experimental template used because Membstruk
sampled very little GPCR conformational space. Thus, a new procedure, BiHelix,
was developed that efficiently sampled all of the possible rotations of each helix
around their helical axes. This procedure was a big improvement over
Membstruk, but it was still dependent on the experimental template used. In
order to predict the structures of receptors dissimilar to any available crystal
structure, SuperBiHelix was developed. SuperBiHelix samples the tilt and sweep
angles of each helix in addition to the rotation around their helical axes. The
description and validation of SuperBiHelix is given in Chapter 2. Finally, in
Chapter 3, SuperBiHelix was used to predict the structure of the orphan GPCR
GPR88. An ensemble of low-lying GPR88 structures was predicted and some
possible strong-binding lipids were proposed. Ligand binding and mutagenesis
experiments were suggested that could help to validate the proposed structures
Chapter 1
The Structures of Human Serotonin 2b and 2c
G Protein-Coupled Receptors Bound to Agonists
and Antagonists
Abstract
We used the MembStruk computational procedure to predict the 3-dimensional
(3D) structure for the serotonin 5-HT2C G protein-coupled receptor (GPCR).
Using this structure, we used the MSCDock computational procedure to predict
the 3D structures for bound ligand-protein complexes for agonists such as
serotonin and antagonists such as ritanserin, metergoline, and methiothepin. In
addition, we predicted the SAR data for a series of psilocybin analogs, both
agonists and antagonists. We performed molecular dynamics (MD) on serotonin
bound to 5-HT2C and we find the protein and binding site to be stable after 5 ns.
We find good agreement with the currently known experimental data and we
predict a number of new mutations, which could be used to validate further our
predicted structures. This agreement between theory and experiment suggests
that our 3D structure is sufficiently accurate for use in drug design. We also
compare a preliminary prediction for 5-HT2B with our prediction for 5-HT2C and
find a difference in TM5 that contributes to different serotonin binding modes in
Introduction
The serotonin (5-hydroxytryptamine, or 5-HT) class of G protein-coupled
receptors (GPCR) serve as neurotransmitters involved in many processes in the
central nervous system, including the regulation of feeding, aggression, mood,
perception, pain, and anxiety.[9] Additionally, 5-HT regulates vascular and
nonvascular smooth muscle growth, uterine smooth muscle growth, and
gastrointestinal functioning.[9] Consequently, these receptors are targets for a
variety of drug therapies. This family of receptors that consists of at least 15
receptors partitioned into seven main types helps to mediate these physiological
functions. This creates a problem for drug design since all 15 likely have similar
binding sites, making it difficult to attain selectivity of a drug to just one receptor.
This problem is made worse because there are no 3D x-ray structures for any of
these receptors. To help fill this gap we have been developing methods
(MembStruk) for predicting the 3D structures.
We consider here the 5-HT2 family, which consists of three structurally
related receptors: 5-HT2A, 5-HT2B and 5-HT2C. Drugs that target 5-HT2 receptors
are used to treat such disorders as schizophrenia, depression, and glaucoma.
The three 5-HT2 receptors have high sequence identity within the
transmembrane domains, and they play a variety of physiological roles. The
majority of current drugs with affinity for 5-HT2 receptors are not subtype
specific,[10] so it is often unclear which receptor is responsible for the particular
physiological effect and which receptor is responsible for unwanted side effects.
5-HT2 receptors would facilitate the creation of more subtype specific drugs that in
turn would lead to a better understanding of the specific physiological role of
each receptor.
Since no direct studies have determined how ligands bind to 5-HT2
receptors,[9] we will use computational methods to predict the 3D structure of the
receptors and of the ligand-receptor complexes. Since there are no experimental
structures for comparison, we validate our predicted structures indirectly by
comparison with available mutagenesis and ligand binding experiments. Then we
predict the results for new mutation and binding studies that could be carried out
experimentally. We report here the results for 5-HT2C, and preliminary results for
5-HT2B. These studies should provide the data needed to design sub-type
specific drugs and to determine the origin of physiological responses to different
agonists and antagonists.
The 5-HT2C receptors are found in many regions of the brain. Some
evidence suggests that 5-HT2C may play a role in the mediation of the
sleep-wake cycle.[10] The activation of 5-HT2C appears also to be correlated with penile
erections.[10] Several studies have suggested a prominent role for 5-HT2C
receptors in the regulation of food intake and energy balance, and that 5-HT2C
agonists act as appetite suppressants.[11] Additionally, 5-HT2C is believed to be
involved in anxiety, feeding behaviors, and anxiety-related disorders like
obsessive compulsive disorder (OCD).[11] In fact, 5-HT2C agonists can intensify
the symptoms of schizophrenia and OCD. However, it is difficult to determine
activation of other 5-HT receptors, most notably 5-HT2A, is implicated in similar
physiological effects.[11]
In order to provide the basis for designing subtype specific agonists and
antagonists for the 5-HT2C receptor, we set out to obtain the 3D structure of this
receptor and for ligands binding to it. We did not use homology modeling
because of the two experimentally known 3D structure for GPCRs, 5-HT2C is only
19% homologous to bovine rhodopsin[3] and 31% homologous to the
beta(2)-adrenergic receptor, whose structure has been recently solved.[5] Additionally, we
have found in studies of other GPCRs that systems with even 80% sequence
identity can have different binding sites. Instead, we used the MembStruk GPCR
structure prediction procedure to predict the 3D structure. MembStruk has been
used successfully to predict the structures for CCR1 chemokine receptor,
MrgC11 tetrapeptide receptor and DP prostanoid receptor, in each case for
which experimental validation was done after the predictions. In addition,
predictions of the structures for D2 dopamine receptor, β2 adrenergic receptor
and M1 muscarinic acetylcholine receptor are in good agreement with numerous
mutation and ligand binding experiments. Furthermore, predictions of olfactory
receptors, the PTC bitter-taste receptor, and rhodopsin agree with somewhat
more limited ligand binding experiments.[2, 7, 12-18]
Here we report the structure prediction for the 5-HT2C receptor, and then we
use the MSCDock procedure[19] to predict the binding sites of serotonin and three
strongly binding antagonists. In addition, we predict the binding of ten psilocybin
predicted structure for 5-HT2C with a preliminary prediction of 5-HT2B. In all
cases, we obtain excellent agreement with currently available data and we
predict new experiments to validate further the predicted structures.
Methodology
We used the MembStruk procedure (version 4.30)[2, 7] to predict the structure of
the 5-HT2C receptor. This procedure consists of five main steps:
1. Prediction of the transmembrane (TM) helices from hydrophobic analyses
of the amino acid sequence.
2. Assembly of the seven-helix TM bundle and coarse grain optimization of
the bundle.
3. Rigid body dynamics of the bundle in an explicit lipid bilayer.
4. Optimization of individual helices.
5. Optimization of the entire protein.
Throughout these steps, MPSim[20] was used with the Dreiding forcefield[21] for
the molecular mechanics and molecular dynamics steps unless otherwise
specified, with a dielectric constant of 2.5, and a 6-12 Lennard-Jones potential for
the van der Waals interactions.
TM Predictions
The prediction of the TM helical regions is based on the assumption that the
outward facing sections of the TM helices must be hydrophobic because they are
in contact with the hydrocarbon tails of the lipid bilayer, and that the hydrophobic
used in the TM2ndS program to determine the TM helical regions with a
hydrophobic profile and helical capping rules. To determine the hydrophobic
profile, sequences related to 5-HT2C were found with NCBI BLAST.[23] Of the
~200 sequences, we selected an ensemble of ~100 sequences having a uniform
distribution of sequence identities from 20% to <100%. These sequences
(including the target) were aligned with ClustalW to generate pairwise multiple
sequence alignments.[24] From the multiple sequence alignments, we kept only
the 40 sequences for mouse, rat and human receptors.
We used the Eisenberg hydrophobicity scale[25] (which assigns each amino
acid a hydrophobicity value ranging from −1.76 to 0.73) to estimate the
hydrophobicity for each residue position in the alignment, and we averaged this
over all of the sequences in the multiple sequence alignment. The Eisenberg
scale was used because we validated our TM predictions on bovine rhodopsin
using this hydrophobicity scale.[2] Then, we calculated the hydrophobic profile by
averaging the hydrophobicity over a range of window sizes ranging from 12 to 20,
and selected the lowest window size that gives seven peaks with lengths greater
than 20 residues. The baseline value is the average hydrophobicity over all of
the amino acids in the protein, which for 5-HT2C is 0.007. Because the TM
helices can extend past the membrane surface, we use capping rules to refine
the helix predictions. Known helix breakers are proline, glycine, arginine,
histidine, lysine, aspartic acid and glutamic acid. If any such helix breakers are
found within four residues toward the membrane, we keep the initial TM helix
found, but only up to six residues. Additionally, the capping rules include the
requirement that the intracellular and extracellular loops consist of at least six
residues. Then we define the hydrophobic center of each TM helix as the point
of maximum hydrophobicity averaged over the range of window sizes. The
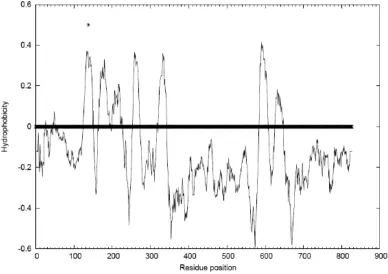
[image:19.612.138.526.246.520.2]hydrophobic profile for 5-HT2C is shown in Figure 1.
Figure 1. The hydrophobic profiles for the multiple sequence alignment of the 5-HT2C based on aligning the entire sequence. The bold line is the baseline hydrophobicity value.
The edges of some of the TM helices were not well defined, without any
residues left to form a loop between TM2 and TM3. Thus, to further refine the
predictions, each individual TM helix was BLAST searched separately. For each
make a new BLAST over the GPCR database to obtain a new set of sequences
(>20% identity) and then we did a new alignment with these sequences as input
to the TM2ndS program. Next, the peak for the specific helix was examined,
along with capping rules, to determine the edges of the helix. The hydrophobic
centers calculated with the entire protein sequence in the previous step were
retained. The predictions, before and after individual helical refinement and
helical capping, are given in Table 1. Table 1 shows that the final TM predictions
were taken to be the capped individual helix predictions, except for the case of
TM5. Here, the capping procedure added six residues to TM5, which we
considered to make the helix too long, especially in comparison to TM5 of 5-HT2B.
Thus, we adjusted the prediction for TM5 to end at a tyrosine.
Packing of the TM Helices into a Seven-Helix Bundle
The seven TM helices predicted by TM2ndS were next built in to a TM bundle.
First, we built each TM helix into a canonical right-handed alpha-helix with
extended side chain conformations. Then we placed each so that all seven have
their calculated hydrophobic centers in an imaginary plane running through the
center of the lipid bilayer.
We orient the most hydrophobic face of each helix to point away from the
center of the bundle (based on equal weight for each center) because we expect
that it will be energetically favorable for the most hydrophobic part of each helix
to be facing outward toward the hydrophobic lipid bilayer. This is achieved by
calculating the hydrophobic moment of each helix, considering the fifteen
the helix (considering 180o of the projection on a plane perpendicular to the
helical axis). The hydrophobic moment is pointed outward from the center of
mass of the protein.
Table 1. TM helix predictions for 5-HT2C
TM Predicted TM Region Predicti on Method
1 GVQNWPALSIVIIIIMTIGGNILVIMA GVQNWPALSIVIIIIMTIGGNILVIMAVSME GVQNWPALSIVIIIIMTIGGNILVIMA GVQNWPALSIVIIIIMTIGGNILVIMAVSME GVQNWPALSIVIIIIMTIGGNILVIMAVSME
Full protein, uncapped Full protein, capped Indiv. helix, uncapped Indiv. helix, capped Final Prediction
2 YFLMSLAIADMLVGLLVMPLSLLAILYD--Y ATNYFLMSLAIADMLVGLLVMPLSLLAILYD-- NYFLMSLAIADMLVGLLVMPLSLLAILYDY TNYFLMSLAIADMLVGLLVMPLSLLAILYD TNYFLMSLAIADMLVGLLVMPLSLLAILYD
Full protein, uncapped Full protein, capped Indiv. helix, uncapped Indiv. helix, capped Final Prediction
3 PRYLCPVWISLDVLFSTASIMHLCAISLDR RYLCPVWISLDVLFSTASIMHLCAISLDR PRYLCPVWISLDVLFSTASIMHLCAISLDR RYLCPVWISLDVLFSTASIMHLCAISLDR RYLCPVWISLDVLFSTASIMHLCAISLDR
Full protein, uncapped Full protein, capped Indiv. helix, uncapped Indiv. helix, capped Final Prediction
4 MKIAIVWAISIGVSVPIPVIG IMKIAIVWAISIGVSVPIPVIGL IMKIAIVWAISIGVSVPIPVIG AIMKIAIVWAISIGVSVPIPVIGL AIMKIAIVWAISIGVSVPIPVIGL
Full protein, uncapped Full protein, capped Indiv. helix, uncapped Indiv. helix, capped Final Prediction
5 FVLIGSFVAFFIPLTIMVITYCL FVLIGSFVAFFIPLTIMVITYCLTIYVLR FVLIGSFVAFFIPLTIMVITYCL FVLIGSFVAFFIPLTIMVITYCLTIYVLR FVLIGSFVAFFIPLTIMVITYCLTIY
Full protein, uncapped Full protein, capped Indiv. helix, uncapped Indiv. helix, capped Final Prediction
6 LGIVFFVFLIMWCPFFITNILSVLC LGIVFFVFLIMWCPFFITNILSVLCE LGIVFFVFLIMWCPFFITNILSV LGIVFFVFLIMWCPFFITNILSVLCE LGIVFFVFLIMWCPFFITNILSVLCE
Full protein, uncapped Full protein, capped Indiv. helix, uncapped Indiv. helix, capped Final Prediction
7 EKLLNVFVWIGYVCSGINPLVYT EKLLNVFVWIGYVCSGINPLVYT EKLLNVFVWIGYVCSGINPLVYT EKLLNVFVWIGYVCSGINPLVYT EKLLNVFVWIGYVCSGINPLVYT
Full protein, uncapped Full protein, capped Indiv. helix, uncapped Indiv. helix, capped Final Prediction
The calculation of the center fixes the z coordinate for each helix, while the
rotational orientation determines the η angle. There remain four other parameters
to uniquely position each helix: the x and y position in the plane through the
center of the lipid, the tilt θ of the helix from the z-axis perpendicular to the plane,
and the azimuthal angle φ for the tilting plane. These four parameters we take
from the 7.5 Å electron density map of frog rhodopsin.[26] This electron density
map gives the relative orientations of the helical axes, but no information about
translation or rotation of the helices. The original MembStruk was developed
using frog rhodopsin because there was no bovine rhodopsin x-ray available at
that time. We found that frog rhodopsin worked well and saw no need to change.
Only the overall x and y position and tilt (θ, φ) are used from the template. No
detailed atom information is used. Thus we use only undifferentiated electron
density information from experiment. We can take these parameters from any
crystal structure or from the structure of a predicted GPCR structure after explicit
lipid bilayer dynamics.
The six parameters x, y, z, θ, φ, and η for each helix uniquely determine how
to pack the seven helices into the bundle. Next, we need to determine the
structure within each helix. First, we used SCRWL[27] to place each side chain
appropriate for the seven-helix bundle. Then, we inserted counterions to offset
the charged residues not in salt bridges.
Rigid Body Dynamics of the Bundle in an Explicit Lipid Bilayer
In order to allow the helices to deviate from ideal alpha-helix structure, as is
molecular dynamics (NEIMO MD)[28] for each individual helix at 300 K for 500 ps.
The helices with prolines form bends due to the disruption of the alpha-helix
hydrogen bonding network. The lowest energy structure from the last 250 ps
was chosen and minimized (using conjugate gradients). Then, all seven
minimized helices were bundled together again by CRMS matching the
structures back on to the original positions. The side chains were then
reassigned using SCRWL, and the entire bundle was minimized. Finally, the
helices were again optimized rotationally and translationally as described in the
previous step.
Optimization of Individual Helices within the Bundle
Although the hydrophobic nature of the hydrocarbon tails in the membrane are
important in determining the rotational orientation of the helices, interhelical
hydrogen bonds and salt bridges also help stabilize the structure. Residues
conserved across all biogenic amine receptors are expected to be involved in
these hydrogen bonding interactions, playing a role in stabilization, binding,
and/or activation. Accordingly, it is likely that they will be facing in toward the
bundle in order to interact with the ligand or other helices. Moreover, TM3 is
near the center of the helical bundle, and hence it is less affected by the
membrane environment than the other helices. Consequently, orientation by
hydrophobic moment is less appropriate for TM3. Thus, we carried out
subsequent optimization of the rotational orientation of the helices by using
Starting with the phobic face orientation, we use energy minimization to
optimize the rotation of each helix. Here, each helix is rotated and optimized
through a range of angles. For each angle, the helices are rotated in the order 3
2 1 7 6 5 4, starting with the inner TM3 for which the phobic face orientation is
least likely to be optimum (because it interacts least with the hydrophobic
membrane). The procedure is as follows: The first helix is rotated 5o and −5o,
and for these angles, the side chain positions of all seven helices are reassigned
using SCRWL and the energy of the active helix is minimized (conjugate
gradients) in the field of all of the other helices (whose atoms are kept fixed).
The lowest energy conformation for the helix at 0o, 5o or −5o is chosen, and the
helix fixed at this angle. Then, in succession, each of the other six helices is put
through the same ±5o rotation procedure with the other helices fixed. After all
seven helices have been rotated ±5o and fixed in their lowest energy
conformation, the same procedure is repeated for increments of ±10o. This
process is repeated with 5o increments up to ±25o. Then the process is
continued with the angles decreased by 5o increments back down to ±5o, where
at each level all helices are allowed to adjust to the environment of the other
helices. The net rotations accomplished by this process for TMs 1 through 7 are
0o, 5o, −10o, 5o, 55o, 0o, and 10o.
After selecting this lowest energy rotation, the entire helical bundle is energy
minimized.
The helical bundle attained by energy-based rotation in the previous step is
layers around the bundle. The protein is first energy minimized in this bundle,
then we carry out 50 ps of rigid-body dynamics at 300 K are (using MPSim).[20] In
this calculation, the helices and lipid bilayer molecules are treated as rigid bodies.
This dynamics step helps to optimize the vertical helical translations and
rotations in an explicit lipid bilayer and to optimize the positions of the lipid
molecules with respect to the helical bundle. After this simulation, we used
SCRWL to replace the side chains, now using the lipid molecules as a bump test.
Next, we again considered helical rotations, but this time each helix was
rotated a full 360o, in increments of 5o, with the other six helices fixed during the
entire range of rotations. For each angle, we used SCRWL to reassign side
chains, and then energy minimized all atoms of the seven helices and the explicit
lipid bilayer.
For each rotated angle of a helix, the energy of the helix interacting with the
six other helices is tabulated, along with the number of interhelical hydrogen
bonds and the hydrophobic penalty. The hydrophobic penalty is calculated in
order to ensure that it is not favorable for polar and charged residues to point into
the lipid bilayer. With the lipids ignored, we consider that any residue with more
than 60% of its surface area accessible to a solvent probe of radius 2.0 Å is
pointing outward toward the lipid bilayer. Then the percentage of solvent
accessible surface for each residue pointing outward within seven amino acids of
the hydrophobic center is multiplied by the hydrophobicity value of the amino acid.
The hydrophobicity scale used is the average of the augmented Wimley White
hydrophobic penalty instead of the Eisenberg scale used to determine the TM
regions because it is thermodynamically based, and we are performing energy
calculations in this step. We are currently testing our TM prediction algorithm with
this thermodynamically based hydrophobicity scale. These calculated
hydrophobic penalty values were used to determine which region of angles to
choose for each of the six TMs (excluding TM3 which has little direct contact with
the lipid bilayer).
The specific residues involved in each interhelical hydrogen bond were
identified so that hydrogen bonds involving residues conserved within class A
and biogenic amine receptors could be given more importance in choosing
angles for combinatorial analysis. The residues focused on were
• ASN71 in TM1, ASP99 in TM2, and TRP179 in TM4 (all highly conserved
among class A GPCRs), and
• ASP134 in the center of TM3, TRP324 in TM6, and ASN364 in TM7,
(conserved among all mammalian biogenic amine receptors).[31]
Experiments on various GPCRs suggest that the TM2 aspartic acid forms a
hydrogen bonding network with the asparagines in TM1 and TM7.[32, 33] The TM3
aspartic acid is known to bind the amino functional group in biogenic amines.[34]
The TM4 tryptophan is the most highly conserved residue across the entire
GPCR superfamily, and is thought to be integral in structural stabilization.[34] The
TM6 tryptophan is believed to be important in activation.[34] TM5 is the least
conserved helix in GPCRs, suggesting its role in ligand specificity. A proline is
hydrogen bonding within the helix and create flexibility.[34] Thus, it would not
necessarily be pointing in to interact with other helices or the ligand.
The list of specific hydrogen bonds formed for each helical rotation is used
to help choose angles for combinatorial analysis.
• If a hydrogen bond occurs between two conserved residues, the angles
for the two helices are retained.
• If the hydrogen bond involves just one conserved residue, we choose the
angle or angles that retain the hydrogen bond and have the best
combination of energy, hydrogen bonding and hydrophobic penalty.
• If a helix does not have a conserved residue involved in a hydrogen bond,
the angle or angles with the best energy, number of hydrogen bonds and
hydrophobic penalty are selected.
The rotational profile for each TM is shown in Figure 2. Based on the selection
criteria, we selected 0o for TM1; 175o and −125o for TM2; 0o, −20o and −45o for
TM3; −50o and −75o for TM4; −35o and −75o for TM5; 90o for TM6; and 170o for
TM7. This leads to 24 cases, for each of which we used SCRWL to reassign
side chains and then minimized the energy. These structures were ranked by
number of hydrogen bonds and then by energy as shown in Table 2. The final
rotations for TMs 1 through 7 were
0o, −125o, −20o, −50o, −75o, 90o, and 170o.
The lipid and counter ions were removed from the final structure and it was fully
TM1
0 5 10 15
20 25 30 35 40 45 50 55 60 65 70 75 80 85 90 95 100 105 110 115 120 125 130 135 140 145 150 155 160 165 170 175 180 -175 -170 -165 -160 -155 -150 -145 -140 -135 -130 -125 -120 -115 -110 -105 -100 -95 -90 -85 -80 -75 -70 -65 -60 -55-50 -45-40 -35-30
-25-20-15-10 -5
Penalty
H-bonds
Energy
TM2
0 5 10 15
20 25 30 35 40 45 50 55 60 65 70 75 80 85 90 95 100 105 110 115 120 125 130 135 140 145 150 155 160 165 170 175 180 -175 -170 -165 -160 -155 -150 -145 -140 -135 -130 -125 -120 -115 -110 -105 -100 -95 -90 -85 -80 -75 -70 -65 -60 -55 -50-45 -40-35 -30-25-20 -15-10 -5 H-bonds Energy Penalty TM3 0
5 10 1520 25 30 35 40 45 50 55 60 65 70 75 80 85 90 95 100 105 110 115 120 125 130 135 140 145 150 155 160 165 170 175 180 -175 -170 -165 -160 -155 -150 -145 -140 -135 -130 -125 -120 -115 -110 -105 -100 -95 -90 -85 -80 -75 -70 -65 -60 -55-50 -45-40 -35-30
-25-20-15-10 -5
Energy
H-bonds
TM4
0
5 10 1520 25 30 35 40 45 50 55 60 65 70 75 80 85 90 95 100 105 110 115 120 125 130 135 140 145 150 155 160 165 170 175 180 -175 -170 -165 -160 -155 -150 -145 -140 -135 -130 -125 -120 -115 -110 -105 -100 -95 -90 -85 -80 -75 -70 -65 -60 -55-50 -45-40 -35-30
-25-20-15-10 -5
H-bonds
Penalty
TM5
0 5 10 15
20 25 30 35 40 45 50 55 60 65 70 75 80 85 90 95 100 105 110 115 120 125 130 135 140 145 150 155 160 165 170 175 180 -175 -170 -165 -160 -155 -150 -145 -140 -135 -130 -125 -120 -115 -110 -105 -100 -95 -90 -85 -80 -75 -70 -65 -60 -55 -50-45 -40-35 -30-25-20 -15-10 -5 Energy Penalty H-bonds TM6 0 5 10 15
20 25 30 35 40 45 50 55 60 65 70 75 80 85 90 95 100 105 110 115 120 125 130 135 140 145 150 155 160 165 170 175 180 -175 -170 -165 -160 -155 -150 -145 -140 -135 -130 -125 -120 -115 -110 -105 -100 -95 -90 -85 -80 -75 -70 -65 -60 -55-50 -45-40 -35-30
-25-20-15-10 -5
Penalty H-bonds Energy
TM7
0 5 10 15
20 25 30 35 40 45 50 55 60 65 70 75 80 85 90 95 100 105 110 115 120 125 130 135 140 145 150 155 160 165 170 175 180 -175 -170 -165 -160 -155 -150 -145 -140 -135 -130 -125 -120 -115 -110 -105 -100 -95 -90 -85 -80 -75 -70 -65 -60 -55-50 -45-40 -35-30
-25-20-15-10 -5
Penalty
[image:29.612.110.532.72.573.2]Energy H-bonds
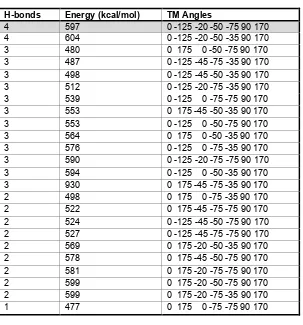
Table 2. Combinatorial analysis
H-bonds Energy (kcal/mol) TM Angles
4 597 0 -125 -20 -50 -75 90 170
4 604 0 -125 -20 -50 -35 90 170
3 480 0 175 0 -50 -75 90 170
3 487 0 -125 -45 -75 -35 90 170
3 498 0 -125 -45 -50 -35 90 170
3 512 0 -125 -20 -75 -35 90 170
3 539 0 -125 0 -75 -75 90 170
3 553 0 175 -45 -50 -35 90 170
3 553 0 -125 0 -50 -75 90 170
3 564 0 175 0 -50 -35 90 170
3 576 0 -125 0 -75 -35 90 170
3 590 0 -125 -20 -75 -75 90 170
3 594 0 -125 0 -50 -35 90 170
3 930 0 175 -45 -75 -35 90 170
2 498 0 175 0 -75 -35 90 170
2 522 0 175 -45 -75 -75 90 170
2 524 0 -125 -45 -50 -75 90 170
2 527 0 -125 -45 -75 -75 90 170
2 569 0 175 -20 -50 -35 90 170
2 578 0 175 -45 -50 -75 90 170
2 581 0 175 -20 -75 -75 90 170
2 599 0 175 -20 -50 -75 90 170
2 599 0 175 -20 -75 -35 90 170
1 477 0 175 0 -75 -75 90 170
[image:30.612.175.478.92.417.2]Calculated energy and number of hydrogen bonds for the combinatorial set of TM angles chosen from the rotational analysis. The structures are ordered by hydrogen bonds and then by energy.
Prediction of Ligand Binding Sites
Given the final minimized structure for the apo-protein of 5-HT2C, we then docked
various known ligands into the receptor:
• serotonin, the endogenous ligand, an agonist;
• three strongly binding antagonists: ritanserin, metergoline and
methiothepin; and
• a series of ten analogs of psilocybin, both agonists and antagonists.
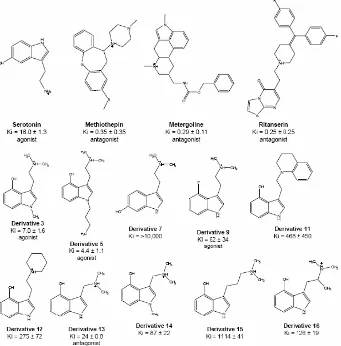
These ligands are shown in Figure 4.
[image:31.612.155.496.298.644.2]
The ligands were built and minimized (Cerius2) using the Dreiding force field
with Mulliken charges from quantum mechanics (B3LYP flavor of DFT using the
6-31G** basis set, calculated with Jaguar). We also calculated the pKa values
for each ligand using the pKa module of Jaguar to determine if the ligand would
be charged, and which atom would become protonated at biological pH 7.4.
These pKa values are listed in Table 5. The docking was done with flexible
ligands and a rigid protein.
To search for the best binding site for each ligand, we first alanized the bulky
nonpolar residues (leucine, isoleucine, valine, phenylalanine, tryptophan and
tyrosine). That is, each was mutated to alanine. Then we used the negative of
the molecular surface of the alanized protein to define the regions in which to
sample different ligand conformation. These void regions were mapped with a
set of spheres. Then, we defined 36 boxes, each a cube with 10 Å sides, grown
from the center of mass of the spheres and covering the entire receptor. Each
ligand was docked (using Dock 4.0) into all 36 boxes and ranked by interaction
energy and buried surface. Then, we examined the boxes with a combination of
the strongest bonding and buried surface, and selected boxes with a continuous
range of spheres for subsequent docking with MSCDock. As an example, the
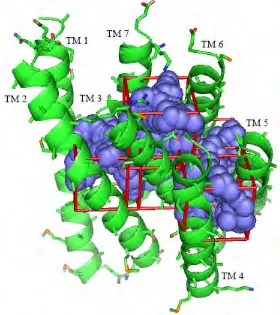
sphere set that the antagonists were docked into is shown in Figure 5.
We then used MSCDock to dock each ligand into the selected boxes using
the dock with diversity method. This method uses Monte Carlo search
techniques to find sites that pass bump tests and groups these into families for
carried out until the number of families is saturated. Then we select the 50
families with the best combination of energy and buried surface and continue
generating docking configurations until there is an average of six children in each
family. Then we calculated the energy for each child of each of these families,
[image:33.612.195.475.239.554.2]and associate the energy with the family head.
Figure 5. The boxes containing the spheres into which the antagonists ritanserin, methiothepin and metergoline were docked. All of the bulky, nonpolar residues have been alanized.
Next for each of these 50 ligand configurations, we dealanize the bulky
nonpolar residues back to their original form and reassign all side chains within 5
kcal/molÅ RMS force) the ligand and residues within 5 Å of the ligand with the
rest of the protein fixed. Then we minimize the entire complex to 0.2 kcal/molÅ
RMS force.
The top ten structures by total energy of the ligand-protein complex were
selected as the best docked structures. From these top ten structures, we
selected the one with the best contacts between the functional groups of the
ligand and the residues in the binding site. Then we used SCREAM to reassign
the side chains for the residues interacting most favorably with the functional
groups of the ligand to obtain their optimal orientation with respect to the ligand.
The ligand and residues within 5 Å were put through one quench-anneal cycle
(50 K to 600 K and back over 11.5 ps), selecting the structure with the lowest
potential energy structure. This was followed by minimizing the energy of the
entire ligand-protein complex.
Serotonin, ritanserin, metergoline and methiothepin were all docked following
this procedure. For the 10 SAR ligands, we chose derivative 3 as the template
and docked it using the above procedure. Then, we generated a sphere set
fitted to a region within 0.8 Å radius around the best docked derivative 3
molecule. Then the entire docking procedure was carried out over this smaller
region for the other nine SAR ligands, keeping the bulky residues in place (not
mutated to alanine).
Molecular Dynamics Simulation
A simulation was performed on serotonin bound in 5-HT2C in order to determine
5 ns of full solvated lipid bilayer simulation. First, loops were added with a Monte
Carlo loop builder. Only the first and last ten residues of the ic3 loop were added.
The loops were built so that the disulfide bridge between the two cysteines in ec2
and the top of TM3 was preserved. Ten residues each of the N-terminus and
C-terminus were added. Then, the helices and side chains were frozen while loops
were put through a quench-anneal cycle. Next,
palmitoyloleoyl-phosphatidylethanolamine (POPE) lipid molecules were added, along with a
layer of water above and below. Chloride ions were added to neutralize the
charge of the system. The membrane and water molecules were minimized with
the protein fixed, and then equilibrated for 500 ps in an NPT simulation. Then
the loops were minimized along with the membrane and water molecules, and
equilibrated for 500 ps in an NPT simulation. Finally, the entire system was
minimized, and then 5 ns of NPT simulation was run. All NPT simulations were
run using Langevin dynamics with a damping coefficient of 1 ps-1 and a bath
temperature of 310 K. The pressure was kept constant by Nosé-Hoover
Langevin piston pressure control, with a target pressure of 1 atm and barostat
oscillation and damping times of 200 fs. The stepsize was 1 fs, with periodic
boundary conditions applied. Particle mesh Ewald was used for electrostatic
calculations, with a nonbond cutoff of 12.0 Å and the nonbonded interactions of
all 1-3 pairs included. The energy and volume of the system equilibrated quickly,
Total energy of serotonin bound in 5-HT2C in a solvated lipid bilayer
-30000 -29500 -29000 -28500 -28000 -27500 -27000
0 500 1000 1500 2000 2500 3000 3500 4000 4500 5000
Time (ps) Energy
(kcal/mol)
Total volume of serotonin bound in 5-HT2C in a solvated lipid bilayer
340000 341000 342000 343000 344000 345000 346000 347000 348000 349000 350000
0 500 1000 1500 2000 2500 3000 3500 4000 4500 5000
Time (ps)
Volume
[image:36.612.117.512.376.644.2](cubic Ang)
Binding Energy Calculations
For all the docked structures, the binding energies were calculated as
Ebind = Ecomp,vac – Eprot,vac – Elig,vac – Elig,solv.
Since the binding energy is the change in energy upon binding, more negative
binding energies indicate stronger binding. The energies of the separate protein
and ligand were not reminimized. That is, they were taken directly from the
bound complex (to obtain the snap binding energy). This assumes that there is
little change in energy of the separated ligand and protein upon minimization.
This also does not take the solvation of the complex or the protein into
consideration. However, for small molecules binding in the core of the protein
like those we are working with, the solvation energy of the bound complex should
not differ greatly from that of the unbound protein. The solvation energy of the
ligand was calculated using the Poisson-Boltzmann continuum solvent
approximation (dielectric constant of 80 and solvent radius of 1.4 Å) using the
Delphi program. The vacuum energies were calculated with MPSim, as in all of
the structure prediction steps, so the solute dielectric was 2.5.
Next, we neutralized all charged residues of the system and the ligand by
transferring the hydrogen of each salt bridge from the acceptor back to the donor
and by adding a proton to each exposed Asp or Glu and removing one from each
Lys and Arg. We used a modified Dreiding forcefield that included special
hydrogen bonding parameters chosen to reproduce the binding for dimers of
analogous residues found from QM. Each full ligand-protein complex was then
according to the same equation as for the charged case, but with the addition of
a pKa penalty term. This is the energy change required to neutralize the ligand
or residue that prefers to be charged in water solvent. For a positively charged
ligand this is equal to 1.4 * (pKa − 7.4) kcal/mol.
This modified neutral Dreiding forcefield was also used to calculate the
contributions of individual residues to binding. As in all of the other Dreiding
calculations, the dielectric constant was 2.5, with van der Waals interactions
calculated by a 6-12 Lennard-Jones potential. The nonbond interactions were
calculated between the bound ligand and all residues within 5 Å of the ligand.
The neutral residue scheme is an improvement over the charged residue
scheme for the binding energy calculations because it decreases the large
variations between complexes caused by exaggerated long-range Coulombic
interactions between charged groups. These exaggerated interactions are due
to the fact that the charges are fixed in molecular mechanics, so charge
screening is not present to damp the long-range interactions. Additionally, in the
hydrophobic membrane environment, many of the residues may already be
neutral. The neutralization procedure is carried out for the binding energy
calculations and not the docking procedure because the large Coulombic
interactions are important to ensure that binding modes with a salt bridge are
Results and Discussion
Serotonin Binding
Serotonin is the endogenous agonist to 5-HT2C with a binding constant of Ki =
16.0 nM.[36] The predicted binding site for serotonin to our predicted structure for
5-HT2C is shown in Figure 7 and the cavity analysis is in Table 3. The most
important contacts are
• D134(3) forms a salt bridge with the protonated primary amine site
(8.7 kcal/mol), which makes excellent sense. Indeed, experiments
suggest that D134(3) creates a salt bridge with the protonated nitrogen of
biogenic amines.[34]
• The protonated primary amine also forms a hydrogen bond with S138(3)
(5.7 kcal/mol).
• The aromatic indole group has very good van der Waals interactions with
F223(5) (3.0 kcal/mol) and F328(6) (4.9 kcal/mol). The ring is stacked
between the two phenylalanines.
• The polar NH of the indole forms a hydrogen bond with S219(5)
(6.5 kcal/mol).
• The OH substituent of the indole forms hydrogen bonds both with S141(3)
(3.3 kcal/mol) and W324(6) (2.0 kcal/mol).
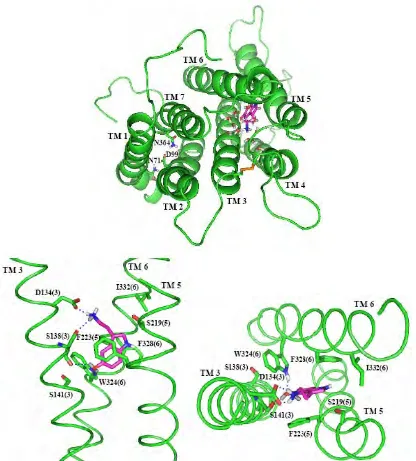
• There is good van der Waals interaction between the indole and I332(6)
Figure 7. The predicted structure (side and top views) of serotonin bound to 5-HT2C. TMs 1, 2, 4 and 7 are not shown since they do not interact directly with the ligand. The residues shown are those within 5.0 Å of serotonin that have more than 2 kcal of favorable interaction with the ligand. The dotted lines indicate hydrogen bonds with serotonin.
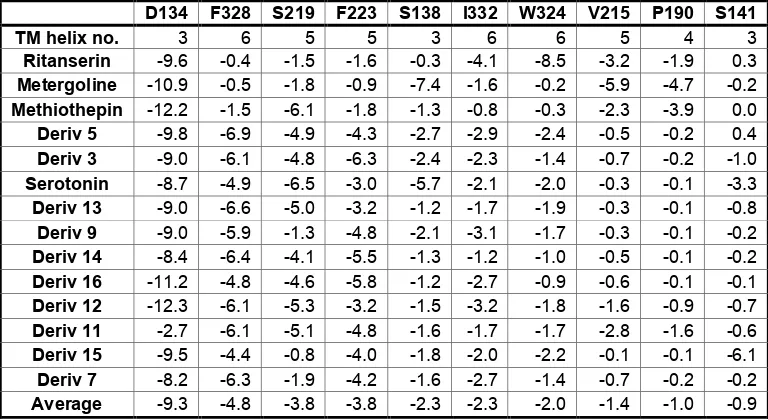
Table 3. Nonbond interaction energies (kcal/mol) between each ligand and individual residues within 5.0 Å of the ligand
D134 F328 S219 F223 S138 I332 W324 V215 P190 S141
TM helix no. 3 6 5 5 3 6 6 5 4 3
Ritanserin -9.6 -0.4 -1.5 -1.6 -0.3 -4.1 -8.5 -3.2 -1.9 0.3
Metergoline -10.9 -0.5 -1.8 -0.9 -7.4 -1.6 -0.2 -5.9 -4.7 -0.2
Methiothepin -12.2 -1.5 -6.1 -1.8 -1.3 -0.8 -0.3 -2.3 -3.9 0.0
Deriv 5 -9.8 -6.9 -4.9 -4.3 -2.7 -2.9 -2.4 -0.5 -0.2 0.4
Deriv 3 -9.0 -6.1 -4.8 -6.3 -2.4 -2.3 -1.4 -0.7 -0.2 -1.0
Serotonin -8.7 -4.9 -6.5 -3.0 -5.7 -2.1 -2.0 -0.3 -0.1 -3.3
Deriv 13 -9.0 -6.6 -5.0 -3.2 -1.2 -1.7 -1.9 -0.3 -0.1 -0.8
Deriv 9 -9.0 -5.9 -1.3 -4.8 -2.1 -3.1 -1.7 -0.3 -0.1 -0.2
Deriv 14 -8.4 -6.4 -4.1 -5.5 -1.3 -1.2 -1.0 -0.5 -0.1 -0.2
Deriv 16 -11.2 -4.8 -4.6 -5.8 -1.2 -2.7 -0.9 -0.6 -0.1 -0.1
Deriv 12 -12.3 -6.1 -5.3 -3.2 -1.5 -3.2 -1.8 -1.6 -0.9 -0.7
Deriv 11 -2.7 -6.1 -5.1 -4.8 -1.6 -1.7 -1.7 -2.8 -1.6 -0.6
Deriv 15 -9.5 -4.4 -0.8 -4.0 -1.8 -2.0 -2.2 -0.1 -0.1 -6.1
Deriv 7 -8.2 -6.3 -1.9 -4.2 -1.6 -2.7 -1.4 -0.7 -0.2 -0.2
Average -9.3 -4.8 -3.8 -3.8 -2.3 -2.3 -2.0 -1.4 -1.0 -0.9
[image:40.612.132.516.437.647.2]Overall, the bound structure for serotonin looks reasonable, with each polar
functional group of serotonin making favorable interactions with a polar or
charged residue in the binding pocket and with excellent aromatic interactions.
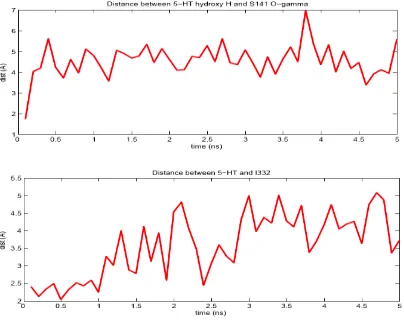
Bound Serotonin Dynamics
In order to determine the stability of this bound structure, we carried out a 5 ns
simulation of this complex in an explicit lipid bilayer. This simulation shows the
predicted structure and binding site to be stable for 5 ns. The structure after 5 ns
is shown in Figure 8. Some of the hydrogen bond contacts made with serotonin
do change throughout the simulation, but the ligand stays in the same binding
site, just moving a little downward toward the intracellular region. The hydrogen
bond with S219(5) and the van der Waals interactions with I332(6) are lost as
serotonin moves downward. The hydrogen bond with S141(3) is lost as the
oxygen of the OH substituent of serotonin forms a very strong hydrogen bond
with W324 and the hydrogen of the OH group forms a hydrogen bond with the
backbone oxygen of S138(3). Both D134(3) and S138(3) maintain their strong
hydrogen bonds with the protonated amine group of serotonin. Additionally, both
F223(5) and F328(6) preserve their strong van der Waals interactions with the
indole serotonin throughout the simulation. The distances between serotonin
and key residues during the simulation are shown in Figure 9. Waters enter the
binding site and accumulate around the salt bridge between D134(3) and
serotonin. There were no additional restraints placed on the helices to prevent
them from unraveling, so the C-terminus of TM1 unraveled by two residues, the
the N-terminus of TM7 by one residue. The TMs 1-2-7 hydrogen bonding
network is retained, although the helices do translate with respect to each other
[image:42.612.118.534.154.615.2]during dynamics.
Figure 9. The calculated distances between serotonin and residues predicted to be important in binding at 50 evenly spaced snapshots of the 5 ns simulation.
Comparison to Mutagenesis Experiments
Since no experimentally determined structures for any serotonin receptors are
available, experimental validation must come from additional mutagenesis
studies, in which residues in the active site are mutated to various amino acids
and the effect on ligand binding determined. Many experimental studies have
been performed on 5-HT2 receptors, with the majority of the mutation
experiments focused on 5-HT2A. Although there are differences between the
5-HT2A and 5-HT2C in the predicted TM regions, so it can be useful to compare
our predicted structure with experimental findings on 5-HT2C.
• D155(3) in 5-HT2A, which corresponds to D134(3) in 5-HT2C was found to
anchor the terminal amine moiety of serotonin,[37] as we predict in 5-HT2C.
• An alanine substitution of S159(3) in 5-HT2A, corresponding to S138(3) in
5-HT2C, was found to decrease serotonin binding by 18-fold,[38] leading to
the proposal that S159(3) forms a hydrogen bond with the protonated
amine group of serotonin, just as we predict for 5-HT2C.
• S239(5) in 5-HT2A, which is an alanine in 5-HT2C that is one turn away
from S219(5), is proposed to form a hydrogen bond to the polar NH of the
indole in serotonin.[39] We predict that in 5-HT2C, the NH of the indole in
serotonin forms a hydrogen bond with S219(5), but we find this hydrogen
bond to disappear after 5 ns of dynamics.
• F243(5) and F244(5) in 5-HT2A are found to have significant interactions
with serotonin, with both predicted to point in toward the binding pocket.[40]
F243(5) in 5-HT2A corresponds to F223(5) in 5-HT2C, which we predict to
have very good van der Waals interactions with serotonin, but we predict
F224(5) not to interact strongly with serotonin in 5-HT2C.
• Mutation of F340(6) to leucine in 5-HT2C significantly decreases serotonin
binding, but mutation of F339(6) to leucine did not affect binding.[41] We
predict the same effect in 5-HT2C with serotonin making very good van der
Waals interactions with F328(6), but not significantly interacting with
• Mutation of W336(6) to alanine was found to cause an almost 1000-fold
decrease in serotonin binding in 5-HT2A.[42] We predict the corresponding
residue in 5-HT2C, W324(6), to have good van der Waals and hydrogen
bonding interactions with serotonin.
Our predicted serotonin binding site for 5-HT2C has many similarities to
experimentally determined features of the 5-HT2A binding site. A homology
model of 5-HT2C based on the crystal structure of bovine rhodopsin[3], produced
by the WHAT IF program[43] does not agree with these mutagenesis experiments
as well as our predicted structure. TM5 has S219(5) pointed away from the
binding pocket, towards TM6. Additionally, D134(3) is pointed towards the
1-2-7 pocket instead of the 5-6-1-2-7 pocket. Thus, serotonin would not bind in the
3-5-6-7 pocket, as expected for biogenic amine receptors.[44]
The recently determined experimental structure of the beta(2)-adrenergic
receptor[5] has more similarities to our predicted structure for 5-HT2C than does
the structure of bovine rhodopsin, but there are still some key differences in the
predicted binding site. The TM5 serine in the beta2 structure that corresponds to
S219(5) in 5-HT2C is pointing in toward TM3. However, the well conserved TM3
aspartic acid in beta2 thought to anchor the protonated amine of bound biogenic
amines is pointing towards the 1-2-3-7 pocket, as seen in bovine rhodopsin.
Thus, in a homology model of 5-HT2C based on the crystal structure of the
beta(2)-adrenergic receptor, serotonin cannot make good contacts with both
Based on our predicted bound structure and its dynamics, additional
experiments that could help validate our predicted binding site are D134A,
S138A, F328A, F223A and W324, all of which would lead to significant
decreases in serotonin binding affinity. Although the simulation shows the
hydrogen bond between serotonin and S219(5) to be absent after 5 ns, it may
reappear after a longer simulation, so S219A could also lead to a decrease in
serotonin binding affinity.
Ritanserin Antagonist Binding
Ritanserin is an antagonist to 5-HT2C with a binding constant of Ki = 0.25 nM.[45]
It is used for the treatment of many neurological disorders. The predicted binding
site for ritanserin to our predicted structure for to 5-HT2C is shown in Figure 10
and the cavity analysis is in Table 3. The most important contacts are as follows.
• The protonated nitrogen of the piperidine forms a salt bridge with D134(3)
(9.6 kcal/mol).
• The oxygen of the pyrimidine makes a hydrogen bond with W324(6)
(8.5 kcal/mol).
• The aromatic thiazolo-pyrimidine group has strong van der Waals
interactions with F137(3) (4.9 kcal) and N331(6) (2.2 kcal).
• The flourophenyl groups have strong van der Waals interactions with
I332(6) (4.1 kcal/mol) and V215(5) (3.5 kcal/mol).
Note that the sulfur of the thaizole does not make strong interactions with polar or
modifying I363(7) or V359(7) to polar residues able to hydrogen bond with the
sulfur. Additionally, the fluorines of the antagonists do not interact strongly with
polar or charged residues. They may be interacting with the charged head
groups of the lipid molecules, water molecules that enter the binding site, or
charged or polar residues in the loops.
Metergoline Antagonist Binding
Metergoline is an antagonist to 5-HT2C with a binding constant of Ki = 0.29 nM.[36]
Metergoline is used as an analgesic in migraine headaches. The predicted
binding site for metergoline to our predicted structure for to 5-HT2C is shown in
Figure 10 and the cavity analysis is in Table 3. The most important contacts are
as follows.
• D134(3) forms a salt bridge with the protonated nitrogen of the ergoline
(10.9 kcal/mol).
• Both the N-H group of the amide and the carboxyl oxygen of the ester
makes hydrogen bonds with S138(3) (7.4 kcal/mol).
• The aromatic ergoline group has strong van der Waals interactions with
V215(5) (5.9 kcal/mol), P190(4) (4.7 kcal/mol), F214(5) (2.5 kcal/mol), and
I189(4) (2.5 kcal/mol).
• The phenyl group has good van der Waals interactions with I142(3)
Methiothepin Antagonist Binding
Methiothepin is an antagonist to 5-HT2C with a binding constant of Ki = 0.35
nM.[45] It is used as an antipsychotic. (S)-methiothepin was docked for this study.
The predicted binding site for methiothepin to our predicted structure for to
5-HT2C is shown in Figure 10 and the cavity analysis is in Table 3. The most
important contacts are as follows.
• D134 interacts with the protonated N at the center of methiothepin
(12.2 kcal/mol).
• The piperazine NH forms a hydrogen bond with S219(5) (6.1 kcal/mol).
• The two benzene rings have good van der Waals interactions with
P190(4) (-3.9 kcal/mol), W128(3) (2.8 kcal/mol) and V225(5) (2.3 kcal/mol).
• I189(4) has good van der Waals interactions with the thiol ether
(2.5 kcal/mol).
Note that neither sulfur in methiothepin makes strong interactions with polar or
charged residues. This suggests that improved binding might be obtained by
modifying I131(3), V135(3), G218(5) or I189(4) to polar residues able to form
hydrogen bonds with the sulfurs. If S186(4) was modified to an asparagine or a
threonine, it may be long enough to form a hydrogen bond with the thiol ester
sulfur.
SAR for Psilocybin Analogs
Since there is so little mutation data available for 5-HT2C, we will validate our
predicted GPCR structure and binding sites by comparing calculated binding
psilocybin analogs in which small structural changes were found to result in large
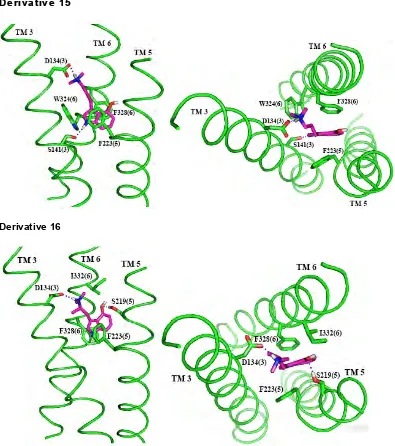
changes in binding affinity.[46] The binding modes for the SAR ligands are shown
in Figure 11. The strength of interaction for each ligand with important residues
in the binding cavities is given in Table 3.
The binding site of the SAR ligands can explain most of the experimental
binding data. All of the ligands form a salt bridge with D134 except derivative 11,
which pKa calculations show to be neutral in solution. Derivatives 3, 5, 11, 12,
13, 14 and 16 form strong hydrogen bonds between the hydroxyl group of the
phenol and S219. The position of the hydroxyl group in derivative 7 prevents any
hydrogen bonding with S219, which in part leads to its bad binding. The fluorine
in derivative 9 that takes the place of the hydroxyl group does not hydrogen bond
with S219, but still has favorable interactions with S219, so the binding to 5-HT2C
is not as strong as for derivative 3 or 5, but is still fairly strong. In derivatives 13
and 14, the carbon chain is shorter than in serotonin, but this ligand can still form
hydrogen bonds with S219. However, they do not bind as strongly as derivatives
3 and 5, which have the same length carbon chain as serotonin. A cavity
analysis shows that there are decreased interactions with I332 and S138 in
derivatives 13 and 14 compared to derivatives 3 and 5. Derivative 16 also has
decreased interaction with S138, caused by the extra methyl group branching
from the carbon chain, causing part of the decrease in binding affinity compared
to derivative 3. In derivative 15, the length of the carbon chain connecting the
protonated amine group and the aromatic rings does not allow for hydrogen
bond to S141. However, experiments show that derivative 15 does not bind well
to 5-HT2C, so this hydrogen bond with S141 may not in fact form. S141 could be
interacting instead with the backbone of TM3 or forming an interhelical hydrogen
bond, maybe with W324, as it does in the dynamics for serotonin bound in
5-HT2C. Similarly, the predicted binding site of derivative 12 cannot explain the
experimentally observed low binding affinity.
Derivative 3