Original citation:
Foo, Mathias, Kim, Jongrae, Sawlekar, Rucha and Bates, Declan. (2017) Design of an
embedded inverse-feedforward biomolecular tracking controller for enzymatic reaction
processes. Computers & Chemical Engineering . doi: 10.1016/j.compchemeng.2017.01.027
Permanent WRAP URL:
http://wrap.warwick.ac.uk/85121
Copyright and reuse:
The Warwick Research Archive Portal (WRAP) makes this work of researchers of the
University of Warwick available open access under the following conditions.
This article is made available under the Creative Commons Attribution 4.0 International
license (CC BY 4.0) and may be reused according to the conditions of the license. For more
details see:
http://creativecommons.org/licenses/by/4.0/
A note on versions:
The version presented in WRAP is the published version, or, version of record, and may be
cited as it appears here.
Design of an embedded inverse-feedforward biomolecular
tracking controller for enzymatic reaction processes
Mathias Fooa,∗, Jongrae Kimb, Rucha Sawlekara, Declan G. Batesa
aWarwick Integrative Synthetic Biology Centre, School of Engineering, University of Warwick, Coventry, CV4 7AL, UK.
bSchool of Mechanical Engineering, University of Leeds, Leeds, LS2 9JT, UK.
Abstract
Feedback control is widely used in chemical engineering to improve the performance
and robustness of chemical processes. Feedback controllers require a ‘subtractor’ that
is able to compute the error between the process output and the reference signal. In the
case of embedded biomolecular control circuits, subtractors designed using standard
chemical reaction network theory can only realise one-sided subtraction, rendering
standard controller design approaches inadequate. Here, we show how a
biomolec-ular controller that allows tracking of required changes in the outputs of enzymatic
reaction processes can be designed and implemented within the framework of
chem-ical reaction network theory. The controller architecture employs an inversion-based
feedforward controller that compensates for the limitations of the one-sided subtractor
that generates the error signals for a feedback controller. The proposed approach
re-quires significantly fewer chemical reactions to implement than alternative designs, and
should have wide applicability throughout the fields of synthetic biology and biological
engineering.
Keywords: process control, enzymatic reaction process, chemical reaction network
theory, synthetic biology, biological engineering
Abbreviation: Chemical Reaction Network (CRN), Deoxyribonucleic Acid (DNA),
∗Corresponding author
Left-Hand-Side (LHS), Right-Hand-Side (RHS), Ordinary Differential Equation (ODE),
Proportional-Integral (PI), Feedforward (FF), Internal Model Control (IMC), DNA
Strand Displacement (DSD)
1. Introduction
A major challenge in synthetic biology is to develop practically implementable
de-sign methods for the synthesis of feedback controllers that achieve reference tracking,
i.e. force the output of a biomolecular process of interest to track desired changes in
its concentration over time (Hsiao et al., 2015). The design of feedback controllers to
5
control biochemical processes has received significant attention in the literature (see.
e.g. (Henson, 2003; Baldea et al., 2013)), and the construction of synthetic control
circuits has become a major focus of research in the new field of synthetic biology.
Ideally, such circuits should be made up of well-defined modules consisting only of
molecular reactions, in order to allow the realisation of embedded biomolecular
con-10
trol systems (Cosentino et al., 2016). A promising approach to facilitating the design
of such circuits is provided by nucleic acid-based chemistry, wherein the design of
biomolecular circuits can be done using abstract chemical reaction network (CRN)
theory (e.g. (Soloveichik et al., 2010)), and then translated to Deoxyribonucleic acid
(DNA) using strand displacement reactions for implementations (Chen et al., 2013). A
15
CRN is a collection of chemical reactions written in the form
X+Y+. . .
| {z }
Reactants γ
−
→A+B+. . .
| {z }
Products
(1)
whereγis the reaction rate, the Left-Hand-Side (LHS) of the reaction consists of
reac-tants and the Right-Hand-Side (RHS) of the reaction consists of products. Most of the
chemical reactions considered in this paper are either unimolecular (i.e. one reactant
on the LHS of (1)) or bimolecular (i.e. two reactants on the LHS of (1)). According
20
to standard CRN theory (see e.g. (Feinberg, 1986, 1988)) a CRN withnspecies and
generalised mass-action kinetic in the form of
dx
dt =P f(x)
wherex∈Rn≥0 is the species concentration, f(x)∈Rm is a function describing the
reaction rates of the CRN,P∈Rn×m is thestoichiometric matrix that describe the
25
dynamics of the species concentrations following their associated reaction rates,R≥0
is the non-negative real number set,Ris the real number set, andnandmare positive
integers.
In any reference tracking feedback system, it is imperative that an appropriate error
signal can be computed such that the designed controller can take relevant control
ac-30
tion to drive the process output towards the intended state. While such a requirement is
trivial to satisfy in standard control theory, it is not in the context of CRN theory. This
is because a two-sided subtractor (Figure 1), which is an operator that is able to
com-pute the difference between two input signals regardless of their relative magnitude, is
yet to be realised using standard CRN’s. For accurate reference tracking, the errore
35
should be able to take both positive (r>y) and negative (r<y) values. Thus, the
afore-mentioned constraint is a serious impediment to the design of functional biomolecular
feedback control systems, that will inevitably lead to poor quality reference tracking
and potentially even instability.
To the best of the authors knowledge, almost all previous designs for biomolecular
40
subtractors using CRNs have resulted in only one-sided subtraction. We note that there
is a literature on the design of half-subtractors or full-subtractors using digital logic
gates realised using CRNs (see e.g. (Xu et al., 2013; Lin et al., 2015)), however, as our
focus is on the design of analog biomolecular circuitry, we exclude this work from our
discussion.
45
The subtraction operator used in our paper is based on the design presented in
Buisman et al. (2009), which can be realised using a set of four chemical reactions
(see Page 6 of Buisman et al. (2009)). The authors analysed the Jacobian matrix of
the ODE associated with the subtraction operator and found that when the resulting
subtraction is zero, the fixed point does not exist. Additionally, when the resulting
traction is negative, the overall system diverges, as the fixed point is unstable. In view
of this, the subtraction outputs a positive value when the magnitude of the first
com-ponent is greater than the second comcom-ponent and zero when the condition is reversed.
We further illustrate this point in Section 2.2 of our paper. Some other relevant results
on biomolecular subtraction can be found in Salehi et al. (In press) and Song et al.
55
(2016). The design considered in the former used the subtraction operator to realise a
biomolecular computation of a Berstein polynomial and their subtraction is equivalent
to the design of Buisman et al. (2009). The latter paper proposed frameworks to build
operators using DNA strand displacement, and explicitly mentioned that their
subtrac-tion operator is one-sided. In Harris et al. (2015), the authors designed a feedback
60
controller for gene expression regulation, which requires the use of a subtraction, but
do not propose a detailed biomolecular implementation of the subtraction operator.
An alternative approach to the design of biomolecular subtraction operators can be
found in Cosentino et al. (2013, 2016) and Bilotta et al. (2015, 2016). In this work,
the authors developed subtractors that are used to compute the difference between two
65
molecular fluxes, rather than two molecular concentrations. By satisfying certain
con-ditions, and assuming all the reactions involve unitary stoichiometric coefficients with
input fluxes constant, the output flux is shown to converge to the difference between
the two input fluxes in an asymptotic manner. While the chemical reactions required
to realise the subtraction operator in this framework are slightly different to the ones
70
proposed in Buisman et al. (2009), the final ODE representation is exactly the same,
and thus also yields a one-sided subtraction.
The only available partial solution to the problem mentioned above is to adopt the
design framework proposed in Oishi and Klavins (2011). In this framework, each
sig-nal in the biomolecular circuit is implemented as the difference in the concentration
75
of two chemical species. In this way, a two-sided subtraction operator can then be
re-alised. As we show in the following section, however, this approach at least doubles the
total number of chemical reactions required to implement the entire feedback circuit.
This increase in the number of chemical reactions is highly undesirable as it presents a
major challenge for wet lab implementation, and strongly limits the scalability of the
80
proba-bility of unwanted crosstalk interactions. For instance, a circuit whose implementation
requiresnmolecular species will increase the potential bimolecular crosstalk
interac-tions byn2. This has prompted researchers to look into ways to reduce crosstalk, such
as requiring a certain number of mismatches for any two distinct recognition domains
85
(see e.g. (Qian and Winfree, 2011)). Nonetheless, obtaining large numbers of
well-behaved sequences with long domains is extremely difficult to achieve in practice.
In this paper, using the available framework for realising one-sided biomolecular
subtraction using CRNs (see e.g. (Buisman et al., 2009)), we propose a design strategy
that uses a model-inversion feedforward controller (see e.g. (Devasia, 2002; Franklin
90
et al., 2014)) to circumvent the limitations of the feedback controller when using a
one-sided subtraction operator. In addition, our controller design strategy also aims
to utilise the minimal number of chemical reactions, to allow for a more scalable and
feasible wet lab implementation.
2. Material and methods 95
2.1. One-sided subtraction operator
To the authors’ knowledge, all current existing designs for biomolecular subtraction
operators that utilise standard CRN theory can only implement one-sided subtraction.
A comprehensive list of mathematical operators that can be implemented using CRN’s,
which includes the one-sided subtraction and its detailed analyses can be found in
Buisman et al. (2009). Following the design of Buisman et al. (2009), the subtraction
operator can be realised using the following abstract chemical reactions:
xi,1 γ
−
→xi,1+xo, xitd+xo γ
− →/0
xi,2 γ
−
→xi,2+xitd , xo γ
−
→/0 (2)
wherexi,1andxi,2are the two inputs,xois the resulting output,xitd is the intermediate
states andγis the reaction rate. Note that this one-sided subtraction operator is realised
using fourabstract chemical reactions. Using generalised mass-action kinetics (see
where the corresponding ODE’s for (2) are given by
dxo
dt =γ(xi,1−xoxitd−xo)
dxitd
dt =γ(xi,2−xoxitd) (3)
At steady state,xi,2=xoxitd, leading toxo=xi,1−xi,2. By analysing the Jacobian
matrix of the ODE’s relating to this subtraction operator, it has been shown in Buisman
et al. (2009) that when the subtraction of two components results in either zero or a
negative value, the fixed point does not exist or the system converges to an unstable
100
fixed point, respectively. Hence,xo=0 whenxi,1<xi,2andxo=xi,1−xi,2>0 when
xi,1≥xi,2, making the subtraction one-sided. Other example of one-sided subtraction
operators can be found in Cosentino et al. (2016) - in these cases the operators are used
to compute the difference of molecular fluxes, rather than concentrations.
2.2. Two-sided subtraction operator
105
As mentioned in Section 1, the only known framework to date that offers a partial
solution to the realisation of a two-sided subtraction operator can be found in Oishi
and Klavins (2011). In that proposed framework, a signal,uis represented as a
dif-ference between two chemical species i.e.u:=u+−u−. This representation results in
the chemical species having positive and negative components. To illustrate how such
representation can achieve a two-sided subtraction, we consider first how the
summa-tion operator can be realised using abstract chemical reacsumma-tions. The abstract chemical
reactions for the summation operator are given by
x+i,1−→γ x+i,1+x+o , x−i,1→−γ x−i,1+x−o , x+i,1+x−i,1−→η /0
x+i,2−→γ x+i,2+x+o , x−i,2→−γ x−i,2+x−o , x+i,2+x−i,2−→η /0
x+o −→γ /0 , x−o −→γ /0 , x+o+x−o −→η /0 (4)
whereηis a reaction rate such thatηγ. The corresponding ODEs are given by
dx+o
dt =γ(x
+ i,1+x
+ i,2−x
+
o)−ηx+ox
−
o
dx−o
dt =γ(x
−
i,1+x
−
i,2−x
−
o)−ηx + ox
−
o
dxo
dt =
dx+o
dt −
dx−o
where at steady state (i.e.dxo/dt=0),xo=xi,1+xi,2.
Now, for the subtraction operator, its abstract chemical reactions are given by
x+i,1−→γ x+i,1+x+o , x−i,1→−γ x−i,1+x−o , x+i,1+x−i,1−→η /0
x+i,2−→γ x+i,2+x−o , x−i,2→−γ x−i,2+x+o , x+i,2+x−i,2−→η /0
x+o −→γ /0 , x−o −→γ /0 , x+o+x−o −→η /0 (6)
Notice the difference of the superscripts+and− in the abstract chemical reaction
compared to (4). The corresponding ODEs are given by
dx+o
dt =γ(x
+ i,1+x
−
i,2−x
+ o)−ηx
+ ox
−
o
dx−o
dt =γ(x
−
i,1+x
+ i,2−x
−
o)−ηx+ox
−
o
dxo
dt =
dx+o
dt −
dx−o
dt =γ(xi,1−xi,2−xo) (7)
where at steady state,xo=xi,1−xi,2. Because the signal is represented as the
differ-ence of positive and negative components,xocan be properly computed regardless of
the relative magnitude ofxi,1andxi,2. Note that both the summation and subtraction
operators in (4) and (6) are realised usingnineabstract chemical reactions.
110
Now, note that the summation of two concentrations that is equivalent to (5) with
positive signals could also have been realised by employing the following three abstract
chemical reactions (Buisman et al., 2009):xi,1 γ
−
→xi,1+xo,xi,2 γ
−
→xi,2+xoandxo γ
− →/0.
This realisation does not require the signal to be represented using positive/negative
components. Surprisingly, however, an equivalent way of representing the
subtrac-115
tion operator as in (7) seems not to exist, as there are no associated abstract chemical
reactions to realise it. We shall further demonstrate this point below.
Consider the following two reactions:xi,1 γ
−
→xi,1+yandy γ
−
→/0. Their
correspond-ing ODEs are dy/dt= +γxi,1 and dy/dt=−γy respectively. Their final ODE
ex-pression can then be obtained by summing these two equations together, i.e. dy/dt=
120
γ(xi,1−y). Now, for the subtraction operator, the corresponding ODE is given by
dy/dt=γ(xi,1−xi,2−y). We have already shown howdy/dt=γ(xi,1−y)can be
dy/dt=−γxi,2. With the sign on the RHS of the ODE being negative, one would
ex-pect to writeyon the LHS of the abstract chemical reaction. In addition, we require
125
the multiplication ofxi,2withγ, which meansxi,2has to be on the LHS of the abstract
chemical reaction as well. A natural first attempt would then be to writexi,2+y γ
−
→ /0.
However, a sum of reactants in an abstract chemical reaction leads to multiplication in
the corresponding ODE, i.e. dy/dt=−γxi,2y. If we are to moveyto the RHS of the
abstract chemical reaction, i.e. xi,2 γ
−
→xi,2+y, its corresponding ODE would then be
130
dy/dt= +γxi,2. Thus, there is no way to realisedy/dt=−γxi,2using standard abstract
chemical reactions. This is the reason why the positive/negative components
formal-ism introduced by Oishi and Klavins (2011) is needed to realise a two-sided subtraction
operator.
While the formalism proposed in Oishi and Klavins (2011) is able to realise
two-135
sided subtraction, it also inevitably leads to a large increase in the number of abstract
chemical reactions required, since it must be used to realisealloperators and
compo-nents in the circuit, even though in many cases there are simpler alternatives available
(e.g. the summation operator). From the point of view of experimental
implementa-tion, it is highly desirable to keep the number of abstract chemical reactions required
140
as small as possible, thus motivating our attempt to formulate a design strategy that can
cope with the limitations of a one-sided subtraction operator and thus allow us to avoid
using positive/negative components.
2.3. Enzymatic reaction processes
In this paper, we focus on the problem of controlling enzymatic reaction processes.
145
Such processes are ubiquitous in cell biology, with some notable examples including
protein phosphorylation by kinases, metabolic synthesis pathways and anaerobic
fer-mentation of glucose to ethanol in yeast (see e.g. (Segel, 1975; Galazzo and Bailey,
1990; Heinrich et al., 2002; Faeder et al., 2003; Hatakeyama et al., 2003; Charusanti
et al., 2004; Gershon and Shaked, 2008)).
150
The main function of enzymes is to act as the catalysts of biochemical systems (see
e.g. (Taylor et al., 2008)). Disruption to the regulation of enzymatic reaction processes
accurately control the dynamics of enzymatic reaction processes at their optimal levels
is crucial to a wide range of natural and engineered biochemical systems.
155
The chemical reactions describing the enzymatic reaction process in its simplest
form (see e.g. (Segel, 1975; Gershon and Shaked, 2008)) are given by
xin+xe
kr1
−→xi
xi kr2
−→xout+xe
xout
kr3
−→ /0 (8)
wherekr1,kr2andkr3are the process binding, catalytic and degradation rates
respec-tively. xin,xe,xi andxout usually represent the substrate, enzyme, enzyme-substrate
and product respectively. In a typical enzymatic reaction, the enzyme combines with
its specific substrate to form the enzyme-substrate complex. After the reaction, this
enzyme-substrate complex breaks up resulting in the associated product and the
en-160
zyme itself. This enzyme is unchanged and once separated from the complex is free to
interact again with more substrate.
The corresponding ODE’s for (8) are then given by
dxi
dt =kr1xinxe−kr2xi
dxout
dt =kr2xi−kr3xout (9)
Here, we assume that the total concentration ofxeandxirepresented asxT =xe+xiis
constant.
3. Theory/calculation 165
3.1. Derivation of inverse-feedforward controller
The basic aim of the inverse-feedforward controller is to invert the relevant
dynam-ics of the process at steady state in order to provide accurate steady-state tracking of
reference signals. From (9), at steady-state, (i.e. setting bothdxi/dt anddxout/dt to
zero), we have
kr1xinxe=kr2xi
kr2xi=kr3xout. (10)
After some algebraic manipulation, we get
xin=
αxout (β−δxout)
(11)
whereα=kr2kr3,β=kr1kr2xT andδ=kr1kr3. For reference tracking, the steady state
value of the output,xoutshould reach the reference signal,r. By substitutingxout=r
and rewritingxin=uinto (11), we obtain the required control input signal such that the
process is able to track the reference signal at steady state, which is given by
u= αr
(β−δr) (12)
The control signal given in (12) essentially amounts to an open loop control
strat-175
egy, in which the relevant dynamics of the process are inverted in order to achieve
perfect steady-state tracking of reference signals. In practice, of course, the inversion
will not be exact, due to model uncertainty, and there is also no way to control the
transient dynamics of the closed loop system using this approach, which could lead to
the presence of steady state errors. To address these limitations, the feedforward
con-180
troller is used together with a classical Proportional-Integral (PI) feedback controller, as
shown in Figure 2. The main purpose of the feedback controller is to correct for errors
introduced by model mismatch and to control the transient behaviour of the process.
Thus, the final control signal acting on the process is given by the sum of the outputs
of the feedforward and feedback controllers. Note that Subtraction I and Subtraction II
185
shown in Figure 2 are both one-sided subtraction operators.
3.2. Abstract chemical reaction representation of the tracking controller
Here, we show how the tracking controller may be realised using abstract chemical
reactions. As shown in Figure 2, the feedforward controller requires two gain operators,
one division operator and one (one-sided) subtraction operator. Following the design
procedure for all those operators given in Buisman et al. (2009), the associated abstract
chemical reactions for the feedforward controller part are given as follows:
[Gain,α:]
r α γGα
−−−→r+x1
r γGα
−−→/0 (13)
whereγGα isα gain reaction rate.
[Gain,δ:]
r
δ γGδ
−−−→r+x2
r
γGδ
−−→/0 (14)
whereγGδ is theδ gain reaction rate.
[Subtraction I:]
β γSbI
−−→β+x3
x2
γSbI
−−→x2+xs
x3
γSbI
−−→/0
x3+xs
γSbI
−−→/0 (15)
whereγSbI is Subtraction I reaction rate andxs is the intermediate species involved in
195
Subtraction I.
[Division:]
x1
γD
−→x1+x4
x3+x4
γD
−→x3 (16)
whereγDis the division reaction rate.
For the PI feedback controller, the associated abstract chemical reactions are given
as follows:
[Integral gain:]
x7
KI
whereKIis the integral gain.
200
[Proportional gain:]
x7
γGK PKP
−−−−→x7+x9
x9
γGK P
−−−→/0 (18)
whereKPis the proportional gain andγGKP is the gain reaction rates.
[Summation I:]
x8
γSmI
−−→x8+x10
x9
γSmI
−−→x9+x10
x10
γSmI
−−→/0 (19)
whereγSmIis Summation I reaction rate.
The error resulting from model mismatch and transient effects is computed by
Sub-traction II, where the corresponding abstract chemical reactions are given by
[Subtraction II:]
r−−→γSbII r+x7
x6
γSbII
−−→x6+xt
x7
γSbII
−−→/0
xt+x7
γSbII
−−→/0 (20)
whereγSbII is Subtraction II reaction rate andxt is the intermediate species involved in
205
Subtraction II.
The overall control signal to be applied to the process is the summation of the
control signals from both the feedforward and feedback controllers, where the abstract
chemical reactions are given by
[Summation II:]
x4
γSmII
−−−→x4+x5
x10
γSmII
−−−→x10+x5
x5
γSmII
whereγSmII is Summation II reaction rate.
210
With the control signal, x5as the input to the process, the abstract chemical
re-actions for the process to be controlled are given by (8) withxin=x5 andxout=x6.
Thus, the number of chemical reactions needed to realise the complete control circuit
is 26. On the other hand, if the design framework that utilises two-sided subtraction as
proposed in Oishi and Klavins (2011) is to be used to design just a standard PI
feed-215
back controller, 36 chemical reactions would be required in the circuit, an increase in
complexity of 28%.
3.3. Ordinary differential equation representation of the tracking controller
Using generalised mass-action kinetics, the corresponding ODE’s for all the
ab-stract chemical reactions described in Section 3.2 are given by
220
[Feedforward Controller:]
dx1
dt =γGα(αr−x1)
dx2
dt =γGδ(δr−x2)
dx3
dt =γSbI(β−xsx3−x3)
dxs
dt =γSbI(x2−xsx3)
dx4
dt =γD(x1−x3x4) (22)
[Feedback Controller:]
dx8
dt =KIx7
dx9
dt =γGKP(KPx7−x9)
dx10
dt =γSmI(x8+x9−x10) (23)
[Subtraction II:]
dx7
dt =γSbII(r−xtx7−x7)
dxt
[Summation II:]
dx5
dt =γSmII(x4+x10−x5) (25)
[Process:]
dxi
dt =kr1x5xe−kr2xi
dx6
dt =kr2xi−kr3x6 (26)
withxT=xe+xiis constant.
4. Results and discussions
4.1. Limitation of feedback control with one-sided subtraction
In this section, we first illustrate the effect of using a one-sided subtraction operator
when a standard tracking feedback controller is used. Figure 3(A) shows the
configu-225
ration of a standard feedback system with a PI controller using a one-sided subtraction
operator and the PI controller is tuned using the standard Ziegler-Nichol or Internal
Model Control (IMC) methods (see e.g. (Ogata, 2010; Rivera et al., 1986)). From
Fig-ure 3(B), at time 0 to 40,000s, the feedback controller attempts to track the reference
value but as overshoot occurs, we have the situation that the reference value is smaller
230
than the output value resulting in no control action before the undershoot where the
situation is reversed. This leads to the oscillatory behaviour observed within that time
span. At time 40,000s to 80,000s, the reference value is stepped down and we have
the situation of the reference value being smaller than the output value. This means
the error given by the one-sided subtraction is always zero and the PI controller exerts
235
no control action, resulting in the large steady state error. The performance does not
improve despite repeated attempts to tune the PI controller gain - one of the best
tun-ings is shown in Figure 3(C), where the PI controller is still unable to achieve proper
reference tracking.
4.2. Inverse-feedforward controller with one-sided subtraction
240
In Figure 4, we show the results of repeating the above simulation with our
the simulation are summarised in Table 1. All units are assumed to be defined
appro-priately. The performance of the controller is good as it is able to track the reference
signal properly. The contribution of the two controllers is as expected, where most of
245
the control action is given by the feedforward controller while the PI controller is
oper-ative when dealing with transients. The parameters of the PI controller are obtained
us-ing standard tunus-ing methods e.g., Ziegler-Nichol/IMC method (see e.g. (Ogata, 2010;
Rivera et al., 1986)) followed by further fine tuning based on closed-loop simulations.
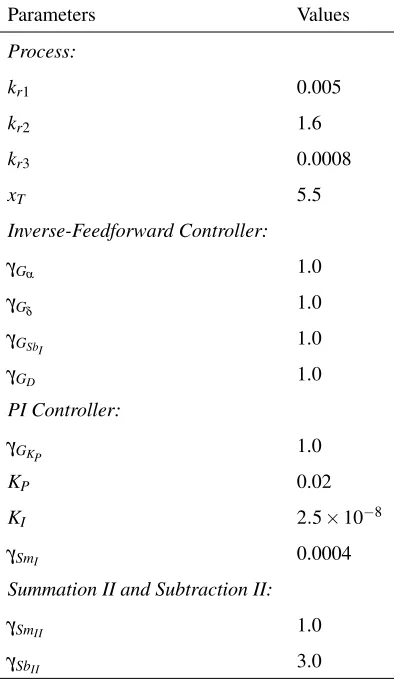
Parameters Values
Process:
kr1 0.005
kr2 1.6
kr3 0.0008
xT 5.5
Inverse-Feedforward Controller:
γGα 1.0
γGδ 1.0
γGSbI 1.0
γGD 1.0
PI Controller:
γGKP 1.0
KP 0.02
KI 2.5×10⁻⁸
γSmI 0.0004
Summation II and Subtraction II:
γSmII 1.0
[image:16.612.208.405.259.600.2]γSbII 3.0
4.3. Robustness and sensitivity analysis
250
Here, the robustness of the controller when implemented in closed-loop is
inves-tigated using Monte Carlo simulations, where all the parameters in (22) to (26) are
randomly drawn from a uniform distribution and the above simulations are repeated.
The number of Monte Carlo simulations required to obtain various levels of
estima-tion uncertainty with known probability are determined following Chernoff bound
255
(Vidyasagar, 1998). Following the guidelines given in Williams (2001), a total
num-ber of 1060 simulations are required to accomplish an accuracy level of 0.05 with
confidence level of 99% (Vidyasagar, 1998; Menon et al., 2009). All the parameters
are varied within ranges of 10% around their nominal values. Mathematically, this
is written asθ(1+0.1∆), whereθ∈ {γGα,i,γGδ,i,γSbI,j,γD,i,γGKP,i,γSmI,k,γSbII,j,γSmII,k,
260
KP,KI,kr1,kr2,kr3}, wherei∈ {1,2}, j∈ {1,2,3,4,5}andk∈ {1,2,3}.∆is a random
number from the uniform distribution in [-1,1]. Note that all the associated reaction
rates are split according to the number of chemical reactions in which they are
in-volved.
The simulation results are shown in Figure 5. The region shaded in grey is the
265
output envelope encompassing all responses from 1060 Monte Carlo simulations for
randomly perturbed parameters in the range of±10% from the nominal values. The
controller displays a good level of robust performance with no stability issues as a result
of varying parameters. The simulation was repeated with perturbations up to±100%
(i.e.θ(1+∆)with∆=1) and no instability was observed.
270
Despite the robustness analysis showing good performance with no stability issues,
one notable result warranting further investigation is the presence of steady state error.
It is known that any controller with integral action should eliminate steady state errors
even in the presence of model uncertainty and this is not observed in our simulation.
This is due to the effect of uncertainty on the biomolecular subtraction and
summa-tion operators. From (22) to (26), to achieve exact summasumma-tion and subtracsumma-tion, their
associated reaction rates (γSbandγSm) are required to be identical. This can be seen by
considering the following summation, i.e.,dy/dt=γ1x1+γ2x2−γ3y. The summation
is exact whenγ1=γ2=γ3, where at steady state,y=x1+x2. When the parameters
longer being identical (γ16=γ26=γ3). Then, at steady state,y= (γ1/γ3)x1+ (γ2/γ3)x2,
and the summation is no longer exact. Thus, these non-proper summation and
subtrac-tion operators are likely to result in the controller being unable to compute the correct
control signal in response to the error, leading to the observed steady state error. To
confirm this, we performed parameter sensitivity analysis, whereby each of the
pa-rameters shown in Table 1 are multiplied by a factor that ranges from 0.5 to 2.0 with
increments of 0.1. Sensitivity is quantified by computing the relative steady state error
at times 40,000s (step-up) and 80,000s (step-down) or mathematically,
Relativeess,U= ˆ
y(40000)−4 ˆ
y(40000)
Relativeess,D= ˆ
y(80000)−1 ˆ
y(80000) (27)
where ˆyis the output response subjected to parameter sensitivity. Table 2 shows the
maximum relative steady state errors resulting from tracking the step-up and step-down
of the reference signal.
The results of the sensitivity analysis confirm that the steady state error is largely
attributable to the Summation II and Subtraction II modules. These two operators are
275
responsible for computing the total control signal to the process and the error to the PI
controller respectively. The parameters associated with the feedforward controller are
also highly sensitive. This is expected given that the feedforward controller operates
by inverting the relevant dynamics of the process at steady state. Thus, any changes
to the parameters within the feedforward controller could result in the computation of
280
the incorrect control signal to negate the process dynamic, which subsequently leads
to large steady state error. Care is thus required when specifying and implementing the
reaction rates related to the controller and the summation and subtraction operators.
4.4. Simplified feedforward controller
The realisation of the inverse-feedforward controller involves a total of 26 abstract
chemical reactions. While this produces a reduction of circuit complexity by 28%
com-pared to using the framework proposed in Oishi and Klavins (2011), further reductions
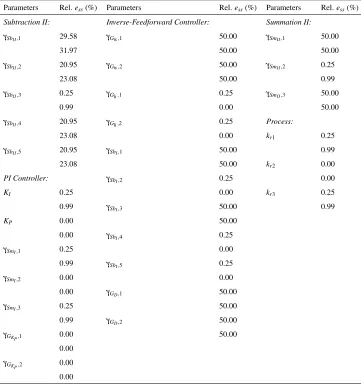
Parameters Rel.ess(%) Parameters Rel.ess(%) Parameters Rel.ess(%) Subtraction II: Inverse-Feedforward Controller: Summation II:
γSbII,1 29.58 γGα,1 50.00 γSmII,1 50.00
31.97 50.00 50.00
γSbII,2 20.95 γGα,2 50.00 γSmII,2 0.25
23.08 50.00 0.99
γSbII,3 0.25 γGδ,1 0.25 γSmII,3 50.00
0.99 0.00 50.00
γSbII,4 20.95 γGδ,2 0.25 Process:
23.08 0.00 kr1 0.25
γSbII,5 20.95 γSbI,1 50.00 0.99
23.08 50.00 kr2 0.00
PI Controller: γSbI,2 0.25 0.00
KI 0.25 0.00 kr3 0.25
0.99 γSbI,3 50.00 0.99
KP 0.00 50.00
0.00 γSbI,4 0.25
γSmI,1 0.25 0.00
0.99 γSbI,5 0.25
γSmI,2 0.00 0.00
0.00 γGD,1 50.00
γSmI,3 0.25 50.00
0.99 γGD,2 50.00
γGKP,1 0.00 50.00
0.00
γGKP,2 0.00
[image:19.612.137.498.125.510.2]0.00
Table 2: Parameter sensitivity analysis of the tracking controller. The maximum percentage relative steady state error has two rows for each parameter, where the upper and bottom rows denote Relativeess,Uand Relativeess,Drespectively.
achieved using an alternative way to realise this feedforward controller, as follows.
From (12), which we rewrite here,
u= αr
we note thatrappears in both the numerator and denominator. This fractional
represen-285
tation can often be approximated by a polynomial to obtain a simplified representation.
Taking the Taylor series expansion ofuatr∗=0, we have the following:
αr
(β−δr)≈ αr∗
(β−δr∗)+ α β
(β−δr∗)2(r−r
∗)
+ α β δ
(β−δr∗)3(r−r
∗
)2+higher order terms (28)
Neglecting the contribution of higher order terms and substitutingr∗=0 to (28), we
get
αr (β−δr)=
α
βr+ α δ
β2r
2 (29)
As a remark, forr∗6=0, we can always perform a change of variables to ensure that the
equilibrium is zero.
With this approximation, we have reduced the inverse-feedforward controller to
290
requiring two gain operators, one summation operator and one polynomial operator.
Substituting the relevant values ofα,β andδ, which are related to the process
pa-rameters (i.e. kr1,kr2andkr3), we obtain u≈0.029r+0.000002r2. Given that the
coefficient of the second term is very small, our final approximation of the
inverse-feedforward controller is then given byu≈0.029r. Hence, we have further reduced
295
the complexity of the inverse-feedforward controller to requiring only one gain
opera-tor. With that, the block diagram configuration of the resulting simplified feedforward
controller is shown in Figure 6.
Using the same variables as in the full feedforward controller case, the associated
abstract chemical reaction for the simplified feedforward controller is given by
300
[Simplified feedforward controller:]
r−−→γGΓ r+x4
x4
γG
−→/0 (30)
whereγGis the gain reaction rate andΓ=α/β. The associated ODE is given by
dx4
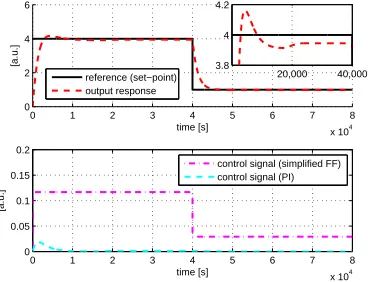
We repeat the reference tracking simulations as in the case of a full feedforward
controller and the results are shown in Figure 7. The results show that the performance
of the simplified feedforward controller is similar to the case of a full feedforward
controller. However, implementation of the simplified feedforward controller requires
only 18 chemical reactions, a reduction of 31% and 50% from the full feedforward
305
controller and framework proposed in Oishi and Klavins (2011) respectively.
We repeat the robustness analysis with the parametersφ∈ {γG,i,γGKP,i,γSmI,j,γSbII,k,
γSmII,j,KP,KI,kr1,kr2,kr3}, wherei∈ {1,2}, j∈ {1,2,3} andk∈ {1,2,3,4,5}. The
result is shown in Figure 8. Again, we observe similar performance compared to the
full feedforward controller. In fact the envelope of possible responses for the simplified
310
feedforward controller is smaller compared to the full feedforward controller, since the
number of uncertain parameters is reduced. The sensitivity analysis is also repeated
and the results are shown in Table 3.
As in the the case of the full feedforward controller, the most sensitive parameters
are associated with the summation and subtraction operators as well as the gain of the
315
simplified feedforward controller.
4.5. Design considerations and limitations for different biochemical processes
The dynamics of the enzymatic reaction process depend onkr1,kr2andkr3. From
the experimental biology literature, it is clear that these three parameters can vary over
several orders of magnitude - depending on the particular biochemical process in
ques-320
tion values ofkr1, kr2andkr3 in the literature range from 10−9 to 106, 10−2to 102
and 10−5to 10−3respectively (see e.g. (Faeder et al., 2003; Hatakeyama et al., 2003;
Charusanti et al., 2004)). Such large variations in the process parameters can clearly
significantly impact the design of the tracking controller and need to be taken into
ac-count in the design process. Here, we investigate the effect of each of these process
325
parameters on the performance of the tracking controller using both the full and
sim-plified feedforward controllers. We retain all the original parameters apart from the
process parameters, which we will vary in our analysis. For each process parameter,
we use the minimum and maximum values given above and consider their effect
inde-pendently and jointly. Table 4 summarises the findings and the simulation results are
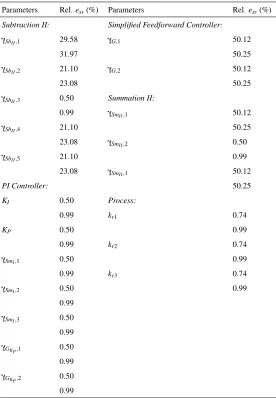
Parameters Rel.ess(%) Parameters Rel.ess(%)
Subtraction II: Simplified Feedforward Controller:
γSbII,1 29.58 γG,1 50.12
31.97 50.25
γSbII,2 21.10 γG,2 50.12
23.08 50.25
γSbII,3 0.50 Summation II:
0.99 γSmII,1 50.12
γSbII,4 21.10 50.25
23.08 γSmII,2 0.50
γSbII,5 21.10 0.99
23.08 γSmII,1 50.12
PI Controller: 50.25
KI 0.50 Process:
0.99 kr1 0.74
KP 0.50 0.99
0.99 kr2 0.74
γSmI,1 0.50 0.99
0.99 kr3 0.74
γSmI,2 0.50 0.99
0.99
γSmI,3 0.50
0.99
γGKP,1 0.50
0.99
γGKP,2 0.50
[image:22.612.169.445.123.521.2]0.99
Table 3: Parameter sensitivity analysis of the tracking controller using the simplified feedforward controller. The maximum percentage of relative steady state error has two rows, where the upper and bottom rows denote Relativeess,Uand Relativeess,Drespectively.
shown in Figures 9 and 10.
In Figures 9 and 10, the signs (+) and () represent respectively the maximum and
minimum values ofkr1tokr3of the process. For example, the notation (+,-,-) means
i.e. 1×10⁶, and kr2 andkr3 take the minimum value of their respective range, i.e.
335
1×10⁻² and 1×10⁻⁵. Likewise, the notation (+,+,-) represents the analysis of the
scenario wherekr1andkr2take their maximum value of their respective range andkr3
is at the minimum value of its range. In each of the subfigures ((A) to (H)), the top row
represents the reference tracking capability of the output and the bottom row represents
the control action given by both the feedforward and feedback control.
340
Reference tracking
capability (Y/N) kr1 kr2 kr3 Design remarks
Inverse-Feedforward Controller
N 1×10⁻⁹ 1×10⁻² 1×10⁻⁵
N 1×10⁻⁹ 1×10² 1×10⁻⁵
N 1×10⁶ 1×10⁻² 1×10⁻⁵
N 1×10⁶ 1×10² 1×10⁻⁵
Y 1×10⁻⁹ 1×10⁻² 1×10⁻³ Increase reaction rates
γ
Y 1×10⁻⁹ 1×10² 1×10⁻³ Increase reaction rates
γ
Y 1×10⁶ 1×10⁻² 1×10⁻³ DecreaseK
PandKI
Y 1×10⁶ 1×10² 1×10⁻³ DecreaseK
PandKI
Simplified Feedforward Controller
N 1×10⁻⁹ 1×10⁻² 1×10⁻⁵
N 1×10⁻⁹ 1×10² 1×10⁻⁵
N 1×10⁶ 1×10⁻² 1×10⁻⁵
N 1×10⁶ 1×10² 1×10⁻⁵
Y 1×10⁻⁹ 1×10⁻² 1×10⁻³ IncreaseK
PandKI
Y 1×10⁻⁹ 1×10² 1×10⁻³ No change to existing parameters
Y 1×10⁶ 1×10⁻² 1×10⁻³ DecreaseK
PandKI
Y 1×10⁶ 1×10² 1×10⁻³ DecreaseK
[image:23.612.165.446.239.470.2]PandKI
Table 4: Effect of process parameters on reference tracking capability and remarks on the control design guidelines. For the reference tracking capability, Y denotes Yes and N denotes No.
The obtained results show that the tracking controller using both full and simplified
feedforward controller has difficulty in tracking reference inputs properly if the
degra-dation term of the processkr3is very small (∼10−5). As shown in both Figures 9 and
10(A)-(D), the control action of PI (cyan line) stays at zero most of the time indicating
that the subtraction is not working properly due tor<y. Now, with a small value of
345
kr3,ywill degrade slowly, meaningr<yfor a longer time, hence the poor tracking
(red line). On the other hand, ifkr3is large (∼10−3), the time for whichr<yis short
and 10(E)-(H).
For very small values ofkr1, to achieve good reference tracking requires the
reac-350
tion rates in the inverse-feedforward controller to be increased. For implementation
using DNA-based chemistry, the ability to increase reaction rates could potentially be
constrained by the physical binding property of the DNA, thus this point has to be
taken into account when adjusting those reaction rates. For a large value ofkr1, good
reference tracking can be achieved by decreasing the PI controller gainsKPandKI.
355
On the other hand, when the simplified feedforward controller is used, a good
ref-erence tracking can be achieved by just adjusting the PI controller gain. Finally, in the
case when the value ofkr1is small and the values ofkr2andkr3are large, no adjustment
is required to the controller parameters. In Figures 9 and 10(E) and (F), we note that
despite the tracking controller being able to track the reference signal properly,
poten-360
tially large control signals are required, whose feasibility needs to be checked during
the design process with experimentalists.
4.6. Retroactivity
Here, we investigate how retroactivity affects the overall performance of the
track-ing controllers. In previous sections, we have assumed perfect modularity of the
dif-365
ferent elements in the closed-loop feedback control system shown in Figures 2 and 6.
In other words, the dynamic responses are not affected by the interconnection of the
components. While this assumption is widely made in the analysis of chemical reaction
based systems, recent work (see e.g. (Del Vechhio et al., 2008)) has shown that such
an assumption does not hold for many biomolecular feedback systems. As shown in
370
Del Vechhio et al. (2008), the occurrence of different modules sharing the same
molec-ular species is common, and this sharing of species can affect the overall dynamics
of the processes upon their interconnection. To quantify the way that interconnection
of two modules alters their dynamics with respect to their behaviour in isolation, the
concept of retroactivity has been introduced (Del Vecchio and Jayanthi, 2008; Jayanthi
375
et al., 2013). For the process considered here, it should be noted that no retroactivity
effects are present due to the interconnection of modules involving unimolecular
retroactivity does not affect the interconnection of the module Subtraction II with the
PI controller.
380
On the other hand, an interconnection of two modules, where one module
com-prises unimolecular reactions while the other module comcom-prises bimolecular reactions,
will feature a unidirectional retroactivity. Again, using an example in the context of
the closed-loop feedback control system shown in both Figures 2 and 6,
retroactiv-ity affects the interconnection of the module Summation II with the process (see (8)
385
and (21)). To take into account the effect of retroactivity, the ODE representation of
Summation II must consider the chemical reactions downstream of the process (see
(25)). Thus the ODE representation of the Summation II module including the effect
of retroactivity is given as follows:
dx5
dt =γSmII(x4+x10−x5)− k|r1{zx5x}e
retroactivity
(32)
We repeat the simulations in Section 4.2 using both the full and simplified
feed-390
forward controller taking into account the effects of retroactivity, and the results are
shown in Figures 11 and 12. The results show that retroactivity does not significantly
affect the performance of the overall closed-loop system other than to introduce a very
small steady state error. The reason for this steady state error can be explained as the
following. The retroactivity affects the input to the process,x5. At the same time,x5is
395
also the resulting control signal from both the feedforward and PI controllers. As both
the controllers do not have information regarding this error resulting from retroactivity,
these controllers are unable to provide the correct control signal to react to the effect of
retroactivity, thus leading to the observed steady state error. Nevertheless, our results
show that the performance of the tracking controller is not significantly affected by
400
retroactivity, allowing us to undertake designs based on the assumption of modularity
(as is the case with standard control applications).
4.7. Implementation of CRN via DNA strand displacement chemistry
Finally, we briefly provide an overview of the way in which the type of designs
pre-sented in this paper may be implemented experimentally. Recently, there have been a
number of studies that described how synthetic circuits composed of abstract chemical
reactions may be readily implemented using DNA-based chemistry (see e.g. (Seelig
et al., 2006; Soloveichik et al., 2010; Qian and Winfree, 2011; Chen et al., 2013)). In
Chen et al. (2013), the authors highlighted that chemical reactions can serve as a
pro-gramming language for the design of DNA-based chemistry synthetic circuits.
There-410
fore, circuit components synthesised using DNA that can be expressed mathematically
can be derived from biologically synthesised plasmids. Consequently, in principle this
enables the in vitro implementation of those circuits. The advantage of utilising
DNA-based chemistry in the design lies in the ease of implementation, as the design depends
on the choice of relevant sequences following the standard Watson-Crick pairing (i.e.
415
adenine-thymine and guanine-cytosine or A-T and G-C). As a result, design
frame-works and software tools that allow synthetic biomolecular circuitry described using
CRN’s to be readily implemented using DNA strand displacement (DSD) chemistry
have been developed in recent years (see e.g. (Seelig et al., 2006; Soloveichik et al.,
2010; Qian and Winfree, 2011; Chen et al., 2013)).
420
In particular, it has been shown in Soloveichik et al. (2010) that unimolecular (one
reactant at the LHS of the chemical reaction) and bimolecular (two reactants at the
LHS of the chemical reaction) chemical reactions can be compiled in DSD chemistry
to accomplish the intended behaviour of their designed biomolecular circuit. All
de-signs presented in this work are all made up of either unimolecular or bimolecular
425
chemical reaction, making this framework suitable for the designed controller to be
implemented experimentally. Here, we briefly describe their proposed framework and
refer interested readers to Soloveichik et al. (2010) for details.
Consider the following bimolecular DSD reaction,
X+Q−)−k−*b−
kub
Y+W (33)
wherekbis the binding reaction rate andkubis the unbinding reaction rate of the DNA
strand. The reaction commences when the invader strandQbinds in a standard
Watson-430
Crick complementary manner to the toe-hold domain of strandX. As the binding
oc-curs, portions of the strand ofX are displaced whereby this separation results in the
to the toe-hold domain of other DNA strands and complexes for subsequent reactions.
The rate of the overall reaction can be controlled by varying the binding and
unbind-435
ing rates,kbandkub. Quite often, different DNA strands do not interact directly with
one another, and hence auxiliary species with sufficiently large amount are required
to facilitate their interaction. With the inclusion of auxiliary species, the DSD
imple-mentation for the respective unimolecular (X→Y+Z) and bimolecular (X+Y →Z)
reactions are given by,
440
X+G−→q O
O+T −−→qmax Y+Z (34)
and
X+L−−)−−q*
qmax H+B
Y+H−−→qmax O
O+T −−→qmax Z (35)
whereG,O,T,L,HandBare the auxiliary species with appropriate initial
concentra-tionsCmax. The partial strand displacement rate is given byq=kb/Cmaxandqmaxis the
maximum strand displacement rate.
Since the abstract chemical reactions describing the tracking controller presented
445
here are made up exclusively of unimolecular and bimolecular reactions, the framework
introduced in Soloveichik et al. (2010) enables our design to be implemented via DNA
chemistry. Nevertheless, since the introduction of auxiliary species further increases
the number of reaction needed for DSD implementations, it is imperative that circuit
designs utilise as few reactions as possible. Hence, our results showing the feasibility
450
of a radically simplified inverse-feedforward tracking controller offer strong potential
5. Conclusions
In this paper, we have shown for the first time how a controller architecture for
im-plementing reference tracking, based on the use of an inverse-feedforward controller,
455
can be adapted to the specific context of embedded biomolecular feedback systems.
Our proposed approach circumvents a fundamental limitation of CRN-based systems
from the point of view of tracking control, i.e. the inability of standard CRNs to
im-plement a two-sided subtraction operator. The only currently available solution to this
problem proposed by Oishi and Klavins (2011) requires the adoption of a non-standard
460
modelling and design framework that represents signals as the difference in the
concen-tration of two chemical species, an approach that significantly increases the complexity
of the design process and doubles the total number of chemical reactions needed to
im-plement a given circuit.
The complexity of the control problem considered here is significantly higher than
465
in previous studies - almost all previous studies consider either a static or a very simple
first order process that avoids the possibility of the reference value being larger than the
output value (Cosentino et al., 2016) or employing control strategies that can reduce the
duration of the reference value being smaller than the output value (Briat et al., 2016)
or consider only a very simple static process with no dynamics (Yordanov et al., 2014).
470
Using the existing standard realisation of one-sided subtraction, our approach of
us-ing inverse feedforward combined with feedback control produces highly accurate and
robust reference tracking. By exploiting the biochemical structure of the feedforward
controller, we are able to reduce its complexity using a Taylor series approximation.
The resulting simplified feedforward control not only achieves similar performance
475
to the full feedforward controller, but also utilises far fewer chemical reactions. The
reduction in the number of chemical reactions is important, as it will significantly
facil-itate the experimental implementation of the proposed design in DNA-based chemistry
Acknowledgement 480
This work is supported EPSRC and BBSRC via research grants BB/M017982/1
and the School of Engineering of the University of Warwick.
Declaration
The authors declare that they have no competing interests.
References 485
Baldea, M., El-Farra, N.H., Ydstie, B.E., 2013. Dynamics and control of chemical
process networks: Integrating physics, communication and computation. Comput.
Chem. Eng. 51, 42–54. doi:10.1016/j.compchemeng.2012.05.016.
Bilotta, M., Cosentino, C., Bates, D.G., Salerno, L., Amato, F., 2015. Retroactivity
analysis of a chemical reaction network module for the subtraction of molecular
490
fluxes, in: Proceedings of IEEE Conference on Engineering in Medicine and Biology
Society, pp. 941–944. doi:10.1109/EMBC.2015.7318518.
Bilotta, M., Cosentino, C., Merola, A., Bates, D.G., Amato, F., 2016. Zero-retroactivity
subtraction module for embedded feedback control of chemical reaction networks,
in: Proceedings of IFAC Conference on Foundations of Systems Biology in
Engi-495
neering.
Briat, C., Zechner, C., Khammash, M., 2016. Design of a synthetic integral feedback
circuit: dynamic analysis and DNA implementation. ACS Synth. Biol. 5, 1108–
1116. doi:10.1021/acssynbio.6b00014.
Buisman, H.J., ten Eikelder, H.M.M., Hilbers, P.A.J., Liekens, A.M.L., 2009.
Com-500
puting algebraic functions with biochemical reaction networks. Artif. Life 15, 1–15.
doi:10.1162/artl.2009.15.1.15101.
Charusanti, P., Hu, X., Chen, L., Neuhauser, D., DiStefano III, J.J., 2004. A
and gleevec dynamics in chronic myeloid leukemia. Discrete Contin. Dyn. Syst. Ser.
505
B 4, 99–114. doi:10.3934/dcdsb.2004.4.99.
Chen, Y.J., Dalchau, N., Srinivas, N., Phillips, A., Cardelli, L., Soloveichik, D., Seelig,
G., 2013. Programmable chemical controllers make from DNA. Nat. Nanotechnol.
8, 755–762. doi:10.1038/nnano.2013.189.
Cosentino, C., Ambrosino, R., Ariola, M., Bilotta, M., Pironti, A., Amato, F., 2016.
510
On the realization of an embedded subtractor module for the control of chemical
reaction network. IEEE Trans. Autom. Control 61, 3638–3643. doi:10.1109/
TAC.2016.2523679.
Cosentino, C., Bilotta, M., Merola, A., Amato, F., 2013. A synthetic biology
ap-proach to the realization of embedded feedback controllers for chemical reaction
515
networks, in: Proceedings of IEEE Conference on Bioinformatics and
Bioengineer-ing. doi:10.1109/BIBE.2013.6701600.
Del Vecchio, D., Jayanthi, S., 2008. Retroactivity attenuation in transcriptional
net-works: design and analysis of an insulation device, in: Proceedings of IEEE
Conference on Decision and Control, pp. 774–780. doi:10.1109/CDC.2008.
520
4739037.
Del Vechhio, D., Ninfa, A., Sontag, E., 2008. Modular cell biology: retroactivity and
insulation. Mol. Syst. Biol. 4. doi:10.1038/msb4100204.
Devasia, S., 2002. Should model-based inverse inputs be used as feedforward under
plant uncertainty? IEEE Trans. Autom. Control 47, 1865–1871. doi:10.1109/
525
TAC.2002.804478.
Faeder, J.R., Hlavacek, W.S., Reischl, I., Blinov, M.L., Metzger, H., Redondo, A.,
Wofsy, C., Goldstein, B., 2003. Investigation of early events in fcεri-mediated
signaling using a detailed mathematical model. J. Immunol. 170, 3769–3781.
doi:10.4049/jimmunol.170.7.3769.
Feinberg, M., 1986. Chemical reaction network structure and the stability of complex
isothermal reactors - I. the deficiency zero and deficiency one theorems. Chem. Eng.
Sci. 42, 2229–2268. doi:10.1016/0009-2509(87)80099-4.
Feinberg, M., 1988. Chemical reaction network structure and the stability of complex
isothermal reactors - II. multiple steady states for network deficiency one. Chem.
535
Eng. Sci. 43, 1–25. doi:10.1016/0009-2509(88)87122-7.
Franklin, G.F., Powell, J.D., Emami-Naeini, A., 2014. Feedback Control of Dynamic
Systems. 7th ed., Pearson.
Galazzo, J.L., Bailey, J.E., 1990. Fermentation pathway kinetics and metabolic flux
control in suspended and immobilizeds. cerevisiae. Enzyme Microb. Technol. 12,
540
162–172. doi:10.1016/0141-0229(90)90033-M.
Gershon, E., Shaked, U., 2008. H∞ feedback-control theory in biochemical systems.
Int. J. Robust Nonlinear Control 18, 14–50. doi:10.1002/rnc.1195.
Harris, A.W.K., Dolan, J., Kelly, C., Anderson, J., Papachristodoulou, A., 2015.
De-signing genetic feedback controllers. IEEE Trans. Biomed. Circuits Syst. 9, 475–
545
484. doi:10.1109/TBCAS.2015.2458435.
Hatakeyama, M., Kimura, S., Naka, T., Kawasaki, T., Yumoto, N., Ichikawa, M., Kim,
J.H., Saito, K., Saeki, M., Shirouzu, M., Yokoyama, S., Konagaya, A., 2003. A
com-putational model on the modulation of mitogen-activated protein kinase (MAPK)
and Akt pathways in heregulin-induced ErbB signalling. Biochem. J. 373, 451–463.
550
doi:10.1042/bj20021824.
Heinrich, R., Neel, B.G., Rapoport, T.A., 2002. Mathematical models of protein kinase
signal transduction. Mol. Cell 9, 957–970. doi:10.1016/S1097-2765(02)
00528-2.
Henson, M.A., 2003. Dynamic modeling and control of yeast cell populations in
con-555
tinuous biochemical reactors. Comput. Chem. Eng. 27, 1185–1199. doi:10.1016/
Hsiao, V., de los Santos, E.L.C., Whitaker, W.R., Dueber, J.E., Murray, R.M., 2015.
Design and implementation of a biomolecular concentration tracker. ACS Synth.
Biol. 4, 150–161. doi:10.1021/sb500024b.
560
Jayanthi, S., Nilgiriwala, K.S., Del Vecchio, D., 2013. Retroactivity controls the
tem-poral dynamics of gene transcription. ACS Synth. Biol. 2, 431–441. doi:10.1021/
sb300098w.
Lin, H.Y., Chen, J.Z., Li, H.Y., Yang, C.N., 2015. A simple three-input DNA-based
system works as a full-subtractor. Sci. Rep. 5. doi:10.1038/srep10686.
565
Menon, P.P., Postlethwaite, I., Bennani, S., Marcos, A., Bates, D.G., 2009. Robustness
analysis of a reusable launch vehicle flight control law. Control Eng. Pract. 7, 751–
765. doi:10.1016/j.conengprac.2008.12.002.
Ogata, K., 2010. Modern Control Engineering. 5th ed., Prentice-Hall.
Oishi, K., Klavins, E., 2011. Biomolecular implementation of linear I/O systems. IET
570
Syst. Biol. 5, 252–260. doi:10.1049/iet-syb.2010.0056.
Qian, L., Winfree, E., 2011. A simple DNA gate motif for synthesizing large-scale
circuits. J. R. Soc. Interface rsif20100729. doi:10.1098/rsif.2010.0729.
Rivera, D., Morari, M., Skogestad, S., 1986. Internal model control: PID
con-troller design. Ind. Eng. Chem. Process Des. Dev. 25, 252–265. doi:10.1021/
575
i200032a041.
Salehi, S.A., Parhi, K.K., Riedel, M.D., In press. Chemical reaction networks for
com-puting polynomials. ACS Synth. Biol. doi:10.1021/acssynbio.5b00163.
Seelig, G., Soloveichik, D., Zhang, D.Y., Winfree, E., 2006. Enzyme-free nucleic acid
logic circuits. Science 314, 1585–1588. doi:10.1126/science.1132493.
580
Segel, I.R., 1975. Enzyme Kinetics - Behaviour and Analysis of Rapid Equilibrium
Soloveichik, D., Seelig, G., Winfree, E., 2010. DNA as a universal substrate for
chem-ical kinetics. Proc. Natl. Acad. Sci. U.S.A. 107, 5393–5398. doi:10.1073/pnas.
0909380107.
585
Song, T., Garg, S., Mokhtar, R., Bui, H., Reif, J., 2016. Analog computation by
DNA strand displacement circuits. ACS Synth. Biol. 5, 898–912. doi:10.1021/
acssynbio.6b00144.
Taylor, D.J., Green, N.P.O., Stout, G.W., Soper, R., 2008. Biological Science. 3rd ed.,
Cambridge University Press.
590
Vidyasagar, M., 1998. Statistical learning theory and randomised algorithm for control.
IEEE Control Syst. 18, 69–85. doi:10.1109/37.736014.
Williams, P.S., 2001. A Monte Carlo dispersion analysis of the x-33 simulation
soft-ware, in: Proceedings of AIAA Conference on Guidance, Navigation and Control,
pp. 69–85. doi:10.2514/6.2001-4067.
595
Xu, S., Li, H., Miao, Y., Liu, Y., Wang, E., 2013. Implementation of half adder and
half subtractor with a simple and universal DNA-based platform. NPG Asia Mater.
5, e76. doi:10.1038/am.2013.66.
Yordanov, B., Kim, J., Petersen, R.L., Shudy, A., Kulkarni, V.V., Phillips, A., 2014.
Computational design of nucleic acid feedback control circuits. ACS Synth. Biol. 3,
600
600–616. doi:10.1021/sb400169s.
One-sided subtraction
e ≥ 0, when r ≥ y e = 0, when r < y
Two-sided subtraction
e ≥ 0, when r ≥ y e < 0, when r < y Subtraction
r
y
[image:34.612.200.407.297.423.2]e
Figure 1: Subtraction operator.
α δ β Inverse-Feedforward Controller Process KI KP ∫ PI Controller
r x1
x2
x3
x4 x5 x6
x6
r x7
x8 x9
x10
Subtraction I
Division Summation II
[image:34.612.151.459.488.599.2]Subtraction II Summation I
Figure 2: Block diagram configuration of the proposed tracking controller.
KI
KP Process
PI Controller
r
y
e m
n u y
ʃ
(A)
One-sided Subtraction
Summation
0 1 2 3 4 5 6 7 8
x 104
0 2 4 6 8 time [s] [a .u .]
0 1 2 3 4 5 6 7 8
x 104
0 2 4 6 8 10 time [s] [a .u .] output response calculated error reference (set−point) (B) (C)
0 1 2 3 4 5 6 7 8 x 10⁴
0 2 4 6
time [s]
[a.u.]
0 1 2 3 4 5 6 7 8
x 104 0
0.05 0.1 0.15 0.2
time [s]
[a.u.]
control signal (FF) control signal (PI) reference (set−point) output response
[image:35.612.208.391.171.318.2](B) (A)
Figure 4: System responses with the tracking controller. (A): Output and reference signals. (B) Control signals from inverse-feedforward (FF) and PI controllers.
0 1 2 3 4 5 6 7 8
x 104 0
1 2 3 4 5 6
time [s]
[a.u.]
output with uncertainties reference (set−point) output response
[image:35.612.217.393.458.605.2]Process
K I
K P
∫
PI Controller
r x
4 x5 x6
x 6 r
x 7 x
8 x9
x 10
Summation II
Subtraction II Summation I Simplified Feedforward Controller
[image:36.612.203.407.168.311.2]β α
Figure 6: Block diagram configuration with simplified feedforward controller.
0 1 2 3 4 5 6 7 8
x 104 0
2 4 6
time [s]
[a.u.]
0 1 2 3 4 5 6 7 8
x 104 0
0.05 0.1 0.15 0.2
time [s]
[a.u.]
control signal (simplfied FF) control signal (PI)
[image:36.612.213.390.443.587.2]reference (set−point) output response
0 1 2 3 4 5 6 7 8
x 104 0 0.5 1 1.5 2 2.5 3 3.5 4 4.5 5 time [s] [a.u.]
[image:37.612.216.391.143.287.2]output with uncertainties reference (set−point) output response
Figure 8: Robustness analysis of the tracking controller using the simplified feedforward controller.
0 1 2
x 105 0
2 4
[a.u]
(−, −, −)
0 1 2
x 105
0 5 10
[a.u]
0 1 2
x 105 0
2 4
(−, +, −)
0 1 2
x 105
0 5 10
0 1 2
x 105 0
5 10
(+, −, −)
0 1 2
x 105
0 2 4x 10
−10
0 1 2
x 105 0
5 10
(+, +, −)
0 1 2
x 105
0 2 4x 10
−10
0 1 2
x 105 0
2 4
[a.u]
(−, −, +)
0 1 2
x 105 0
5
10x 10
5
time [s]
[a.u]
0 1 2
x 105 0
2 4
(−, +. +)
0 1 2
x 105 0
5
10x 10
5
time [s]
0 1 2
x 105 0
2 4 6
(+, −, +)
0 1 2
x 105 0
0.5 1x 10
−9
time [s]
0 1 2
x 105 0
2 4 6
(+, +, +)
0 1 2
x 105 0
0.5 1x 10
−9
time [s]
x 103 x 103
(A) (B) (C) (D)
(H) (G)
(F) (E)
Figure 9: Effect of varying process parameters on reference tracking using inverse-feedforward controller. The notation ‘+’ and ‘-’ denotes respectively the maximum and minimum values of the process parameter. Red line: output response. Black line: reference (set-point). Magenta line: control signal from
[image:37.612.189.420.351.583.2]