Contents lists available atScienceDirect
Journal of Energy Storage
journal homepage:www.elsevier.com/locate/est
On the utilisation of the pseudo-capacitive capabilities of Li-ion cells for the
provision of frequency response services
Martin Rogall
a,⁎, Tazdin Amietszajew
a, Rohit Bhagat
a, Maria Brucoli
b, David Greenwood
a aWMG, The University of Warwick, Coventry, CV4 7AL, UKbEDF Energy, Interchange, 81- 85 Station Rd, Croydon, CR0 2AJ, UK
A R T I C L E I N F O
Keywords:
Li-Ion EIS Capacitance Frequency response
A B S T R A C T
This work investigates the capacitive capabilities of Li-ion pouch and cylindrical cells in respect to the provision of Frequency Response services and a potential for reduction in battery ageing effects. This is achieved using Electrochemical Impedance Spectroscopy (EIS) and a novel method of identifying and defining the threshold frequency between pseudo-capacitive and diffusion processes of the cell. It is found that this threshold frequency is independent of current intensity up to 1 C, showing that even at high power, pseudo-capacitance has sig-nificant impact. However, a severe dependency upon relative cell surface area and State of Charge (SoC) is identified. Symmetrical charge-discharge pulses of up to 10 s utilise primarily cell capacitance. Literature in-dicates, that this level of utilisation reduces the electrochemical ageing impact significantly. This article displays a method to identify and isolate these processes for any given cell and to allow enhancement of conventional ageing modelling.
1. Introduction
Mandatory and Firm Frequency Response (MFR and FFR) are ser-vices demanded and requested by National Grid, which balance de-mand and generation on a permanent basis in the Great British power grid [1]. In 2016, National Grid introduced additionally the Enhanced Frequency Response (EFR) service, which aims to replace the inertia effects from conventional energy sources by use of even shorter re-sponse time [2]. All of these services are provided through counter-balancing over-demand and -generation with rapid output power changes –a service for which batteries on large scale, especially for EFR, have emerged as the most suitable technology [3,4].
Several papers [5–10] discuss the potential of batteries and speci-fically Li-Ion batteries to provide inertia to the grid in the form of fre-quency response. Several authors [8,6–10] compared retrospectively the ageing to the medium SoC and cycle depth of the utilisation. In one instance [10], the ageing impact of frequency response on the battery has primarily been ascribed to calendric degradation. All these in-vestigations account for the degradation cumulatively for a prolonged time period, however they do not consider important differences be-tween frequency response provision and standard cycling in short time scales. These phenomena, such as fast pulsing and high currents, can have significant impact on the ageing of Li-Ion cells, which asks for deeper analysis as proposed in this work.
The authors of [9,11–13] describe based on EIS results that battery cells, specifically Li-ion cells, exhibit capacitive properties when ex-posed to a high frequency alternating current. These properties are due to polarisation and pseudo-capacitive processes within the cell, which behave like purely electrical non-ideal capacitors and thus don’t re-present an electrochemical charge/discharge process. At lower fre-quencies, the chemical diffusion processes are activated, and the bat-tery functions more conventionally.
Cycling batteries has been proven to have higher impact on the ageing of Li-ion cells than pure storage periods [14–16]. Under the hypothesis that some actions during the provision of frequency re-sponse only utilise the capacitive effects within the cell due to high frequency AC operation, it is reasonable to assume that these actions have much lower impact on the electrochemical ageing of the cell than other applications with equivalent throughput.
During Micro-Cycling [17–19] batteries are subjected to small charge and discharge processes, resulting in a low cycle depth. The authors of [17] applied over 200,000 micro-cycles (equal to 3000 full equivalent cycles) to Nickel-Manganese-Cobalt/Carbon (NMC/C) bat-tery cells. Over this time period, the authors did not detect any capacity fade or resistance increase. The authors do not link this effect to the capacitive properties of the cell. Therefore, a thorough investigation into Li-Ion pseudo-capacitance would highly benefit ageing analysis.
There are several methods to determine the threshold between
https://doi.org/10.1016/j.est.2019.02.028
Received 23 November 2018; Received in revised form 23 February 2019; Accepted 25 February 2019 ⁎Corresponding author.
E-mail address:[email protected](M. Rogall).
2352-152X/ © 2019 Published by Elsevier Ltd.
capacitance and diffusion within the cell. For instance, utilising the Archimedes principle and submerging the cell into a liquid would en-able measuring the electrode expansion and consequently the diffusion during cycling. This setup would, however, require highly sensitive measurement of the surface level and be biased by inhomogeneous thermal expansion of the liquid itself.
Another method is the use of a reference electrode to measure di-rectly the potential of the electrodes during operation. However, since capacitive effects are present in both electrodes, this setup would not separate the processes correctly [20,21].
EIS provides a reliable and consistent way to analyse the electrical properties of battery cells [12,22–25]. Identifying the threshold be-tween capacitive and chemical utilisation of the battery through EIS shows two major difficulties. Firstly, high-power utilisation of batteries generally shows non-linearities connected to the Butler-Volmer equa-tion [12,24]. These non-linearities cause harmonics which are primarily prevalent at high currents and low frequencies, and can be identified through methods such as Nonlinear EIS or Nonlinear Frequency Re-sponse Analysis [26–28].
Secondly, distinguishing between the individual components of the Equivalent Circuit Model (ECM) commonly requires fitting it to the data, which further requires additional software tools. These may, especially under influence of non-linearities, not be capable of gen-erating a sufficiently accurate result. Although this process can be supported through analysis of the distribution of relaxation times, this requires complex evaluation (manually or through further software) and only provides limited benefits to comparing the impact of the processes during utilisation [25,29–32].
This paper investigates the capacitive capabilities of NMC-LMO (Lithium-Manganese-Oxide), LFP (Lithium-Iron-Phosphate) and NMC cells. It aims to define a simpler and accurate method of identifying the threshold between capacitive and diffusion processes within a cell, to determine general characteristics and dependencies of this threshold and to connect these to the conditions of frequency response and the results found in [17].
2. Experimental design
The experimental design matrix is given in
Table 1. Four different cell types of different size, shape and chemistry from different manufacturers have been investigated in this experiment. Before, the test cell type A has been subjected to ap-proximately 100 full equivalent cycles (CPCV between 2.8 V and 4.15 V) through emulation of support of a household-photovoltaic system. In this time period, the cell has not displayed significant ageing effects (< 2% capacity loss). Cell type B originates from a module disassembly and has been full cycled 7 times (CCCV at C/2 between 2.8 V and 4.15 V) prior to the test. Cell types C and D were provided as new cells.
The state of charge of type A and B has been adjusted before the EIS tests through C/2 charge current from 0% SoC using Coulomb counting.
C and D were provided at 50% SoC.
The maximum currents have been chosen based on equipment limitations and the expected current during EFR. The maximum relative current that battery storage is allowed to provide is 2C [2], and typical frequency behaviour indicates that events with a required power output beyond 50% of the maximum output is extremely rare [33].
Galvanostatic EIS has been performed separately and consecutively (starting with the lowest current to reduce the impact on the SoC) for each of the RMS currents. The starting OCV for each state of charge varied by < 15 mV. The frequency band covered 5 kHz to 20 mHz. A Solartron ModuLab XM ECS potentiostat coupled with a 20 A booster has been used to perform the EIS [34].
3. Nyquist-plot analysis
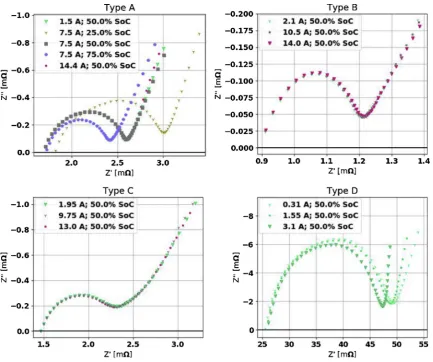
Initially, EIS has been performed at varying currents to investigate the impact of the Butler-Volmer nonlinearity on the cells. The results are displayed inFig. 1. High frequency positive reactances have been neglected in this display, as they are heavily influenced by cable in-ductivity. Furthermore, a few low frequency results of type B have been cut as they indicated behaviour of a closed Warburg element.
Fig. 1shows, that increasing the current had no significant impact on the impedance of type A, B and C cells, indicating that the im-pedance non-linearity caused by high currents is minimal. However, cell type D was affected by increasing currents. Mainly the resistive part of the pseudo-capacitance and diffusion have been reduced by the in-creasing currents, confirming impacts by the Butler-Volmer kinetic.
The main differences between cell D and the others are size and architecture. Since the currents are adapted towards the cell capacity, it is more likely that the difference occurs due to the cylindrical shape, which constrains the cell contents and influences the cell properties.
Fig. 1further displays the Nyquist plot of type A at changing SoC. At higher SoC resistance of conductor and pseudo-capacitance decreases, indicated by both the shift of the curves towards 0 and the contraction of the semi-circle. These changes appear to be exponential and match the behaviour described in [24]. However, the angle of the diffusion part of the curve is not significantly affected.
Based on the work of [9,11,13,23], the equivalent circuit model displayed inFig. 2a was found to best represent the Nyquist plots in Fig. 1.R0represents the purely ohmic resistance, the SEI and CT sub-scripted elements display the pseudo-capacitive properties of the solid electrolyte interface and the charge transfer andCPEDIF describes the diffusion processes through a constant phase element
4. Filtration of pseudo-capacitance and diffusion
The basis for the differentiation between the processes is the equivalent circuit model given inFig. 2a. Since the individual elements are irrelevant for the distinction between pseudo-capacitance and dif-fusion, the ECM can be expressed as given inFig. 2b, where Z0 re-presents the conductor resistance, ZPC the combined pseudo-capaci-tance andZDIFthe diffusion. The conditions are as follows:
=
Z0 R0 (1)
= + + + Z R B jω R B jω
1 *( ) 1 *( )
PC SEI
SEI ψ
CT
CT ψ
SEI CT (2)
= Z B jω 1 *( ) DIF
DIF ψDIF (3)
= + +
Z Z0 ZPC ZDIF (4)
Rrepresents the ohmic characteristic of each element,Bandψare thefitting parameters of the constant phase elements andωdescribes the angular frequency.
Only two of these elements must be determined to fully capture the individual impedances. Z0 can be determined through linear Table 1
Experimental Design Matrix.
ID A B C D
COUNT 3 4 1 1
CHEMISTRY NMC-LMO/C NMC-LMO/ C
LFP/C NMC/C
NEW No Yes Yes Yes
FORM Pouch Pouch Pouch Cylindrical CAPACITY 15 Ah 33 Ah 19.5 Ah 3.1 Ah SOC 25 %, 50 %, 75
%
50 % 50 % 50 %
RMS-CURRENT C/20, C/10, C/5, C/2, 1C
C/16, C/3, 2/5C
C/10, C/2, 2/3C
C/10, C/2, 1C
TEMPERATURE 22 °C 22 °C 22 °C 22 °C
interpolation where the Z’’is equal to zero. At low frequencies, the diffusion impedance is the only active element. Fitting|ZCPE|orZ′CPEto the data requires knowledge of the resistive parameters of ZPC. However,Z′′CPE can be directly fitted towards the low frequency re-actance Z’’dataset from the EIS. An examplefitting curve is displayed in Fig. 3.
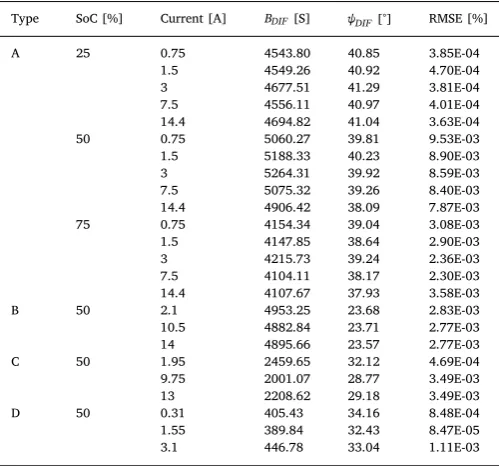
Thefitting data has been selected so that the covariance ofBDIFand ψDIF are minimal. The resulting fitting function describes almost
perfectly the measurements for the types A, C and D. The reactance of type B was not perfectlyfitted, where in some instances thefitted values were greater than the measured values.BDIFandψDIFand the RMSE for eachfit have been determined for every measurement and are displayed in
Table 2. For type A and B the values have been averaged over all samples.
[image:3.595.82.516.53.415.2] [image:3.595.143.457.536.732.2]With this method, Z0 and ZCPE have been determined for every Fig. 1.Nyquist-Plots of the different cell types at different currents.
measured frequency and can be subtracted from each Z value. The re-sulting Nyquist plot of the pseudo-capacitance for different cases is given inFig. 4. The resulting graph describes well the depressed semi-circle of the pseudo-capacitive ZARC elements. Towards lower fre-quencies, inaccuracies become apparent. These are likely due to mea-surement errors, characteristics that cannot be captured by simplified ECM and imperfectfitting.
Since these inaccuracies might negatively impact the following analysis and do not represent realistic behaviour, they need to be cor-rected. This is achieved by stating thatZ′PCdoes not decrease at lower frequencies and Z′′PCdoes not exceed zero. Through this, a more ac-curate approximation forZPC can be determined.
5. Bode graph analysis
To identify the absolute utilisation of the individual components, Z
| |0,|ZPC|and|ZDIF|have been plotted in the Bode Plot. It displays for each frequency, how the overpotential of the cell is split across the elements, and thus at which rate elements are utilised. A sample is displayed inFig. 5. Added up, all components result in the impedance over the cell.
At very high frequencies (> 1000 Hz), the cell acts as a pure resistor
with an ideal power source, meaning that every utilisation only gen-erates ohmic losses and the cell is neither charged nor discharged. At medium frequencies (< 1000 Hz, > 1 Hz), the double-layer capaci-tance of the cell acts as an additional power source/surge during charge and discharge processes. At low frequencies (< 1 Hz), the diffusion process is gradually activated, providing the electrochemical energy storage. However, in the initial stages of charge and discharge process, the cell is still utilising its capacitance.
Mathematically, neither capacitance nor diffusion are zero at any frequency. However, the mentioned thresholds can be assumed true for most real applications. Another threshold is defined here and is marked as a black vertical line in the graph. This transitional frequency, from here on called Capacitance-Diffusion Transitional Frequency (CDTF), marks the point where the impedance of the diffusion element is equal to the impedance of the capacitive element. Thus, capacitance and diffusion are equally utilised at CDTF. Above CDTF, the capacitance is the dominant element. Below CDTF, diffusion is dominant.
CDTF is not a hard border but provides an indication whether to consider capacitive effects or charge/discharge actions during utilisa-tion analysis.
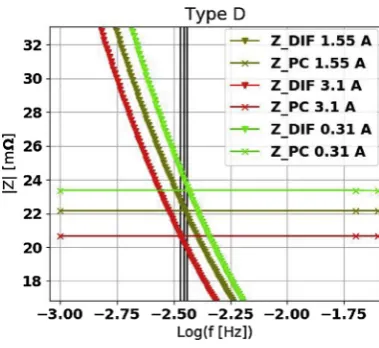
Within the same SoC range, the Bode plots for type A, B and C, respectively, are almost identical. However, as displayed inFig. 6, the impedances of type D change expectedly. Even though| |Z0 stays con-stant, both|ZPC|and|ZDIF|become smaller at higher currents. Since they both fall at approximately the same rate, the CDTF only varies slightly
6. CDTF analysis
The CDTF has been determined for all cells in all states. The results along with the errors across samples are displayed inFig. 7. The CDTF across thefirst 3 types varies but appears to be almost always in the logarithmic area between 10 and 100 mHz. Type D is an exception with an average CDTF of about 3.5 mHz, which can be connected to the cylindrical design of the cell and the resulting maximised surface area and capacitance as found in capacitors. This prolongs the window during charge and discharge in which the capacitance is the primary effect.
The CDTF appears to be widely current-independent. Although there is a slight downwards trend in the CDTF towards higher currents in type B and D, these changes are minimal and within expected error range. As described in section5, both|ZPC|and|ZDIF|of type D became smaller at higher currents, keeping the CDTF at approximately 3.5 mHz. Overall, current intensity does not seem to have any impact on the rate of utilisation of pseudo-capacitance and diffusion
However, the state of charge seems to have a significant impact. At higher SoC the CDTF rises as well, resulting in higher diffusion utili-sation. At low SoC, the CDTF is minimal and thus the capacitive effects are maximised. In type A, the CDTF is twice as high at 75% than at 25%. The overall dependency appears to be exponential.
For almost all cases, the CDTF is located beyond the tested fre-quency spectrum (< 20 mHz). Since the terminal behaviour of the pseudo-capacitance and the diffusion has been identified, this does not impact the confidence in the results. However, this proves that the transition between the elements is far beyond the “valley” in the Nyquist plot.
7. Translation of frequency response utilisation into AC utilisation of battery
[image:4.595.64.261.56.216.2]To analyse the relationship between the in [17] presented results, frequency response provision and CDTF, it is necessary to compare and translate the charge/discharge signals. AC utilisation requires a bidir-ectional (positive and negative power output) provision of frequency response. However, FFR and MFR describe a collection of unidirectional services [1,35]. Therefore, a bidirectional combination of these services is assumed. EFR is already defined as bidirectional service [36].Fig. 8: Fig. 3.EIS-measured reactance andfittedZ''DIFfunction (Type A).
Table 2
Diffusion element parameters and RMSE.
Type SoC [%] Current [A] BDIF[S] ψDIF[°] RMSE [%]
A 25 0.75 4543.80 40.85 3.85E-04 1.5 4549.26 40.92 4.70E-04 3 4677.51 41.29 3.81E-04 7.5 4556.11 40.97 4.01E-04 14.4 4694.82 41.04 3.63E-04 50 0.75 5060.27 39.81 9.53E-03 1.5 5188.33 40.23 8.90E-03 3 5264.31 39.92 8.59E-03 7.5 5075.32 39.26 8.40E-03 14.4 4906.42 38.09 7.87E-03 75 0.75 4154.34 39.04 3.08E-03 1.5 4147.85 38.64 2.90E-03 3 4215.73 39.24 2.36E-03 7.5 4104.11 38.17 2.30E-03 14.4 4107.67 37.93 3.58E-03 B 50 2.1 4953.25 23.68 2.83E-03 10.5 4882.84 23.71 2.77E-03 14 4895.66 23.57 2.77E-03 C 50 1.95 2459.65 32.12 4.69E-04 9.75 2001.07 28.77 3.49E-03 13 2208.62 29.18 3.49E-03 D 50 0.31 405.43 34.16 8.48E-04 1.55 389.84 32.43 8.47E-05 3.1 446.78 33.04 1.11E-03
[image:4.595.38.288.268.501.2]Rectangular (left) and sawtooth (right) charge-discharge current pro-files [17]Fig. 8displays the rectangular pulse as it is assumed to be present for frequency response provision and a sawtooth pulse as it has been applied in [17].
Using the principles of Fourier transformation, these signals can be recreated by an endless combination of sinusoidal signals, with the lowest frequency being the inverse of the overall pulse time (a + b+c). Therefore, from the results in Section 6the maximum pulse time for capacitive dominance can be determined by calculating the reciprocal of the CDTF. The maximum pulse time varies therefore between 10 s (cell type B) and 4.7 min (cell type D).
[image:5.595.77.521.57.427.2] [image:5.595.336.526.441.615.2]The documentation and guidance documents regarding FFR, MFR and EFR define the respective delay and maximum provision duration of each response [1,2,36–41]. However, for the consideration of AC signals, the change in grid frequency and the sampling rate for the provision are of higher relevance. The grid frequency is dependent upon the energy balance of the National Grid and is therefore changing constantly. The sampling rate is given for EFR as one reading every 100 ms [2], which results in a minimum symmetric pulse time of 200 ms. This is well below the maximum pulse time, meaning that provision of frequency response can result in pure utilisation of the cell Fig. 4.Isolated Pseudo-Capacitance from EIS data.
Fig. 5.Bode Plot for type A at 14.4 A and 50% SoC.
[image:5.595.70.260.442.600.2]capacitance.
Although National Grid is trialling new frequency response ap-proaches and plans to revamp the balancing mechanism [42,43], the necessity of frequency response, the technical suitability of battery storage for this service, as well as the service’s impact on the system are likely to remain similar.
The pulses applied in [17] had a duration of 40 s. Although it is not guaranteed that the capacitance is the dominant process, it is very likely that the diffusion process is at least significantly reduced by the pseudo-capacitance. This makes pseudo-capacitance a valid possible explana-tion for the in [17] observed minimal cell ageing.
8. Conclusion
In this paper, a fast method has been presented to clearly diff er-entiate between pseudo-capacitance and diffusion within a Li-ion cells
byfitting the reactive impedance to CPE behaviour. This enables users to distinguish between electrical and electrochemical processes during charge and discharge of the cell. Through this method, the capacitance-diffusion transitional frequency (CDTF) can be determined, which is a soft border for the respective dominant processes.
It has been shown, that this border is independent of the current intensity (up to 1C) and therefore not affected by non-linearities of internal resistance. However, it is apparent that there is an exponential relationship between this frequency and the SoC, wherein cells at lower SoC have higher capacitive capabilities. Furthermore, higher relative surface between anode and cathode seems to enhance them as well.
[image:6.595.80.517.56.400.2]Analysis of this frequency and the requirements of frequency re-sponse services shows, that short-term symmetrical pulses are absorbed by the pseudo-capacitance of the cell. The results displayed in [17] indicate, that this utilisation significantly reduces the cell ageing in respect to throughput. A potential explanation would be that the Fig. 7.CDTF for changing currents and varying states of charge for all types.
Fig. 8.Rectangular (left) and sawtooth (right) charge-discharge current profiles. [17].
[image:6.595.143.454.606.728.2]reduction in diffusion reduces the mechanical stress on the cell caused by anode expansion, and therefore reduces the loss of active material [44].
However, even without diffusion processes, several other ageing processes such as the SEI formation might still be impacted by this utilisation. The increase in cell temperature as observed in [17] could even accelerate these processes. In future experiments it is therefore planned to perform further accelerated ageing studies comparing the impact of high frequency utilisation against low frequency utilisation of the cell.
If there is a benefit in operating a cell below CDTF, it would further be possible to investigate the ideal conditions for this utilisation under the perspectives of cell pressurisation, state of charge, cell age, tem-perature and super-positioning of sinusoidal with other signals.
Acknowledgements
This project has been made possible through the EPSRC Centre for Doctoral Training in Sustainable Materials and Manufacturing (grant number: EP/L016389/1) and funding from EDF Energy. This research was done with support from the TRENDS project (reference number EP/ R020973/1).
References
[1] National Grid, Mandatory Frequency Response, (2018) Frequency Response Guide v1.1.pdfhttps://www.nationalgrid.com/sites/default/files/documents/Mandatory. [2] National Grid, Enhanced Frequency Response: Invitation to Tender for Pre-qualified Parties, (2016)http://www2.nationalgrid.com/WorkArea/DownloadAsset.aspx? id=8589935616.
[3] The Electricity Storage Network, List of Energy Storage Plants in the UK, (2017)
http://www2.nationalgrid.com/WorkArea/DownloadAsset.aspx?id=8589941197. [4] National Grid, Enhanced Frequency Response Market Information Report, (2016), pp. 1–3 Market Information Report v1.pdfhttps://www.nationalgrideso.com/sites/ eso/files/documents/EFR.
[5] V. Knap, R. Sinha, M. Swierczynski, D. Stroe, S. Chaudhary, Grid Inertial Response with Lithium-ion Battery Energy Storage Systems, (2014) 1817–1822. doi:10.1109/ ISIE.2014.6864891.
[6] B. Lian, A. Sims, D. Yu, C. Wang, R.W. Dunn, Optimizing LiFePO4 battery energy storage systems for frequency response in the UK system, IEEE Trans. Sustain. Energy. 8 (2017) 385–394,https://doi.org/10.1109/TSTE.2016.2600274. [7] S. Canevese, D. Cirio, A. Gatti, M. Rapizza, Simulation of Enhanced Frequency
Response by Battery Storage Systems : the UK Versus the Continental Europe System, (2017).
[8] D.I. Stroe, V. Knap, M. Swierczynski, A.I. Stroe, R. Teodorescu, Operation of a grid-connected lithium-ion battery energy storage system for primary frequency reg-ulation: a battery lifetime perspective, IEEE Trans. Ind. Appl. 53 (2017) 430–438,
https://doi.org/10.1109/TIA.2016.2616319.
[9] M. Swierczynski, D.I. Stroe, A.I. Stan, R. Teodorescu, D.U. Sauer, Selection and performance-degradation modeling of limo2/li 4ti5o12 and lifepo4/c battery cells as suitable energy storage systems for grid integration with wind power plants: an example for the primary frequency regulation service, IEEE Trans. Sustain. Energy 5 (2014) 90–101,https://doi.org/10.1109/TSTE.2013.2273989.
[10] D.I. Stroe, M. Swierczynski, A.I. Stroe, R. Laerke, P.C. Kjaer, R. Teodorescu, Degradation behavior of lithium-ion batteries based on lifetime models andfield measured frequency regulation mission profile, IEEE Trans. Ind. Appl. 52 (2016) 5009–5018,https://doi.org/10.1109/TIA.2016.2597120.
[11] J. Schmitt, A. Maheshwari, M. Heck, S. Lux, M. Vetter, Impedance change and capacity fade of lithium nickel manganese cobalt oxide-based batteries during ca-lendar aging, J. Power Sources 353 (2017) 183–194,https://doi.org/10.1016/j. jpowsour.2017.03.090.
[12] E. Barsoukov, J.R. Macdonald, Impedance Spectroscopy: Theory, Experiment, and Applications, (2010)http://books.google.com/books?hl=en&lr=&id= StDjdRnT72AC&oi=fnd&pg=PR9&dq=Supersymmetry:+Theory,+Experiment, +and+Cosmology&ots=VfJ4xl4eAq&sig=sh9EfE3rqkdk6iEl0Jxpbqt9oFg. [13] Q. Zhuang, X. Qiu, S. Xu, Diagnosis of electrochemical impedance spectroscopy in
lithium-ion batteries, InTech. (2012) 189–226,https://doi.org/10.5772/26749. [14] J. de Hoog, J.M. Timmermans, D. Ioan-Stroe, M. Swierczynski, J. Jaguemont,
S. Goutam, N. Omar, J. Van Mierlo, P. Van Den Bossche, Combined cycling and calendar capacity fade modeling of a Nickel-Manganese-Cobalt Oxide Cell with real-life profile validation, Appl. Energy 200 (2017) 47–61,https://doi.org/10. 1016/j.apenergy.2017.05.018.
[15] S. Käbitz, J.B. Gerschler, M. Ecker, Y. Yurdagel, B. Emmermacher, D. André, T. Mitsch, D.U. Sauer, Cycle and calendar life study of a graphite|LiNi1/3Mn 1/ 3Co1/3O2 Li-ion high energy system. Part A: Full cell characterization, J. Power Sources 239 (2013) 572–583,https://doi.org/10.1016/j.jpowsour.2013.03.045. [16] M. Ecker, N. Nieto, S. Käbitz, J. Schmalstieg, H. Blanke, A. Warnecke, D.U. Sauer,
Calendar and cycle life study of Li(NiMnCo)O2-based 18650 lithium-ion batteries, J. Power Sources 248 (2014) 839–851,https://doi.org/10.1016/j.jpowsour.2013.
09.143.
[17] M. Ceraolo, G. Lutzemberger, D. Poli, Aging evaluation of high power lithium cells subjected to micro-cycles, J. Energy Storage 6 (2016) 116–124,https://doi.org/10. 1016/j.est.2016.03.006.
[18] I. Baghdadi, O. Briat, J.Y. Delétage, P. Gyan, J.M. Vinassa, Lithium battery aging model based on Dakin’s degradation approach, J. Power Sources 325 (2016) 273–285,https://doi.org/10.1016/j.jpowsour.2016.06.036.
[19] Giorgio Rizzoni, Aging Propagation Modeling And State Of Health Assessment In Battery Systems, (2015) (accessed July 13, 2017),http://energy.case.edu/sites/ energy.case.edu/files/images/150401_cwru_seminar_rizzoni.pdf.
[20] D. Pritzl, J. Landesfeind, H.A. Gasteiger, S. Solchenbach, An analysis protocol for three-electrode Li-Ion battery impedance spectra : part II, Anal. Graphite Anode Cycled vs. LNMO 165 (2018),https://doi.org/10.1149/2.0461810jes.
[21] T.M. Silva, L. Guerlou-demourgues, A. Ad, C.D.Q. Estrutural-cqe, I.S. T, Application of the Mott-Schottky model to select potentials for EIS studies on electrodes for electrochemical charge storage n-M a, Electrochim. Acta 289 (2018) 47–55,https:// doi.org/10.1016/j.electacta.2018.08.077.
[22] C. Pastor-Fernández, K. Uddin, G.H. Chouchelamane, W.D. Widanage, J. Marco, A comparison between electrochemical impedance spectroscopy and incremental capacity-differential voltage as Li-ion diagnostic techniques to identify and quantify the effects of degradation modes within battery management systems, J. Power Sources 360 (2017) 301–318,https://doi.org/10.1016/j.jpowsour.2017.03.042. [23] C. Pastor-Fernandez, W. Dhammika Widanage, J. Marco, M.A. Gama-Valdez,
G.H. Chouchelamane, Identification and quantification of ageing mechanisms in Lithium-ion batteries using the EIS technique, 2016 IEEE Transp. Electrif. Conf. Expo, ITEC (2016),https://doi.org/10.1109/ITEC.2016.75201982016. [24] Y. Firouz, R. Relan, J.M. Timmermans, N. Omar, P. Van Den Bossche, J. Van Mierlo,
Advanced lithium ion battery modeling and nonlinear analysis based on robust method in frequency domain : nonlinear characterization and non-parametric modeling, Energy 106 (2016) 602–617,https://doi.org/10.1016/j.energy.2016.03. 028.
[25] J. Fleming, T. Amietszajew, J. Charmet, A. John, D. Greenwood, R. Bhagat, The design and impact of in-situ and operando thermal sensing for smart energy storage, J. Energy Storage 22 (2019) 36–43,https://doi.org/10.1016/j.est.2019.01.026. [26] N. Harting, N. Wolff, F. Röder, U. Krewer, Electrochimica acta nonlinear frequency
response analysis (NFRA) of lithium-ion batteries, Electrochim. Acta 248 (2017) 133–139,https://doi.org/10.1016/j.electacta.2017.04.037.
[27] N. Wolff, N. Harting, M. Heinrich, R. Fridolin, U. Krewer, Nonlinear frequency re-sponse analysis on lithium-ion batteries : a model-based assessment, Electrochim. Acta 260 (2018) 614–622,https://doi.org/10.1016/j.electacta.2017.12.097. [28] M.D. Murbach, V.W. Hu, Nonlinear electrochemical impedance spectroscopy of
li-thium-ion batteries : experimental approach, analysis, and initialfindings, J. Electrochem. Soc. 165 (2018) 2758–2765,https://doi.org/10.1149/2.0711811jes. [29] P. Büschel, U. Tröltzsch, O. Kanoun, Calculation of the distribution of relaxation
times for characterization of the dynamic battery behavior, Int. Multi-Conference Syst. Signals Devices (2012) 9–11,https://doi.org/10.1109/SSD.2012.6198129
SSD 2012 - Summ. Proc.
[30] O. Kanoun, P. Büschel, T. Günther, Distribution of Relaxation Times for Effect Identification and Modeling of Impedance Spectra, (2014), pp. 1–4,https://doi. org/10.1109/I2MTC.2014.6860872.
[31] J. Bartoszek, S. Wang, P. Jasinski, Distribution of Relaxation Times As a Method of Separation and Identification of Complex Processes Measured by Impedance Spectroscopy, (2017), pp. 1–5.
[32] E. Tuncer, Distribution of relaxation times : an inverse problem, IEEE Trans. Dielectr. Electr. Insul. 19 (2012) 1221–1225,https://doi.org/10.1109/TDEI.2012. 6259994.
[33] E. Spahic, G. Kuhn, R. Morgenstern, G. Beck, Fast Frequency Response in UK Grid–
Challenges and Solution, (2016), pp. 1–6,https://doi.org/10.1049/cp.2017.0013. [34] Ametek Scientific Instruments, ModuLab XM ECS | Potentiostat | Solartron
Analytical, (2018) (Accessed September 17, 2018),https://www.ameteksi.com/ products/potentiostats/single-channel/modulab-xm-series/modulab-xm-ecs. [35] National Grid, Firm Frequency Response Agreement, (2005) BM and Non Dynamic
-12.05.17_0.pdfhttps://www.nationalgrid.com/sites/default/files/documents/Non. [36] National Grid, Enhanced Frequency Response, (2016)http://www2.nationalgrid.
com/WorkArea/DownloadAsset.aspx?id=8589935616.
[37] National Grid, Firm Frequency Response (FFR), (2017) Frequency Response 1.1.pdf
https://www.nationalgrid.com/sites/default/files/documents/Firm.
[38] National Grid, Firm Frequency Response, (2016)http://www2.nationalgrid.com/ uk/services/balancing-services/frequency-response/firm-frequency-response/. [39] National Grid, Firm Frequency Response Tender Rules and Standard Contract
Terms, (2016), pp. 1–105 SCTs - Issue 8 Feb 1st 2017_0.pdfhttps://www. nationalgrid.com/sites/default/files/documents/FFR.
[40] National Grid, Firm Frequency Response: Tender Assessment Principles, (2005), pp. 1–3. Assessment Principles.pdfhttps://www.nationalgrideso.com/sites/eso/files/ documents/Tender.
[41] National Grid, Mandatory Frequency Response, (2017) (Accessed January 30, 2017), http://www2.nationalgrid.com/uk/services/balancing-services/frequency-response/mandatory-frequency-response/.
[42] Tom Grimwood, National Grid to Trial Weekly Frequency Response Auctions -Utility Week, (2018) (accessed September 28, 2018),https://utilityweek.co.uk/ national-grid-to-trial-weekly-frequency-response-auctions/.
[43] Liam Stoker, National Grid Teases Huge Reforms to UK’s Grid-balancing Services Market | Energy Storage News, (2018) (Accessed September 28, 2018),https:// www.energy-storage.news/news/national-grid-teases-huge-reforms-to-uks-grid-balancing-services-market.
![Fig. 8. Rectangular (left) and sawtooth (right) charge-discharge current profiles. [17].](https://thumb-us.123doks.com/thumbv2/123dok_us/9425702.446646/6.595.80.517.56.400/fig-rectangular-sawtooth-right-charge-discharge-current-proles.webp)
