Electronic copy available at: http://ssrn.com/abstract=1758683
The impact of the institutional environment on the value relevance
of fair values
Peter Fiechter
University of Neuchatel
Zoltan Novotny-Farkas
Lancaster University
ABSTRACT Most prior studies attribute valuation discounts on certain fair valued assets to
measurement error or bias. We argue that institutional differences across countries (e.g., information environment or market sophistication) affect investors’ ability to process and impound fair value information in their valuation. We predict that the impact of the institutional environment on the value relevance is particularly pronounced for reported fair values of assets designated at fair value through profit or loss (hereafter, “FVO assets”), for which investor experience is lowest and complexity is highest. Using a global sample of IFRS banks, we find that FVO assets are generally less value relevant than held-for-trading assets (HFT) and available-for-sale assets (AFS). By partitioning countries into market- and bank-based economies to proxy for institutional differences, we find that the valuation discount on FVO assets is more pronounced in bank-based economies. Additional tests suggest that this valuation discount is attenuated by a richer firm-level information environment and the presence of institutional investors with fair value experience. Robustness analyses show that our findings are not solely attributable to differences in fair value measurement, fair value quality, or asset type composition.
Keywords: Fair Value Accounting, International Financial Reporting Standards (IFRS), Value Relevance, Institutional Accounting, Information Environment
JEL Classifications: G21, M41
Electronic copy available at: http://ssrn.com/abstract=1758683
1
1 Introduction
The literature investigating the value relevance of fair values primarily focuses on fair value
measurement issues, providing evidence that this value relevance decreases with measurement
error or bias (e.g., Barth 1994; Barth et al. 1996; Eccher et al. 1996; Song et al. 2010). Studies
examining other determinants of the value relevance of fair values are scarce: Some show that
this value relevance increases when fair values are expected to be realized through sale or
settlement in the short term (Park et al. 1999) and when they reflect the expected opportunity
costs and benefits of holding specific cash flow rights of financial instruments (Evans et al.
2014). In an experimental setting, Koonce et al. (2011) find that investors judge fair value as
relevant when the instrument is expected to be sold or settled soon, not held to maturity. Finally,
Skinner (1996) points out that the complexity of certain fair values (i.e., bank derivatives and
employee stock options) can limit the ability of market participants to properly process and
impound fair value information in their valuation.
We examine whether international variation in institutional factors plays a role in
determining the value relevance of reported fair values beyond fair value measurement. Since the
worldwide adoption of IFRS around 2005, banks are largely affected by the application of IAS
39 Financial Instruments: Recognition and Measurement, which provides three fair value
categories for financial assets: held-for-trading (HFT), available-for-sale (AFS), and the fair
value option (FVO).1 The idea behind the three fair value categories is to inform financial
2
statement users about managements’ intent on how value will be realized from financial
instruments (e.g., FASB 1993; Park et al. 1999; IASB 2006). However, this intent-based
classification assumes that market participants properly process and impound this information in
their valuation.
In an international setting, the ability to process fair value information likely varies with
institutional factors, such as the country-level information environment and market
sophistication. However, institutional factors might have a different impact on each of the three
fair value categories. In particular, we expect the institutional effect to be most pronounced for
FVO assets, because (a) experience is lowest for the FVO, which—after several amendments—
was effective as of January 1, 2006; (b) the intent underlying banks’ application of the FVO can
be unclear (BCBS 2006a); and (c) the FVO was the most controversially debated fair value
category among practitioners, regulators, and standard setters (ECB 2004, Fiechter 2011).
Therefore, the FVO potentially raises complexity for financial statement users.2
To investigate whether and how the value relevance of fair values varies with the
institutional environment, we classify countries into market- and bank-based economies (Ali and
Hwang 2000; Beck and Levine 2002). The institutional features of market-based economies are
geared more towards the information needs of arm’s length investors (e.g., Ali and Hwang 2000;
Leuz 2010). Specifically, high stock market development, high disclosure standards, and strong
information environments likely ensure that capital market participants properly process and
3
price fair value information. In contrast, in bank-based economies with less developed stock
markets and weaker information environments, investors might have difficulties in processing
fair value information. However, to the extent that bank-based economies have weaker
enforcement, the institutional environment could also impact measurement error (or bias) and, in
turn, the value relevance of fair values.
We hand-collect data on reported fair values of financial instruments for IFRS banks from
2006 through 2009, resulting in a global sample of 907 bank-years from 46 countries.3 Applying
the research design of previous studies (e.g., Landsman et al. 2008; Song et al. 2010), we test for
differences in value relevance across both fair value categories and institutional environments.
Our setting has two main advantages: First, because all three fair value categories are recognized
fair values, differences in value relevance cannot be attributable to a lesser reliability of
disclosed fair values than recognized fair values. Second, we can compare estimated valuation
coefficients across two dimensions: fair value categories and institutional environment.
We find that FVO assets are generally less value relevant than HFT and AFS assets. The
valuation coefficient on FVO assets is particularly pronounced in bank-based economies. In
contrast, the value relevance of HFT and AFS assets does not significantly vary across
institutional environments. This finding increases confidence that the estimated valuation
discount for FVO assets in bank-based economies is not solely attributable to a generally lower
valuation of accounting fundamentals in such economies. However, at this stage, we cannot yet
determine whether measurement error or differences in the ability to properly process fair value
information contribute to these results.
4
To investigate whether the observed differences in value relevance are linked to differences
in investors’ ability to process fair value information, we perform two additional tests exploiting
firm-specific within-country variation. Specifically, we address two potential frictions: the
information environment and investors’ experience with fair values. First, we examine whether
firm-specific transparency improves value relevance, because recent empirical studies show that
firm-specific transparency matters most in otherwise opaque (country-level) information
environments (Maffett 2012; Lang et al. 2012). We find that a stronger firm-level information
environment results in a higher value relevance of FVO assets in bank-based economies,
suggesting that the weaker country-level information environment in such economies limits
investors’ ability to properly process fair value information of FVO assets.
Second, we examine whether the value relevance of fair values varies with institutional
investors’ experience with the use of fair values. Specifically, we argue that because of Nordic
investors’ longer experience with fair value accounting, these investors should be better able to
understand FVO assets. Our results are consistent with this prediction. In particular, while
variation in institutional investor holdings generally does not impact value relevance, we find
that larger holdings by Nordic institutional investors significantly increase the value relevance of
the FVO in bank-based economies. This finding supports the notion that more experience with
fair values improves investors’ ability to process fair value information.
We run several additional tests to rule out alternative explanations, in particular that
differences in measurement error or fair value quality are driving our results. First, to mitigate
concerns that measurement error may be systematically higher for FVO assets in bank-based
economies, we test whether the distribution of the valuation inputs (i.e., Levels 1, 2, and 3)
5
comparisons reveal that the proportion of Level 3 relative to Level 1 and 2 inputs is higher
(lower) for FVO assets than for HFT (AFS) assets. While the proportion of Level 3 inputs for
FVO assets is lower in bank-based than in market-based economies, the proportion of Level 2
inputs is higher, possibly explaining some of the valuation discount of FVO assets in bank-based
economies. Therefore, we also perform multivariate tests by holding constant the level of fair
value measurement (i.e., Level 1), for which measurement error is presumably lowest (Song et
al. 2010, Goh et al. 2015). Consistent with our main findings, we find a valuation discount only
for Level 1 FVO assets, and the discount is larger in bank-based economies. However, the
valuation discount on the FVO is smaller than in the primary findings, indicating that fair value
measurement explains some but not all of the lower value relevance.
Second, to investigate whether fair value quality differs between market- and bank-based
economies, we test the ability of fair values to reflect the underlying cash flow and risk
characteristics of FVO assets. Following Altamuro and Zhang (2013), we test whether FVO
valuation multiples reflect the persistence of underlying cash flows (i.e., interest, dividends, and
net gains from asset disposals). We find that, in both financial systems, FVO valuation multiples
are significantly higher when the underlying cash flows are more (less) persistent (risky). This
finding mitigates the concern that differences in the quality of fair values are driving our main
results.
We contribute to the literature by providing evidence that, beyond fair value measurement
issues, other factors also play a significant role in determining the value relevance of fair values.
Our findings suggest that international variation in investors’ ability to process fair value
information impacts the value relevance of fair values. Specifically, weak information
6
fair value information. Therefore, we provide empirical support for Skinner’s (1996) argument
and show that information processing is not only an issue for disclosed but also for recognized
fair values (e.g., Bernard and Schipper 1994; Schipper 2007). In addition, on the descriptive
level, we provide evidence on the extent of fair value accounting and the use of fair value
measurement inputs for a comprehensive international sample of banks. Consistent with prior
small sample evidence (Laux and Leuz 2010), we show that, on average, banks measure a
relatively small portion of their assets at fair value, and even a smaller portion at fair value
through profit or loss—a fact that the debate on fair value accounting often neglects.
The remainder of the paper is organized as follows. Section II reviews relevant prior work,
introduces the different fair value categories under IAS 39, and develops predictions. Section III
outlines the research design, and Section IV describes the sample and data. Section V presents
empirical results and Section VI includes additional analyses and robustness checks. Section VII
concludes.
2 Background and predictions
2.1 Literature review
Prior literature focuses on the role of measurement issues (estimation error or bias) as a main
source of variation in the value relevance of fair values. For a sample of U.S. banks, Barth
(1994) provides evidence that the fair values of investment securities are incrementally
associated with bank share prices. Several studies assess the value relevance of disclosed fair
values of different types of bank assets: investment securities, loans, deposits, and long-term
7
of investment securities are incrementally informative, whereas the findings for the value
relevance of loans and deposits are inconclusive.
While early research examined the value relevance of disclosed fair values, more recent
studies focus on recognized fair values. Ahmed et al. (2006) find that recognized fair values of
derivatives are value relevant, whereas disclosed fair values are not. Kolev (2009), Song et al.
(2010), and Goh et al. (2015) examine whether the value relevance of fair values varies with
valuation inputs (i.e., Levels 1, 2, and 3). As Level 3 fair values are based on unobservable
inputs, they might be subject to management discretion. Therefore, these studies predict and find
that investors discount Level 3 fair value estimates.
Studies investigating other determinants (than measurement issues) of the value relevance of
fair values are scarce. Park et al. (1999) analyze whether intent-based classification reflects
value-relevant information. They find that the fair value differences of banks’ AFS securities are
more value relevant than the fair value differences of held-to-maturity (HTM) securities, because
managers intend to sell AFS securities in the short term. However, the result of Park et al. (1999)
might be driven by AFS fair value changes being recognized in financial statements, whereas the
fair values of HTM securities are only disclosed (Ryan 1999). In an experimental setting,
Koonce et al. (2011) find that fair values of HTM securities are not relevant for valuation,
because investors might not perceive such unrealized fair value gains and losses as forgone
opportunities. Evans et al. (2014) predict and find that the differential pricing of fair value
information is also related to differential predictive ability of fair values, not only to
measurement error.
These studies examine the value relevance of fair values in the U.S.—a setting with
8
presumably properly process fair value information (Skinner 1996). However, in an international
setting, institutional factors likely influence the properties of fair values. For example, De Fond
et al. (2015) find an increase in crash risk post IAS 39 adoption only for banks in countries with
weak banking regulation. In addition, Ball et al. (2015) find that the use of fair values reduces
the relevance of accounting numbers for debt contracting.4
Few studies examine the value relevance of fair values in an international setting, and most
of them focus on non-financial assets. For example, Müller et al. (2015) find for a sample of EU
real estate firms that disclosed fair values have a lower association with equity prices than
recognized fair values. The only study investigating the value relevance of financial assets, at
least indirectly, is Barth et al. (2014) who provide evidence that net income adjustments related
to IAS 39 are incrementally value relevant for financial firms but not for non-financial firms.
The authors attribute this finding to the greater use of fair values under IAS 39 than under
domestic GAAP, but do not directly test this argument. In this paper, we specifically test the
value relevance of recognized fair values across different categories and institutional
environments. We argue that the ability to process fair value information varies with institutional
factors such as the country-level information environment and investors’ experience with fair
values, in turn affecting the value relevance of fair values.
2.2 Fair value accounting under IAS 39
The worldwide introduction of IFRS yielded a significant expansion in fair value
accounting. While the trading books of banks were measured at fair value (or at the lower of cost
9
or market value) in most countries under their local GAAPs, IFRS allow or require fair value
measurement for a substantial part of the banking book, which previously was carried at
amortized cost (Matherat 2008). IAS 39 Financial Instruments: Recognition and Measurement
provides three fair value categories: HFT, FVO, and AFS. The three fair value categories differ
in the conditions for their application and the recognition of unrealized fair value gains or losses.
HFT assets are measured at fair value with all changes in fair value recognized in the
income statement. According to IAS 39, paragraph 9 (IASB 2006), a financial asset is defined as
trading if it is principally acquired to sell in the near term. While non-hedging derivatives are
always categorized as HFT, firms have some leeway on how they interpret the phrase
“principally acquired to sell in the near term” for non-derivative financial assets. Thus,
classifying a security as HFT generally conveys the information that its fair value gains and
losses are (intended) to be realized in the short term.
Upon initial recognition, entities can choose to designate a financial asset for measurement
at fair value through profit or loss (FVO).5 When introducing the FVO, the IASB’s main
objective was to provide entities with an alternative to hedge accounting, thereby alleviating
accounting mismatch issues that arise from the mixed measurement model. However, although
using the FVO can potentially reduce accounting mismatches, at least three drawbacks exist.
First, the optional nature of the FVO leads to less comparability within a bank and across banks,
as similar (or identical) economic transactions are differently measured according to the
10
subjective managerial intent. Second, the FVO may be applied inconsistent with the IASB’s
stated intent of reducing accounting mismatches. Related, prudential supervisors are concerned
about inappropriate FVO application (ECB 2004; BCBS 2006a). Third, even when the FVO is
applied consistent with the IASB’s intent, investors might not know the extent to which an item
is economically hedged or what that item is. These issues create complexity for financial
statements users.
AFS is a residual category for financial assets under IAS 39. Fair value changes of AFS
assets are recognized in other comprehensive income unless assets are sold or there is objective
evidence of impairment. Banks usually hold AFS assets for an indefinite period of time. AFS
assets may be held until maturity or sold earlier to manage interest rate risks, prepayment risks,
or liquidity needs. However, certain accounting rules for AFS—particularly the different
impairment rules for debt and equity securities—can create application problems (ESMA 2010;
IASB 2011, para. BC 5.25b).
2.3 Institutional environment and the value relevance of fair values
Underlying the intent-based classification of financial instruments is the idea that it provides
relevant and useful information for evaluating a firm’s investment strategy and performance
(e.g., FASB 1993; Park et al. 1999; IASB 2006). Whether managerial intent conveyed by asset
classifications matters for valuation purposes is debatable. Some argue and find that when assets
are held to maturity and contractual cash flows are collected, fair values are not relevant (Park et
al. 1999; Koonce et al. 2011). Others counter that, even when assets are held until maturity, fair
values are relevant, because they inform investors about the opportunity costs and benefits of
11
In a perfect world, absent measurement error and bias, fair values should be value relevant
regardless of asset categorization and managerial intent. However, in an international setting, we
argue that variation in institutional features across countries likely affects investors’ ability to
process fair value information for two main reasons. First, investors’ ability to process this
information might be complicated by the significant variation across countries in the quantity
and the quality of disclosures related to financial instruments (Bischof 2009) and, more
generally, the strength of information environment (e.g., Maffett 2012). For example,
understanding why a bank elects the FVO is important. If the FVO alleviates accounting
mismatches, further information is relevant on which risks are hedged and the effectiveness of
the hedge. However, such disclosures (a) are neither standardized nor complete in international
banks’ financial statements, and (b) likely vary across countries.
Second, investors’ experience with the use of fair value information beyond the trading book
is limited in many institutional environments. A prominent exception is Denmark where
investors are likely to be more accustomed to fair values, because banks applied mark-to-market
accounting to a substantial portion of financial assets long before IFRS adoption (Bernard et al.
1995). Norway and Sweden extended the use of fair value accounting for banks even before the
adoption of IFRS (e.g., Gjerde et al. 2011). Prior studies’ findings suggest that experience with
fair value reporting matters for the pricing of fair value-related information (Chambers et al.
2007; Dong et al. 2014).
To test the impact of institutional environment on the value relevance of fair values, we
classify countries into market-based and bank-based financial systems (Ali and Hwang 2000,
12
stock market development, disclosure rules, or enforcement) that likely affect investors’ ability
to process fair value information.6
Market-based economies are characterized by a stronger development of stock markets
relative to bank-based economies. Contracting parties operate at arm’s length, and information
asymmetries are resolved by public disclosure (e.g., Ali and Hwang 2000, Beck and Levine
2002). A stronger country-level information environment (e.g., more disclosure or broader
information dissemination) likely improves investors’ ability to process fair value information.
In contrast, in bank-based economies, the central role of banks in allocating resources reduces
the need for public disclosure, resulting in a generally weaker information environment.
Moreover, because fair value accounting limits contractibility (Ball et al. 2015), investors’ use of
and experience with fair values are likely lower in the more debt-reliant bank-based economies.
Finally, given the lower number of institutional investors and professional information
intermediaries (e.g., analysts), investors’ ability and comfort in using fair value information is
likely lower in bank-based economies.7
To the extent that investors in market-based economies properly process fair value
information, we should not observe substantial differences in value relevance across fair value
categories. However, we expect that the institutional features of bank-based economies limit
investors’ ability to properly process fair value information, particularly for FVO assets, for
which familiarity is lowest and complexity is highest.
6 We do not use the Ball et al. (2000) dichotomous classification of countries into code law versus common law systems, because all countries in our sample apply IFRS. We also do not classify countries into outsider and insider economies (Leuz et al. 2003), because relevant data are missing for numerous countries in our sample. 7
13
To more directly attribute potential differences in value relevance to country-level frictions
(i.e., weak information environment and little fair value experience), we next investigate
firm-specific variation in information environment and fair value experience. First, given that
firm-specific transparency matters most in otherwise opaque environments (Maffett 2012; Lang et al.
2012), we predict that a high bank-specific information environment increases the value
relevance of reported fair values, particularly that of FVO assets in bank-based economies.
Second, to more directly test whether experience with recognized fair values drives
differences in value relevance, we exploit variation in institutional investor holdings within our
country clusters. Following previous literature (e.g., Balsam et al. 2000, Bartov et al. 2000,
Collins et al. 2003), we use institutional investor holdings as a proxy for investor sophistication.
More sophisticated investors should be better able to process fair value information. However,
particularly in bank-based economies, even institutional shareholders may lack experience with
fair values, especially the FVO. Therefore, in further tests, we use the presence of Nordic
institutional shareholders as a proxy for investors’ experience with fair values, because these
shareholders have a long history of using fair values. Following the logic of our previous
predictions, we expect the effect of institutional shareholders’ experience to be most pronounced
for the FVO in bank-based economies.
3 Research design
3.1 Measurement of the financial system
Following Beck and Levine (2002), we use the indicator variable Financial_Structure to
distinguish between market- and bank-based economies. We first calculate Structure_Aggregate
14
construct this variable as the first principal component of two variables that capture the
comparative activity and size of stock markets relative to banks in the economy. The first
variable, Structure_Activity, is the log of the ratio of value traded (Value_Traded) to bank credit
(Bank_Credit). Value_Traded equals the value of stock transactions as a share of the gross
domestic product (GDP). Bank_Credit represents the claims of the banking sector on the private
sector as a share of GDP. The second variable Structure_Size is the log of the ratio of
Market_Capitalization to Bank_Credit. Market_Capitalization is a proxy for the size of the stock
market calculated as the value of listed shares divided by GDP. We average data for
Structure_Aggregate from 1995 to 2004 (source: World Bank8).9 Finally, we define
Financial_Structure equal to 1 (i.e., market-based) if Structure_Aggregate for a country is above
the sample median, and 0 (i.e., bank-based) otherwise.
3.2 Value relevance of fair values across institutional environments
Following prior value relevance literature (e.g., Barth et al. 2001; Landsman et al. 2008;
Song et al. 2010; and Goh et al. 2015), we regress share price on reported balance sheet values
and net income:
PRICEit = β0 + β1FVOA_PSit + β2HFTA_PSit + β3AFS_PSit + β4OA_PSit + β5FVOL_PSit +
β6HFTL_PSit + β7OL_PSit + β8NI_PSit + Yeart+ Countryi + εit (1)
8 The data can be downloaded at:
http://econ.worldbank.org/WBSITE/EXTERNAL/EXTDEC/EXTRESEARCH/0,,contentMDK:20696167~page PK:64214825~piPK:64214943~theSitePK:469382,00.html. We use the November 2013 version of the dataset. 9 Following Beck and Levine (2002), we average the data over a 10-year period. We use a 10-year period that
15
PRICE is the market value of equity as of March 31. FVOA_PS, HFTA_PS, and AFS_PS are
FVO assets, HFT assets, and AFS assets, respectively, as of December 31. OA_PS are non-fair
value assets as of December 31. FVOL_PS and HFTL_PS are FVO liabilities and HFT liabilities,
respectively, as of December 31. OL_PS are non-fair value liabilities as of December 31. NI_PS
is the net income for the financial year. We scale all variables by the number of outstanding
shares (Barth and Clinch 2009), and we denominate values in U.S. Dollars (USD).
For the main tests, we partition the sample into market- and bank-based economies, and we
separately estimate Equation (1) using OLS.10 Following Nelson (1996) and Landsman et al.
(2008), we use March 31 share prices as the dependent variable, whereas our explanatory
variables are from December 31 of the previous year. Accordingly, we assume that the
information of the annual report is available to investors by March 31.11 As we pool observations
across years, we use heteroskedasticity-robust standard errors that are clustered by bank (Rogers
1993).12 To control for differences across years, we include year dummies for all years except the base year 2006. To control for country-specific differences in bank valuation beyond the
market structure, we include country fixed effects throughout the analyses.13
10 We partition the sample instead of using interaction terms, as we use both sample partitions and interaction terms for the additional tests on the role of the firm-specific information environment and institutional investors. However, our main inferences hold when we use interaction terms between Financial_Structure and FVO_PS, HFTA_PS, and AFS_PS, respectively (see also Section V).
11 We do not use share prices later than March 31, as new information in connection with the first quarter earnings announcements may be available to investors.
12 When using standard errors clustered by country, our inferences remain similar, although this clustering changes the significance levels of some coefficients.
13
16
3.3 The role of firm-level information environment and institutional investors
To test the effect of firm-level information environment on value relevance of fair values,
we extend Equation (1) by the variable High_Info and interaction terms between High_Info and
FVOA_PS, HFTA_PS, and AFS_PS, respectively (Equation 2).14 High_Info equals 1 if a bank
has both above sample median analyst following (#Analysts) and above sample median market
value of equity (MV_Equity), and 0 otherwise.15 To the extent that high-quality firm-level
information environment improves investors’ ability to process fair values, we expect positive
coefficients on the interaction terms, particularly for FVO assets in bank-based economies.
PRICEit = β0 + β1FVOA_PSit + β2HFTA_PSit + β3AFS_PSit + β4OA_PSit + β5FVOL_PSit +
β6HFTL_PSit + β7OL_PSit + β8NI_PSit + β9High_Info + β10FVOA_PSit*High_Info +
β11HFTA_PSit*High_Info + β12AFS_PSit*High_Info + Yeart+ Countryi + εit (2)
To test the role of institutional investors on the value relevance of fair values, we define an
indicator variable INST that equals 1 if the percentage of shares held by institutional shareholders
is above the sample median, and 0 otherwise. We amend Equation (2) by including interaction
terms between the indicator variable INST and FVOA_PS, HFTA_PS, and AFS_PS.
To proxy for experience with fair values, we exploit differences in institutional investor
holdings across countries. We posit that in Nordic countries (i.e., Denmark, Norway, and
Sweden), institutional shareholders’ experience with the FVO is relatively high, because they
14 Following the design of Song et al. (2010), we interact High_Info only with the variables of interest (i.e., FVOA_PS, HFTA_PS, and AFS_PS) to mitigate multicollinearity issues.
17
applied fair value to a substantial portion of financial assets long before IFRS adoption (Bernard
et al. 1995; Gjerde et al. 2011). Consistent with this argument, our descriptive statistics (see
Table 2) show that the use of the FVO is substantially higher in these countries than the sample
mean. INST_Nordic equals 1 if the percentage of Nordic institutional shareholders is above the
sample median, and 0 otherwise. To the extent that the level of experience with fair values (at
least partially) explains the differences in value relevance across fair value categories and
institutional environments, we expect positive interaction terms, particularly for the FVO in
bank-based economies.
4 Sample and data
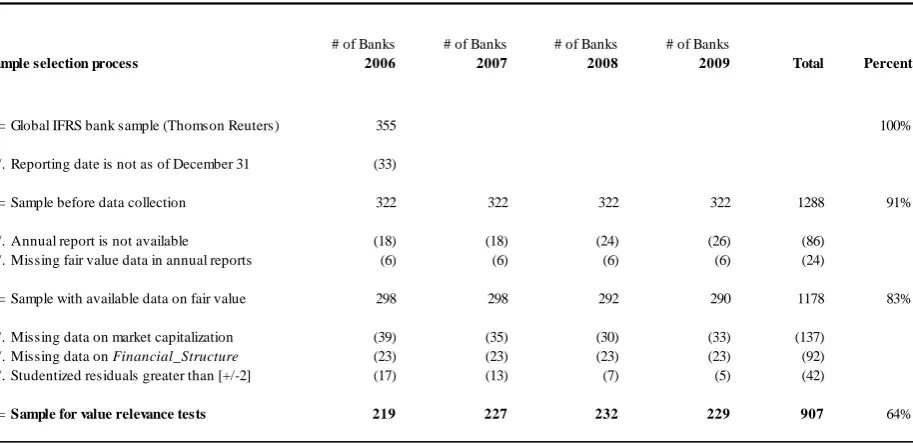
4.1 Sample selection
We focus on the banking sector because the balance sheets of banks consist primarily of
financial instruments. Using the database Thomson Reuters, we identify 355 international bank
holding companies applying IFRS. We exclude 33 banks with a reporting date other than
December 31, yielding a sample of 322 IFRS banks before data collection.
[Table 1 here]
Using this sample, we collect data from 2006 to 2009. As the FVO (in its revised,
internationally comparable version) is applicable for annual periods on or after January 1, 2006,
the earliest FVO data is available as of December 31, 2006. We hand-collect all balance
sheet-related variables and footnote disclosures. The sample is further reduced by 86 observations for
18
exclude six banks (24 observations) that do not disclose sufficient information on fair values.16
Next, we use Thomson Reuters to gather data on market capitalization, number of outstanding
shares, and net income. This data is not available for 137 observations.17 We drop 92
observations for which we cannot construct Financial_Structure because of missing data from
the World Bank. To avoid bias from extreme outliers (e.g., Belsley et al. 1980; Fox 1991), we
drop 42 observations that have absolute values of studentized residuals greater than 2 (Landsman
et al. 2008; Song et al. 2010). The final sample consists of 907 bank-years from 46 countries
worldwide.18
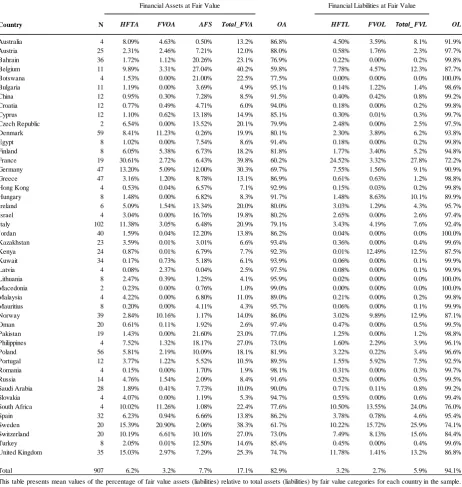
4.2 Descriptive statistics
Table 2 shows the extent to which international banks use fair values. While the average
proportion of assets (liabilities) measured at fair value to total assets of 17.1% (5.9%) is
relatively low, it varies substantially across countries. The proportion of fair valued assets is
highest in Belgium, France, and Sweden (more than 38%) and lowest in Macedonia, Oman, and
Romania (less than 3 percent).
[Table 2 here]
16
These banks do typically not distinguish between FVO and HFT assets despite the requirements of IFRS 7 (IASB 2007, para. 8).
17 Data on institutional shareholders are from SNL Financial. Because of missing data on the percentage of shares held by institutional investors in SNL Financial, the sample is reduced to 688 observations in that analysis. 18 To reduce heterogeneity in institutional factors (e.g., legal environment, political order, and culture), we conduct
19
The application of the FVO also varies substantially across countries. Out of 46 countries,
12 (26.1%) and 19 (41.3%) countries do not use the FVO for financial assets (financial
liabilities). Overall, the relatively low ratios of fair values indicate that, even for the banking
industry, the measurement attribute “fair value” is less important than alternative measurement
concepts such as amortized cost.
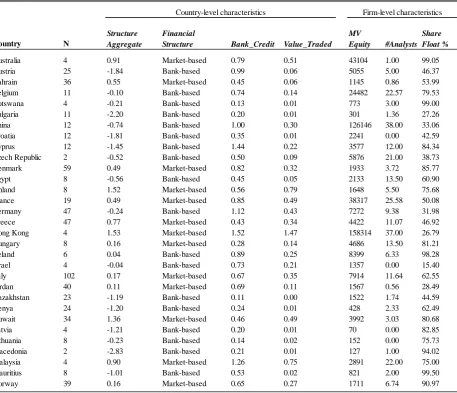
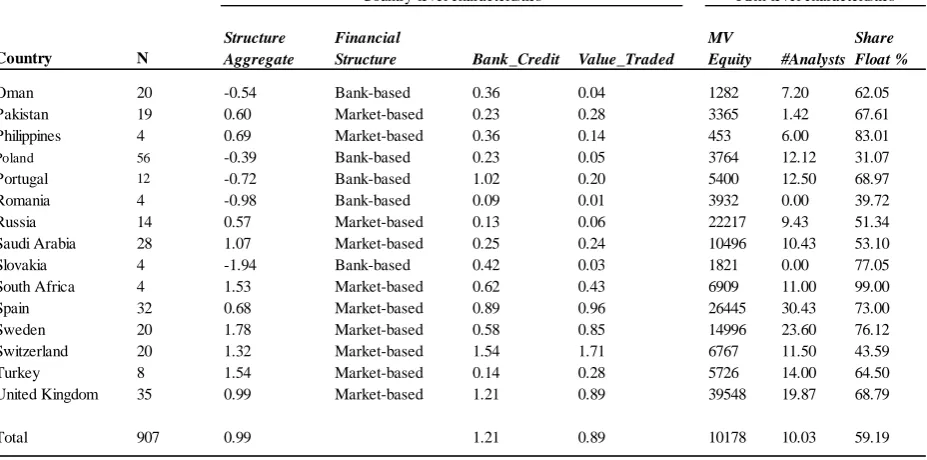
[Table 3 here]
Table 3 shows mean values on selected institutional and firm characteristics for each sample
country. Most countries correspond to their a priori perception as market- or bank-based. For
example, Australia, Hong Kong, and the United Kingdom have market-based economies,
whereas Austria and Germany have bank-based economies. However, some of the classifications
appear less intuitive. For example, France, Italy, and Spain are classified as market-based
economies.19
4.3 Validity of the institutional proxy
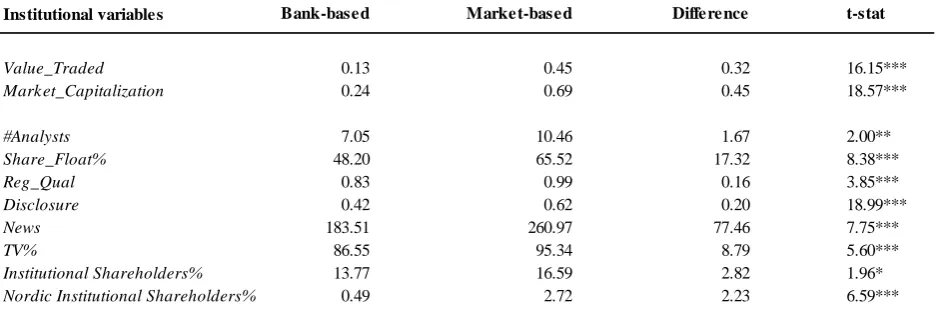
Panel A of Table 4 reports the mean values of selected institutional variables across the two
financial systems. By construction, market-based economies exhibit larger and more liquid stock
markets, as indicated by Market_Capitalization and Value_Traded, respectively. Banks in
20
market-based economies also have more analysts following (#Analysts) and more dispersed
ownership (Share_Float). The regulatory quality index (Reg_Qual) by Kaufmann et al. (2009) is
lower in bank-based economies. Moreover, market-based economies have significantly higher
disclosure standards (Disclosure) according tothe disclosure index from La Porta et al. (2006).
The significant differences in both the number of newspapers per 1,000 people (News) and the
percentage of households with television (TV%) (source: World Development Indicators 2012)
suggest that our institutional clustering also captures differences in economy-wide information
dissemination (Bushman et al. 2004). Finally, the mean percentage of shares held by (Nordic)
institutional shareholders of 16.6% (2.7%) in market-based economies is larger than that of
13.8% (0.5%) in bank-based economies, indicating a higher level of investor sophistication (fair
value experience) in market-based economies. These univariate comparisons indicate that
Financial_Structure is an appropriate aggregate proxy that measures international differences in
institutional factors, such as information environment and investor sophistication that we predict
to affect investors’ ability to process fair value information.
[Table 4 here]
Panel B of Table 4 reports mean and median values for the extent of fair value measurement
relative to total assets partitioned by Financial_Structure. The mean (median) percentage of
financial assets measured at fair value to total assets is higher in market-based economies, with
18.6% (14.5%), than in bank-based economies, with 14.4% (9.3%). In particular, the use of the
FVO for financial assets differs substantially across institutional environments, as indicated by
21
However, while statistically significant, the difference in medians is only 0.3%. The
(untabulated) proportion of banks electing the FVO for assets (liabilities) is also significantly
higher in market-based economies, with 58.3% (36.1%), than in bank-based economies, with
42.6% (23.8%).
5 Empirical results
5.1 Value relevance of fair values across institutional environments
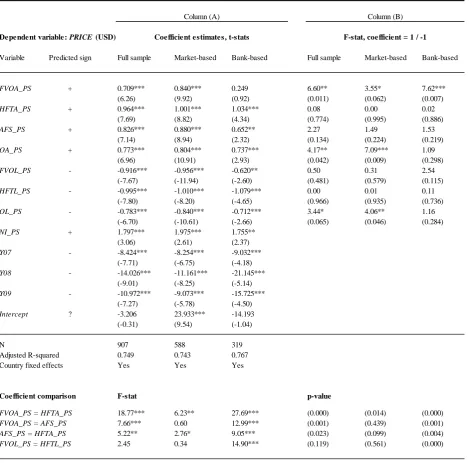
Table 5 shows the OLS regression results of share price on reported fair values for the full
sample and the subsamples of market- and bank-based economies. For the full sample, the
coefficients HFTA_PS and AFS_PS of 0.964 and 0.826, respectively, are highly significant
(t-stat = 7.69 and 7.14, respectively) and not significantly different from the theoretical value of 1
(F-stat = 0.03 and 2.27, respectively). Therefore, international investors perceive HFT and AFS
assets as value relevant.20 In contrast, the coefficient FVO_PS of 0.709 is significantly lower
than 1 (F-stat = 6.60). In addition, the coefficient comparison between FVO_PS and HFT_PS
(AFS_PS) reveals that the value relevance of FVO assets is lower than that of HFT (AFS) assets,
as indicated by the F-stat of 18.77 (7.66).
[Table 5 here]
22
When distinguishing between market-based and bank-based economies, we find that the
valuation discount on FVO assets is particularly pronounced in bank-based economies. The
value relevance of FVO assets is substantially lower in bank-based than in market-based
economies. First, in bank-based economies, the coefficient FVOA_PS of 0.249 is not
significantly different from 0 (t-stat = 0.92). Second, the (untabulated) cross-equation difference
in FVO coefficients is significantly different across market- and bank-based economies
(chi-square stat = 4.82; p-value = 0.03).21 Third, in bank-based economies, FVO assets are
substantially less value relevant than HFT (F-stat = 27.69) and AFS (F-stat = 12.99) assets.22
In contrast, HFT and AFS assets are similarly value relevant, regardless of the institutional
environment. The coefficients HFTA_PS and AFS_PS are not significantly different from their
theoretical value of 1 in both market- and bank-based economies, although the coefficient
AFS_PS of 0.652 (t-stat = 2.32) in bank-based economies is relatively low. As HFT and AFS
assets are also value relevant in bank-based economies, the finding for FVO assets is not merely
attributable to a generally lower valuation of accounting fundamentals in such economies.
We are concerned that, due to fewer observations, the lower valuation coefficient for FVO
assets in bank-based economies is driven by low statistical power.23 We rerun our analysis
(untabulated) with the pooled sample and include interaction terms between the fair value
21 We test for differences in coefficients across subsamples with seemingly unrelated regressions using Wald Chi-square tests.
22 Consistent with our findings for FVO assets, the value relevance of FVO liabilities (FVOL_PS = -0.620) is lower than that of HFT liabilities (HFTL_PS = -1.079) in bank-based economies (F-stat = 14.90) but not in market-based economies (F-stat = 0.34).
23
categories and Financial_Structure—which takes the value of 1 for market-based economies,
and 0 otherwise. The coefficient FVOA_PS of 0.555 in bank-based economies is both larger in
magnitude and more significant (t-stat = 3.83) than that in Table 5. The coefficient on the
interaction term between the FVO and market-based economies is positive (0.179) and
statistically significant (t-stat = 2.06).24 The coefficients on the interactions with HFT and AFS
assets are insignificant, indicating that the value relevance of HFT and AFS assets is similar in
both institutional environments. In sum, while these results indicate that the findings in Table 5
might suffer from low statistical power, they also confirm that the value relevance of FVO assets
is significantly lower in bank-based economies.
5.2 Firm-level information environment
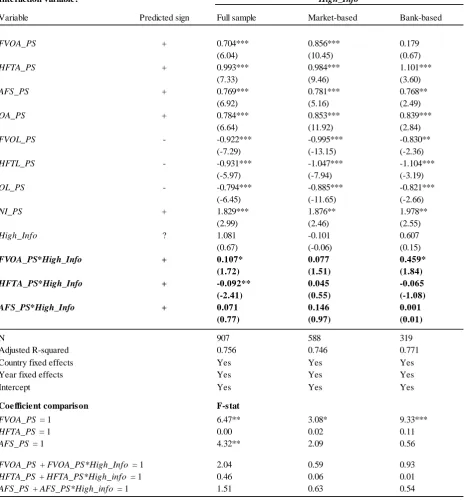
The results in Table 6 show that the value relevance of FVO assets generally improves with
higher firm-level information environment. For the full sample, the coefficient on the interaction
term FVOA_PS*High_Info is 0.107 and statistically significant (t-stat = 1.72). Table 6 further
indicates that banks from bank-based economies benefit more from better firm-level information
environment (FVOA_PS*High_Info = 0.459; t-stat = 1.84) than those from market-based
economies (FVOA_PS*High_Info = 0.077; t-stat = 1.51), although the cross-equation difference
is only marginally significant (chi-square stat = 2.55; p-value = 0.11).
24
24
[Table 6 here]
For all fair value classifications, F-tests reveal that the sums of stand-alone coefficients and
interaction terms (e.g., FVOA_PS + FVOA_PS*High_Info) are not significantly different from 1.
Therefore, in a strong firm-specific information environment, fair values are value relevant
regardless of categorization or institutional environment.25 Moreover, the results suggest that the
lower value relevance of FVO assets in bank-based economies might be partially explained by a
weaker country-level information environment, in turn limiting investors’ ability to properly
process reported fair values of FVO assets.
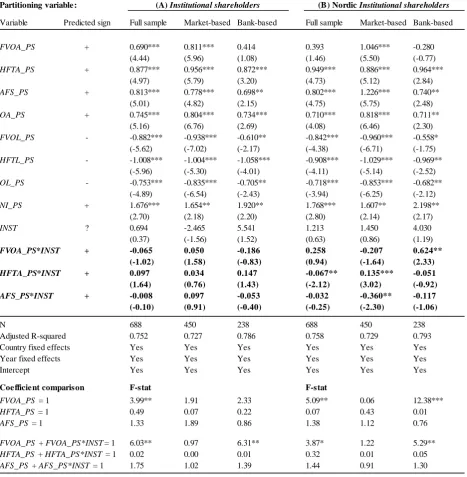
5.3 Institutional investors
The regression results in Column A of Table 7 show that none of the interaction terms
between above median institutional ownership INST and the fair value asset categories are
significantly different from 0. Therefore, the mere presence of institutional investors might not
be sufficient for FVO assets to be value relevant in bank-based economies. This finding suggests
that even sophisticated investors might lack experience with the FVO.
[Table 7 here]
25
Column B of Table 7 reveals that the interaction term between INST_Nordic and FVOA_PS of
0.624 is significantly positive (t-stat = 2.29) in bank-based economies. This result is consistent
with institutional investors from Nordic countries having more experience with fair values,
resulting in a higher value relevance of FVO assets in bank-based economies.26
Taken together, the results on the effect of institutional shareholders on the value relevance of
fair values confirm our main findings that FVO assets are less value relevant in bank-based
economies. In addition, the findings lend some support to the interpretation that lack of
experience with fair values partly explains the discount of the FVO in bank-based economies.
6 Further analyses and robustness checks
6.1 The role of fair value measurement inputs
Our dichotomous classification of countries as market- and bank-based may not only tackle
differences in information environment and fair value experience, but also capture differences in
enforcement and the quality of legal institutions. To mitigate the concern that our findings might
be attributable to systematically higher measurement error (or bias) of FVO assets in bank-based
economies, we first test whether valuation inputs (i.e., Levels 1, 2, and 3) differ across fair value
categories and institutional environments. Second, we rerun regression Equation (1) holding fair
value measurement constant. We focus on Level 1 inputs because measurement error is
26
presumably lowest for fair values that are marked-to-market (Song et al. 2010, Goh et al.
2015).27
[Table 8 here]
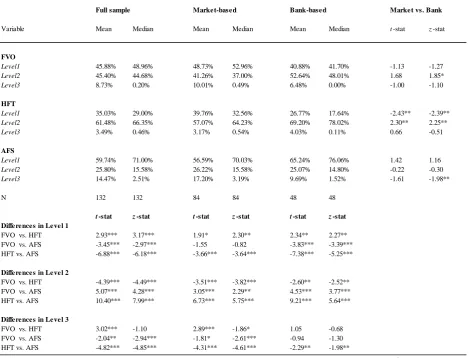
Panel A of Table 8 shows mean and median proportions of Level 1, 2, and 3 fair value
measurement inputs across fair value categories and institutional environments.28 The univariate
comparisons do not indicate that FVO assets are measured based on systematically lower quality
inputs than HFT and AFS assets. On one hand, the mean proportion of Level 3 inputs for FVO
assets of 8.7% is higher (lower) than the mean for HFT (AFS) assets of 3.5% (14.5%) percent.
On the other hand, the mean proportion of Level 1 inputs for FVO assets of 45.9% is also higher
(lower) than the mean for HFT (AFS) assets of 35.0% (59.7%).
Importantly, the proportion of Level 3 inputs for FVO assets is not higher in bank-based
(mean = 6.5%, median = 0.0%) than in market-based economies (mean = 10.0%, median =
0.5%). However, the proportion of Level 2 inputs is significantly higher in bank-based (mean =
52.6%, median = 48.0%) than in market-based economies (mean = 41.3%, median = 37.0%). To
27
Our tests implicitly assume that the definition of Level 1 does not systematically vary across institutions. For example, if the definition of “active market” is less strict in bank-based than in market-based economies, Level 1 fair values in bank-based economies contain generally more measurement error. However, because Level 1d is defined as unadjusted market prices, measurement error or bias should be minimal. We also run robustness analyses focusing on asset types for which the definition is unlikely to vary across institutions (e.g., debt securities vs. equity securities). Inferences from the asset type regressions confirm our findings.
27
the extent that investors discount Level 2 fair values (e.g., Goh et al. 2015), this univariate
finding might partly explain the valuation discount on FVO assets in bank-based economies.
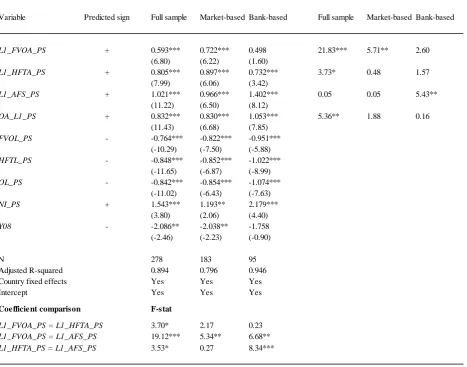
The multivariate results in Panel B of Table 8 are largely consistent with our main findings.
Specifically, while the coefficient L1_FVO_PS of 0.722 is significant (t-stat = 6.22) in
market-based economies, the coefficient L1_FVO_PS of 0.498 is only marginally significant (t-stat =
1.60) in bank-based economies. Moreover, in bank-based economies, the value relevance of
Level 1 FVO assets is lower than that of Level 1 HFT and AFS assets (F-stat = 6.75 and 8.43,
respectively). However, the cross-equation difference in FVO coefficients is not statistically
significant (chi-square stat = 0.63; p-value = 0.43), possibly due to low statistical power.
Therefore, we additionally conduct pooled sample regressions using interaction terms. The
untabulated interaction term between L1_FVO_PS and Financial_Structure (equal to 1 for
market-based economies) of 0.519 is positive and statistically significant (t-stat = 2.43),
indicating that FVO assets are more value relevant in market-based than in bank-based
economies, despite fair values being marked-to-market.
Taken together, the descriptive and multivariate results both suggest that differences in fair
value measurement contribute to variation in the value relevance of fair values, but these
findings do not entirely explain the lower value relevance of FVO assets in bank-based
economies.
6.2 The quality of fair values
Next, we test whether the quality of reported fair values of FVO assets differs between the
two institutional regimes. We refer to fair value quality as the ability of fair values to reflect the
28
the IFRS framework define an accounting amount as relevant if it helps investors to assess the
amounts, timing, and uncertainty of future cash flows. To test the ability of fair values to reflect
the cash flow and risk characteristics of the underlying FVO assets, we follow Altamuro and
Zhang (2013) and estimate the following regression:
FVO_TAit= β0 + β1FVO_INCit + β2Persistenti + β3FVO_INCit * Persistenti + β4Sizeit + εit (3)
FVO_TA is FVO assets scaled by total assets. FVO_INC is the sum of interest income,
dividend income, and disposal gains or losses of FVO assets, scaled by total assets. Persistent
equals 1 for banks with the highest FVO income persistence, measured as the highest quartile
rank of the estimated β1 coefficient from the regression FVO_INCit+1 = β0 + β1FVO_INCit +
β2Sizeit + εit, and 0 otherwise. Persistent serves as a summary measure of the risk characteristics
of the income associated with the FVO portfolio. Size is the natural logarithm of total assets.
As fair values reflect the present value of future expected cash flows, β1 in Equation 3
measures the valuation multiple of the income from FVO assets. Moreover, if the measurement
of fair values is high quality, fair values should reflect the risk characteristics, i.e., the variation
in the persistence of underlying cash flows. Thus we expect banks with more persistent FVO
income (i.e., Persistent = 1) to have higher valuation multiples (i.e., β3 > 0). We estimate
Equation (3) separately for market- and bank-based economies, and test whether the coefficient
β3 is positive and different across the two subsamples.
29
Table 9 shows that fair value multiples are higher for more persistent FVO income in both
market- and bank-based regimes, as suggested by the significantly positive β3 coefficient. The
cross-equation difference between the market- and bank-based β3 coefficient is not statistically
significant (chi-square stat = 0.33; p value = 0.57).29 Therefore, the ability of FVO fair values to
reflect the persistence or riskiness of underlying cash flows does not appear to differ between
market- and bank-based economies, mitigating the concern that our primary findings are driven
by the lower quality of FVO fair values in bank-based economies.
6.3 Asset type composition
In addition to our tests on the role of fair value measurement inputs, we investigate whether
and how different asset type composition across classification categories affects our findings. We
hand-collect data on different asset types (i.e., debt securities, equity securities, hybrid financial
instruments, loans and receivables, and investment funds) by fair value categories. Untabulated
descriptive statistics reveal that debt securities represent the largest proportion of fair valued
assets, with mean (median) proportions for FVO, HFT, and AFS of 52.6% (51.8%), 33.4%
(29.3%), and 67.4% (85.5%), respectively.
We rerun our primary multivariate analysis by holding the asset type (i.e., debt securities)
constant.30 Untabulated findings show that the coefficient on FVO debt securities is insignificant
29
However, this test might lack statistical power. We also run a pooled regression with a three-way interaction term between FVO_INC, Persistent, and Bank_Based to examine whether the ability of fair values to reflect the persistence of underlying cash flows is different across institutional regimes. Our untabulated results show that this interaction term is positive, but statistically insignificant. In addition, untabulated findings do not indicate a statistical difference in the persistence of income from FVO assets between market- and bank-based economies. 30
30
only in bank-based economies, while all other coefficients are statistically significant. However,
as in the additional tests holding measurement input constant, the coefficient of 0.572 for the
FVO in bank-based environments is larger and slightly more significant (t-stat = 1.39) than that
from the main tests in Table 5. These results indicate that differences in asset type might explain
some but not all of the lower value relevance of FVO assets in bank-based economies.
6.4 The influence of the 2008 Financial Crisis
As the 2008 financial crisis falls within our sample period, we test whether solvency or
liquidity issues affect our findings. First, banks with low regulatory capital ratios are more likely
to engage in fire sales of assets to which investors might apply a valuation discount (Laux and
Leuz 2010). Therefore, we test whether our inferences are confounded by low-capitalized
banks.31 The (untabulated) results are largely consistent with the main findings. In particular, low
capitalization has no significant effect on the value relevance of FVO assets, which is lower in
bank-based economies.
Second, we examine whether our findings are confounded by banks’ different exposure to
crisis-sensitive investments. Therefore, we include a binary variable Crisis equal to 1 if a bank
LOAN that equals 1 if the bank applies the FVO to loans (among other asset classes), and 0 otherwise. Untabulated results show that, in market-based economies, the interaction term is significantly negative, indicating that investors perceive FVO assets as less value relevant if also applied to loans. However, in bank-based economies, the coefficient on the interaction term is insignificant, and thus our main inferences are not driven by fair valued loans.
31
has crisis-sensitive investments, and 0 otherwise.32 Across all subsamples, the untabulated
interaction terms between HFTA_PS*Crisis are significantly negative, indicating that investors
apply a discount to trading assets of banks with exposure to crisis-sensitive assets. In bank-based
economies, the coefficient for the interaction term FVOA_PS*Crisis of 0.406 is significantly
positive (t-stat = 2.56). The stand-alone coefficient of 0.230 remains insignificant. A possible
interpretation of this result is that banks disclosing their exposure also have a stronger
information environment. Importantly, the results do not indicate that the lower value relevance
of FVO assets in bank-based economies is driven by different exposure to crisis-sensitive assets.
7 Conclusions
Using a global sample of IFRS banks, we investigate whether the value relevance of the fair
value categories under IAS 39 (i.e., HFT, FVO, and AFS) varies across institutional
environments. We find that FVO assets are generally less value relevant than HFT and AFS
assets. This differential value relevance is particularly pronounced in bank-based economies. A
richer firm-level information environment and the presence of Nordic institutional investors with
fair value experience significantly improve the value relevance of FVO assets in bank-based
economies. Therefore, we attribute our findings to institutional frictions (i.e., weak information
environment and little experience with fair values) limiting investors’ ability to properly process
fair value information.
We run several additional analyses to exclude the alternative explanations that differences in
value relevance are driven merely by differences in fair value measurement inputs or fair value
32
quality. Our tests—holding fair value measurement or asset type constant—confirm our main
finding that FVO assets are less value relevant than HFT and AFS assets in bank-based
economies. In addition, we find no evidence that the ability of fair values to reflect the
persistence of underlying cash flows differs across market- and bank-based economies.
We acknowledge that the paper is limited by its sample size, particularly given the
multicollinearity inherent in empirical value relevance models, the relatively low frequency with
which banks’ choose the FVO for financial assets, and the loss of observations in some of the
additional analyses. Moreover, as the sample period closely overlaps with the 2008 financial
crisis, the findings might not generalize to other periods.
Despite these limitations, our study extends the literature by providing evidence that factors
other than fair value measurement issues play a significant role in determining value relevance of
fair values. Our findings suggest that international variation in investors’ ability to process fair
33
References
Ahmed, A. S., E. Kilic, and G. J. Lobo. 2006. Does recognition versus disclosure matter? Evidence from value-relevance of banks’ recognized and disclosed derivative financial
instruments. The Accounting Review 81 (3): 567–588.
Ali, A., and L-S. Hwang. 2000. Country-specific factors related to financial reporting and the
value relevance of accounting data. Journal of Accounting Research 38 (1): 1–21.
Altamuro, J., and H. Zhang. 2013. The financial reporting of fair value based on managerial
inputs versus market inputs: evidence from mortgage servicing rights. Review of Accounting
Studies 18: 833–858.
Ball, R., X. Li, and L. Shivakumar. 2015. Contractibility and Transparency of Financial Statement Information Prepared Under IFRS: Evidence from Debt Contracts Around IFRS
Adoption. Journal of Accounting Resesarch 53 (5): 915–963.
–––––, S. P. Kothari, and A. Robin. 2000. The effect of international institutional factors on
properties of accounting earnings. Journal of Accounting and Economics 29 (1): 1–51.
Balsam S., E. Bartov, and C. Marquardt. 2000. Accruals Management, Investor Sophistication,
and Equity Valuation: Evidence from 10-Q Filings. Journal of Accounting Resesarch 40 (4):
987–1012.
Barth, M. E. 1994. Fair value accounting: Evidence from investment securities and the market
valuation of banks. The Accounting Review 69 (1): 1–25.
–––––, W. H. Beaver, and W. R. Landsman. 1996. Value-relevance of banks’ fair value
disclosures under FAS No. 107. The Accounting Review 71 (4): 513–537.
–––––, W. H. Beaver, and W. R. Landsman. 2001. The relevance of the value relevance
literature for accounting standardsetting: Another view. Journal of Accounting and
Economics 31 (1–3): 77–104.
–––––, and G. Clinch. 2009. Scale effects in capital markets-based accounting research. Journal
of Business Finance & Accounting 36 (3–4): 253–288.
–––––, W. R. Landsman, D. Young, and Z. Zhuang. 2014. Relevance of differences between net
income based on IFRS and domestic standards for European firms. Journal of Business
Finance and Accounting 43(3): 297-327.
Bartov, E., S. Radhakrishnan, and I. Krinsky. 2000. Investor Sophistication and Patterns in Stock
34
Basel Committee on Banking Supervision (BCBS). 2006a. Supervisory guidance on the use of the fair value option for financial instruments by banks, June 2006.
–––––. 2006b. Basel II: International convergence of capital measurement and capital standards: A revised framework, Comprehensive version, June 2006.
Beck, T., and R. Levine. 2002. Industry growth and capital allocation: Does having a market- or
bank-based system matter? Journal of Financial Economics 64: 147–180.
Belsley, D. A., E. Kuh, and R. E. Welsch. 1980. Regression Diagnostics: Identifying Influential
Data and Sources of Collinearity. New York: John Wiley & Sons, Inc.
Bernard, V. and K. Schipper (1994). Recognition and Disclosure in Financial Reporting. Working Paper, University of Michigan and University of Chicago.
Bernard, V. L., R. C. Merton, and K. C. Palepu. 1995. Mark-to-market accounting for banks and
thrifts: Lessons from the Danish experience. Journal of Accounting Research 33 (1): 1–32.
Bischof, J. 2009. The effect of IFRS 7 adoption on bank disclosure in Europe. Accounting in
Europe 6 (1-2): 167–194.
–––––, H. Daske, and C. Sextroh. 2014. Fair value-related information in analysts’ decision
processes: evidence from the Financial Crisis. Journal of Business Finance and Accounting
41(3): 363-400.
Bushman, R. M., Piotroski, and A. J. Smith. 2004. What determines corporate transparency?
Journal of Accounting Research 42 (2): 207-252.
Chambers, D., T. J. Linsmeier, C. Shakespeare, and T. Sougiannis. 2007. An evaluation of SFAS
No. 130 comprehensive disclosures. Review of Accounting Studies 12 (4): 557-593.
Chang, Y-L., C-C. Liu, and S. G. Ryan. 2011. Why banks’ elected SFAS 159's fair value option: Opportunism versus compliance with the standard's intent. Working Paper, National Taiwan University.
Collins, D. W., G. Gong, and P. Hribar. 2003. Investor sophistication and the mispricing of
accruals. Review of Accounting Studies 8 (2-3): 251-276.
DeFond, M. L., M. Hung, S. Li, and Y. Li. 2015. Does mandatory IFRS adoption affect crash
risk? The Accounting Review 90 (1): 265-299.
De George, E. T., X. Li, and L. Shivakumar. 2016. A review of the IFRS adoption literature.
35
Dong, M., S. Ryan, and X-J. Zhang. 2014. Preserving amortized costs within a fair-value accounting framework: reclassification of gains and losses on available-for-sale securities
upon realization. Review of Accounting Studies, Vol. 19, Issue 1, pp. 240-282.
Eccher, E. A., K. Ramesh, and S. R. Thiagarajan. 1996. Fair value disclosures by bank holding
companies. Journal of Accounting and Economics 22 (1–3): 79–117.
European Central Bank (ECB). 2004. Fair value accounting and financial stability. Occasional
Paper Series (13): 3–48.
European Securities and Markets Authority (ESMA). 2010. Activity Report on IFRS Enforcement in 2010.
Evans, M. E., L. Hodder, P. E. Hopkins. 2014. The predictive ability of fair values for future financial performance of commercial banks and the relation of predictive ability to banks’
share price. Contemporary Accounting Research 31 (1): 13-44.
Financial Accounting Standards Board (FASB). 1993. Accounting for Certain Investments in
Debt and Equity Securities, Statement of Financial Accounting Standards No. 115, Norwalk, CT: FASB.
Financial Accounting Standards Board (FASB). 2007. Fair Value Option for Financial Assets
and Financial Liabilities, Statement of Financial Accounting Standards No. 159. Norwalk, CT: FASB.
Fiechter, P. 2011. The effects of the fair value option under IAS 39 on the volatility of bank
earnings. Journal of International Accounting Research, 10 (1): 85–108.
Financial Stability Forum. 2008. Report of the Financial Stability Forum on enhancing market and institutional resilience, April 2008.
Fox, J. 1991. Regression Diagnostics. Newbury Park, CA: Sage.
Gjerde, O., K. Knivsla, and F. Saettem. 2011. The value relevance of financial reporting in
Norway 1965-2004. Scandinavian Journal of Management, 27 (1): 113–128.
Goh, B., D. Li, J. Ng, and K. Yong. 2015. Market pricing of banks’ fair value assets reported
under SFAS 157 since the 2008 financial crisis. Journal of Accounting and Public Policy, 34
(2): 129–145.
International Accounting Standards Board (IASB). 2006. Financial Instruments: Recognition
and Measurement. International Accounting Standard 39. London, U.K.: IASB.
–––––. 2007. Financial Instruments: Disclosures. International Financial Reporting Standard 7.