warwick.ac.uk/lib-publications
Original citation:
McClements, K. G., Chapman, Sandra C., Dendy, R. O., Irvine, S. W. A., Marshall, O., Robb,
D., Turnyankiy, M. and Vann, R. G. L. (2017) Particle acceleration during
merging-compression plasma start-up in the Mega Amp Spherical Tokamak. Plasma Physics and
Controlled Fusion, 60 (2). 025013. doi:10.1088/1361-6587/aa98fa
Permanent WRAP URL:
http://wrap.warwick.ac.uk/94038
Copyright and reuse:
The Warwick Research Archive Portal (WRAP) makes this work of researchers of the
University of Warwick available open access under the following conditions.
This article is made available under the Creative Commons Attribution 3.0 (CC BY 3.0) license
and may be reused according to the conditions of the license. For more details see:
http://creativecommons.org/licenses/by/3.0/
A note on versions:
The version presented in WRAP is the published version, or, version of record, and may be
cited as it appears here.
Plasma Physics and Controlled Fusion
PAPER • OPEN ACCESS
Particle acceleration during merging-compression
plasma start-up in the Mega Amp Spherical
Tokamak
To cite this article: K G McClements et al 2018 Plasma Phys. Control. Fusion 60 025013
View the article online for updates and enhancements.
Related content
Energetic particles in spherical tokamak plasmas
K G McClements and E D Fredrickson
-Energetic particles in laboratory, space and astrophysical plasmas
K G McClements and M R Turnyanskiy
-Energetic particle physics in fusion research in preparation for burning plasma experiments
-Particle acceleration during
merging-compression plasma start-up in the Mega
Amp Spherical Tokamak
K G McClements
1, J O Allen
2, S C Chapman
3, R O Dendy
1,3,
S W A Irvine
3, O Marshall
2, D Robb
4, M Turnyanskiy
1and R G L Vann
21
CCFE, Culham Science Centre, Abingdon, Oxfordshire OX14 3DB, United Kingdom
2
York Plasma Institute, Department of Physics, University of York, Heslington, York YO10 5DD, United Kingdom
3
Centre for Fusion, Space and Astrophysics, Department of Physics, University of Warwick, Coventry CV4 7AL, United Kingdom
4
Department of Physics and Astronomy, University of Glasgow, Glasgow G12 8QQ, United Kingdom E-mail:[email protected]
Received 13 September 2017, revised 30 October 2017 Accepted for publication 8 November 2017
Published 20 December 2017
Abstract
Magnetic reconnection occurred during merging-compression plasma start-up in the Mega Amp Spherical Tokamak(MAST), resulting in the prompt acceleration of substantial numbers of ions and electrons to highly suprathermal energies. Acceleratedfield-aligned ions(deuterons and protons) were detected using a neutral particle analyser at energies up to about 20 keV during merging in early MAST pulses, while nonthermal electrons have been detected indirectly in more recent pulses through microwave bursts. However no increase in soft x-ray emission was observed until later in the merging phase, by which time strong electron heating had been detected through Thomson scattering measurements. A test-particle codeCUEBITis used to model ion acceleration in the presence of an inductive toroidal electricfield with a prescribed spatial profile and temporal evolution based on Hall-MHD simulations of the merging process. The simulations yield particle distributions with properties similar to those observed experimentally, including strongfield alignment of the fast ions and the acceleration of protons to higher energies than deuterons. Particle-in-cell modelling of a plasma containing a dilutefield-aligned suprathermal electron component suggests that at least some of the microwave bursts can be attributed to the anomalous Doppler instability driven by anisotropic fast electrons, which do not produce measurable enhancements in soft x-ray emission either because they are insufficiently energetic or because the nonthermal bremsstrahlung emissivity during this phase of the pulse is below the detection threshold. There is no evidence of runaway electron acceleration during merging, possibly due to the presence of three-dimensionalfield perturbations.
Keywords: spherical tokamak, particle acceleration, microwave emission, plasma startup, magnetic reconnection
(Somefigures may appear in colour only in the online journal)
1. Introduction
Toroidal plasmas in the Mega Amp Spherical Tokamak (MAST)were routinely started by forcing two separate plasma tori to merge in the vessel midplane, causing magnetic recon-nection to occur[1]. MAST was equipped with a wide range of excellent diagnostics, and therefore this start-up scheme
Plasma Physics and Controlled Fusion
Plasma Phys. Control. Fusion60(2018)025013(11pp) https://doi.org/10.1088/1361-6587/aa98fa
Original content from this work may be used under the terms of the Creative Commons Attribution 3.0 licence. Any further distribution of this work must maintain attribution to the author(s)and the title of the work, journal citation and DOI.
provided a valuable opportunity to study experimentally the physics of magnetic reconnection in the high energy density conditions of a tokamak plasma, but without some of the complications of other types of tokamak reconnection events, such as sawteeth. In particular, to a good approximation, reconnection during merging in MAST can be regarded as an axisymmetric (two-dimensional) process, greatly facilitating both the interpretation of experimental data and the modelling of these data. Tanabe and co-workers [1] have used Thomson scattering and carbon line radiation measurements to produce two-dimensional maps of electron and ion heating during mer-ging, demonstrating that electrons were heated initially at the merging point of the two original tori, while ion heating was attributed to viscous dissipation of outflows arising from the reconnection process. Later, electrons were heated in the outflow regions and ions at the merging point, due to electron–ion col-lisional equilibration. Higher electron and ion temperatures were recorded at the merging point when the toroidal component of the magneticfield was increased, as expected from Braginskii-type scaling of cross-field collisional transport[2]. Axisymmetric magnetohydrodynamic (MHD) and Hall-MHD modelling of merging-reconnection in MAST has produced results that are broadly consistent with experimental measurements, and pro-vided useful information on the likely evolution of the magnetic field during this process[3].
In this paper we focus on another common consequence of magnetic reconnection in weakly collisional plasmas, the gen-eration of suprathermal particles. This study is motivated in part by the fact that particle acceleration has previously been found to be correlated with other types of reconnection events in MAST
[4]. The production of energetic particles in tokamak plasmas through processes other than fusion reactions, neutral beam injection or radio-frequency heating is generally considered to be undesirable, since the presence of these particles is liable to cause non-classical losses of energy from the plasma or damage to plasma-facing solid surfaces, and for this reason it is important to understand their origin. A second motivation arises from the fact that the dimensionless parameters of plasmas during merging in MAST are similar to those in the flaring solar corona [5, 6], where it is well-established that reconnection causes the pro-duction of large numbers of nonthermal electrons and ions, detected primarily via hard x-ray andγ-ray emission[7–9]. On this basis it is reasonable to suppose that useful insights into the physics of particle acceleration in flares might be gained by studying this process in MAST, where measurements can be carried out in close proximity to the plasma rather than at a distance of 150 million km.
Experimental studies of reconnection have been carried out in several laboratory devices, focussed largely on the reconfi -guration of the magneticfield, bulk plasma flows and plasma heating. It appears that there have been few investigations of particle acceleration in these devices. In one such study, aniso-tropic suprathermal electron tails were detected in the vicinity of a neutral sheet formed in a collisionless linear plasma[10], and bulk ion acceleration to trans-Alfvénic velocities has been observed in merging spheromak experiments [11, 12]. In the present paper we report experimental measurements showing the simultaneous acceleration of electrons and ions during
reconnection in spherical tokamak plasmas. The magneticfields in these plasmas are typically much higher than those used in dedicated reconnection experiments, and the free energy poten-tially available for particle energisation is correspondingly higher. Neutral particle analyser(NPA)measurements of fast ion production during merging in MAST werefirst reported in[5]. In section 2 we present further details of these NPA mea-surements, and also report on observations of microwave bursts which provide strong evidence of nonthermal electron pro-duction during merging. Modelling of ion acceleration, based on an analytically-prescribed time-varying magnetic flux, is presented in section 3, while results from a particle-in-cell (PIC)simulation of a plasma containing anisotropic fast elec-trons are used in section 4 to interpret the microwave burst measurements. Conclusions and a discussion of the possible role of three-dimensional effects are presented in section5.
2. Merging-compression plasma start-up in MAST
Detailed descriptions of merging-compression plasma start-up in MAST can be found in[1,3,13–16]. In summary, as shown in figure1, plasma rings with parallel toroidal currents were formed around coils located above and below the vessel midplane, subsequently detaching and merging in the midplane due to their mutual attraction. A change of magneticfield line topology(i.e. reconnection)from two tori to a single torus with nested magn-etic surfaces typically occurred around 4–5 ms after the start of the pulse. In the two subsections below we describe NPA and microwave measurements obtained during this merging process.
2.1. NPA measurements of fast ions
[image:4.595.307.550.60.291.2]The MAST NPA measuredfluxes of deuterium and hydrogen atoms resulting from charge exchange between plasma ions
Figure 1.Cartoon of merging-compression formation in MAST, with
and neutrals, with 39 energy channels for each species[17]. As shown infigure2, the NPA line-of-sight could be changed from pulse to pulse such that its minimum major radiusRNPA (i.e. the major radius at which the line-of-sight was tangential to the toroidal direction)ranged from about1.33 mfor views in the clockwise direction (as seen from above) to about 0.46 mfor views in the anti-clockwise direction; in the latter case, we assign a negative value to RNPA. In normal MAST
operation the plasma current was anti-clockwise while the toroidalfield was clockwise, and therefore fast ions moving in the co-current direction could be detected as neutrals by the NPA ifRNPAwas positive and equal to the major radius of the
ion when it was neutralised(the ion velocity being essentially unaffected by the charge exchange process).
Asfirst reported in[5], bursts of fast deuterons and protons were recorded across a wide range of energies by the NPA during the merging phase of MAST pulses, prior to the start of neutral beam injection. The dominant ion species in these plasmas was deuterium, but some hydrogen was also present, together with heavier impurity species. Figure3 shows particle energy spectra obtained in a pulse withRNPA set to its default
value of0.7 m. These were obtained by integrating the NPA fluxes over a period from 3 to 9 ms into the pulse, covering the entire merging phase. The energy-dependence of the charge exchange cross-section was taken into account, and therefore the spectra provide a true measure of the ion energy distributions (rather than the distributions of charge-exchanged neutrals). Thus, a Maxwellian ion distribution would appear as a straight
[image:5.595.110.477.68.356.2]line in a log-linear plot of the type shown infigure3. In common with the spectra shown in[5], it can be seen that protons were recorded at somewhat greater maximum energies (∼18 keV) than deuterons (∼13 keV). Counts were recorded in higher energy channels of the NPA for both species, but at rates that were so low that they could not be distinguished clearly from expected noise levels for this diagnostic. There was also a deficit of protons in the lowest energy channel for this species, 5.2 keV.
Figure 2.Layout of the MAST NPA system and neutral beams, as seen from above. The black lines indicate the possible NPA lines-of-sight:
RNPAis the shortest distance between one of these lines and the centre of the torus. The NPA had a single line-of-sight, and so only one of the
chords shown in thefigure could be used in any given pulse. Note that the neutral beams were not used during the merging-compression phase of MAST pulses.
Figure 3.Deuterium(red)and hydrogen(blue)energy spectra recorded by the MAST NPA during the merging phase of pulse 9153.
3
[image:5.595.307.547.417.603.2]The apparent absence of protons at energies below 5.2 keV is an artefact arising from the low-energy cutoff for ions of this spe-cies in the NPA. The low-energy cutoff for the deuterium NPA channels, on the other hand, was about 2.6 keV in this pulse. The minimum energy in figure 3 coincides with low-energy deuterium cutoff, and so every point in the red curve provides a reliable measurement of the deuterium ion distribution at that energy.
It is important to note that the fall-off in the deuterium spectrum at energies above 4 keV cannot be attributed to the finite temperature of the bulk deuterium population. Thomson scattering measurements show that the electron temperature
Teat the end of the merging phase in this pulse peaked at less than 200 eV, and direct measurements of ion temperature during the merging phases of more recent MAST pulses have yielded similar values[1]. In contrast, the deuterium spectrum in the energy range from 4 to 13 keV infigure3corresponds to an equivalent temperature of about 2.9 keV, which is considerably higher than the peak bulk ion temperatures measured during the flat-top phase of MAST plasmas with strong neutral beam heating(see e.g. figure 4 in [18]). It is thus clear that both the deuterium and hydrogen spectra shown in figure 3 were produced predominantly by supra-thermal ions. However,fitting a straight line to the two lowest energy deuterium points in this figure, we obtain a temper-ature of about 200 eV, which is a realistic value for the bulk ion population during this phase of a MAST pulse.
In the case of the spectra shown in figure 3 RNPA was
comparable to major radii at which strong, localised electron heating was observed during merging[1], and it is reasonable to identify these locations with current sheets formed by the merging plasma rings, since strong Ohmic heating of the electrons is expected to occur there[3]. The magneticfield in MAST, as in all tokamaks, was predominantly toroidal. Thus, if we make the reasonable assumption that the fast ions recorded by the NPA during merging reconnection originated from the current sheet region, where large parallel electric fields would be expected to occur, it follows that RNPA can
be regarded as a proxy for the fast ion pitch angle, with RNPA=0.7 m corresponding to pitch angles close to zero, RNPA=0 m to pitch angles close to 90°, and RNPA<0 to
pitch angles greater than 90°. By comparing NPA measure-ments in similar shots with differentRNPAit is thus possible to
obtain information on the fast ion pitch angle distributions. Figure 4 shows the temporal evolution of the NPA flux in one particular hydogen channel (16 keV) for shots with RNPA=0.7 m (black curve, pulse 9153) and -0.46 m (red curve, pulse 9161). The peakflux is much higher in the former case than the latter, suggesting that the fast ion distribution is strongly aligned with the magneticfield. Particlefluxes in this channel similar to those of pulse 9161 were recorded in pulses with RNPA=0 and 0.46 m, while no neutrals were detected during the merging phases of pulses with RNPA=1.23 and 1.33 m. These null results clearly indicate that none of the fast ions were located at major radii lying far outboard of the merging point. Similar results were obtained for other hydro-gen channels of the NPA, and for deuterium channels.
The effective temperatures of the bulk deuterons (Ti=200 eV) and fast deuterons (Tf =2.9 keV) inferred
from figure 3 can be combined with the absolute neutral particlefluxes to yield a rough estimate of the accelerated ion fractionnf ni. Neglecting the anisotropy of the fast ions, and
assuming that they have energies restricted to the range E1=4 keVtoE2=13 keV, it is straightforward to show that
n
n
F
F T
T x x
2
3 2, 3 2, , 1
f
i
f
i f
i 3 2
1 2
p
= ⎛ G - G
⎝ ⎜ ⎞
⎠
⎟ [ ( ) ( )] ( )
where
x y y
3 2, e d , 2
x
y 1 2
ò
G( )= ¥ - ( )
is an incomplete gamma function, x1=(E T1 f)1 2, x2=(E T2 f)1 2, andF Fi, f are the absolute values of the bulk
and fast deuterium distributions extrapolated to zero energy. Evaluating the expression on the right hand side of equation (1) using the numerical values given above com-bined with estimates of Fiand Ffinferred fromfigure3, we obtain nf ni10-4, indicating that fast deuterons con-stituted only a small fraction of the total deuterium population in this pulse. We have only limited information on the anisotropy of the fast ion population (seefigure 4), but this information suggests that equation (1)slightly overestimates the accelerated ion fraction in the case of the spectra shown in fiigure 2, since RNPA in this pulse was close to the optimal
value for detecting zero pitch angle fast ions in the vicinity of the merging point. A somewhat higher accelerated ion frac-tion, of the order of 1%, was found for a different MAST pulse in[5]. It should be noted that all such estimates are very approximate, but it is clear in all of the pulses studies that the accelerated ion fraction was much smaller than unity.
2.2. Microwave bursts
[image:6.595.307.549.64.251.2]In the most recent MAST campaigns a microwave diagnostic known as Synthetic Aperture Microwave Imaging (SAMI)
Figure 4.Neutral particlefluxes of 16 keV protons versus time in MAST pulses 9153 withRNPA=0.7 m (black)and 9161 with
[19] was used to detect emission in the electron cyclotron frequency range (10–35 GHz). SAMI detects emission in fifteen different frequency channels sequentially, with8 sm of data acquisition per channel and a total sweep time over all channels of 150μs. Short-lived bursts of emission were detected using this instrument in many pulses during the merging phase, most frequently at about the same time in each pulse(t4 5 ms– )as fast ions were observed using the NPA in early MAST campaigns: an example is shown in figure 5. In this case the microwave intensity at the peak emission frequency, averaged over the150 sm sweep time, was about 14 dB above the background (thermal)level, but instantaneous intensities of up to about 30 dB above the background were recorded in one of the SAMI channels. As shown in figure 5, the bursts are narrow-band, in this case peaking at a frequency of around 28 GHz. In this particular burst supra-thermal emission occurred in only three channels and was recorded in only one frequency sweep, which means that the burst duration could have been as short as 27μs. Thomson scattering measurements in this pulse show that the electron temperature profile immediately after the merging phase peaked at a major radius R of about 0.5 m. At this location the toroidal magneticfield was about 0.82 T, so that the local electron cyclotron frequencyncewas about 23 GHz.
The electron density atR=0.5 m just before the burst was about 2.5´1018m-3, corresponding to an upper hybrid
frequency nUHº(nce2 +n2pe)1 227 GHz (npe being the
electron plasma frequency), which is close to the burst frequency.
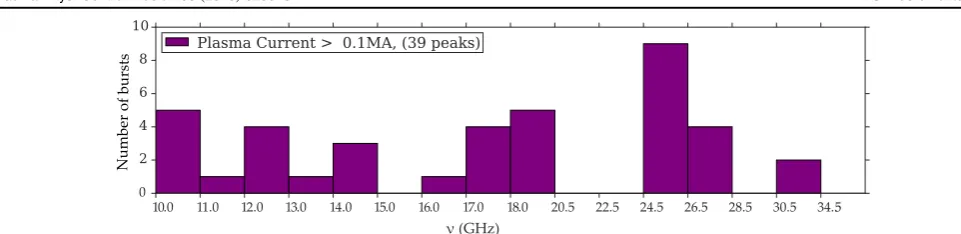
A range of microwave burst frequencies is observed in different pulses. Figure6shows the frequency distribution of bursts with microwave intensity enhancements of at least 15 dB above the noise. The most common burst frequency is 24.5 GHz, but it can be seen that the distribution extends across almost the entire SAMI range (10–34.5 GHz). These pulses all had similar toroidalfield values, and hence similar values ofnce at a given major radius.
The high intensities and narrow bandwidths of these bursts strongly suggest the presence of suprathermal electrons in the plasma during the initial stages of the merging phase, but no clear evidence has yet been found for such electrons in either soft x-ray or Thomson scattering data. The soft x-ray cameras in MAST could detect photons with energies in the
approximate range 1–30 keV, which means that electrons with energies above about 1 keV could in principle have been detected via bremsstrahlung, since for this process the energy of the emitted photon can be as high as that of the electron producing it. Enhancements in soft x-ray emission from about t8 ms onwards have been detected during some pulses in channels with lines-of-sight passing close to the plasma centre, but it is clear that these occurred due to bulk electron heating rather than electron acceleration, since strong electron heating at the merging point was observed in Thomson scattering profiles. With this point in mind, we will consider a possible interpretation of the microwave bursts in section4.
3. Modelling of ion acceleration
3.1. Electric and magnetic fields
It was not possible to measure directly the electric or recon-necting magneticfields in MAST during merging plasma start-up. However, as noted in section1, a series offluid simulations of this process, employing both MHD and Hall-MHD models
[3], have provided useful insights into the likely evolution of thefields. All of these simulations were toroidally symmetric. In the more realistic Hall-MHD simulations, it was found that parallel electricfields of up to about10kV m−1, persisting for about 1μs, were produced at the point where the plasma rings merged. In some of these simulations, magnetic islands were observed to form in the vicinity of the merging point(seefigure 7 of[3]).
In order to model particle acceleration resulting from this reconnection process, it is convenient to construct an analy-tical representation of the poloidalflux ψ, defined here such that the poloidal magneticfield Bqis equal to ´ y j j, being toroidal angle in right-handed (R,j,Z) cylindical coordinates. The key feature of reconnection which needs to be encapsulated here is the generation of an inductive electric field from the annihilation of magnetic flux in the region where the plasma rings merge. A simple way of doing this is to use a time-dependentflux of the form
R Z t R R
R
Z Z
, , e t exp , 3
0 0 2 2 2 2 2 2 y y d d
= - t ⎡- - -⎣⎢
⎤ ⎦⎥
( ) ( ) ( )
wherey t0, ,R0,dRanddZare constants whose valuesfix the magnitude, duration and spatial localisation of the reconnec-tion-induced electric field and the associated poloidal magn-etic field. At any given time, ψ is thus assumed to have elliptical contours in the(R Z, )plane, which are suggested by the magnetic islands observed in the Hall-MHD simulations of Stanier and co-workers[3].
The electricfield corresponding to the above expression forψis given by
E R t t R R R R Z Z 1 2
e exp .
4 t 2 0 0 2 2 2 2 2 2 y
t y d d
= - 
¶ =
-j - t ⎡
⎣⎢
⎤ ⎦⎥
( )
[image:7.595.50.293.65.203.2]( )
Figure 5.Dynamic spectrum of microwave emission recorded using SAMI during thefirst 15 ms of MAST pulse 28146.
5
The time dependence in this expression provides an approx-imation to that of the toroidal electric field at the merging point found by Stanier and co-workers(see figure 8 in [3]). Our particle simulations start att=0, at which timeEj=0, and it is thus appropriate to initialise the deuterons or protons with a Maxwellian(i.e. unaccelerated)distribution.
The poloidal magneticfield has components
B R Z Z R Z R R R Z Z 1 2 e exp 5
R 2 0 t
02 2 2 2 2 2 y
d y d d
= - ¶ ¶ = -- -t - ⎡ ⎣⎢ ⎤ ⎦⎥ ( ) ( ) and B R R R R R R R R R Z Z 1 2 e
exp . 6
Z 2 0 0 t
02 2 2 2 2 2 y d y d d = ¶ ¶ = -´ - - -t -⎡ ⎣⎢ ⎤ ⎦⎥ ( ) ( ) ( )
We also need to take into account the toroidalfield, which is modelled using the vacuum expressionBj=B R R0 0 (where B0 is a constant), and is assumed to be unaffected by the
reconnection process.
It should be noted that the global poloidal field in the final, relaxed state of the plasma is not represented in this model. The fast ion orbits will of course be affected by this poloidalfield, but it is not relevant to the acceleration process, which is the focus of our attention here. Once an ion has stopped accelerating, either because Ej has dropped to a negligible level or because the ion has moved outside the acceleration region (due to grad-B, curvature or E´B
drifts), we no longer need to track its orbit accurately. The characteristic timescale of particle motion in the global poloidalfield is the trapped particle bounce timetb, which in
the large aspect ratio limit is given by the expression[20]
qR v R r 2 2 , 7 b 1 2
t = p ^ ⎜ ⎟ ⎛ ⎝ ⎞ ⎠ ( )
whereq ~1is the number of toroidal circuits made by afield line in one poloidal circuit,v⊥is particle speed perpendicular toB, and ris minor radial distance of the particle from the magnetic axis. Taking v⊥ to be the full particle speed and settingq =1,R=0.8 m, r=0.3 m(a mid-radius value for MAST),(7)yields a bounce time of about12 sm for 10 keV deuterons and about7 sm for 15 keV protons(see maximum energies in figure 3). The acceleration timescale (∼1μs) is
significantly shorter than these bounce times, indicating that it is sufficient for our purposes to consider thefields associated with the reconnection process together with the toroidal magnetic field. It should be noted that in any case the acceleration region lies close to the final location of the plasma magnetic axis, where, by definition, the poloidalfield vanishes.
3.2. Test-particle simulations
The acceleration of test deuterons and protons was modelled using a full orbit-following codeCUEBIT[21]for 20μs from
t=0 (when Ej=0) in the fields described above, with 1.5 s
t= m and three different pairs of values ofdRanddZ: (a) 0.1 and 0.02 m; (b) 0.05 and 0.01 m; (c) 0.025 and 0.005 m. The implicit integration scheme used in CUEBIT guaranteed that energy changes could only occur through the action of Ej rather than numerical effects. The parametery0
[image:8.595.52.533.59.176.2]was chosen such that the maximum value of Ej was 13 kV m−1, slightly higher than the maximum electric field observed in the simulations of Stanier and co-workers [3]. The chosen values ofdR anddZ are broadly consistent with the dimensions of the current sheets observed in these simulations and of the regions of strong electron heating measured experimentally by Tanabe and co-workers [1]. However it is appropriate to consider a range of values of these length scales since the detailed structure of the current sheet in the fluid simulations (although not the maximum electricfield)was found to depend on the assumed value of a hyper-resistivity used in the generalised Ohmʼs law (see figure 7 in [3]). In each simulation the orbits of 200 000 particles were tracked, and subsequently binned in energy to generate plots that could be compared directly with NPA energy spectra such as those shown infigure3. We neglect collisional effects, for reasons that are discussed in the appendix. In all cases the deuterons or protons were initialised with an isotropic Maxwellian velocity distribution at a temperature of10eV, which is a typicalfigure for plasmas in MAST prior to merging [1]. In all cases the particles were launched with a uniform spatial distribution within a rectangle in the poloidal(R Z, )plane with radial extent equal to 1.0 m, vertical extent equal to 0.1 m, and centred on the merging point, which was assumed to lie at R=0.8 m, Z=0.0 m. Since thefields are all taken to be axisymmetric, the orbits are not affected by the choice of initial toroidal angle. In the
version ofCUEBITused in this study, time-dependentfields are evaluated in space at the midpoint between the old and new particle positions, and at the new time. We tested this scheme for convergence by halving the timestep used in one of the simulations discussed below, from a twentieth to a fortieth of an ion cyclotron period, and found that this made a negligible difference to the results: the distribution function values differed by no more than about one part in 103across the full range of particle energies.
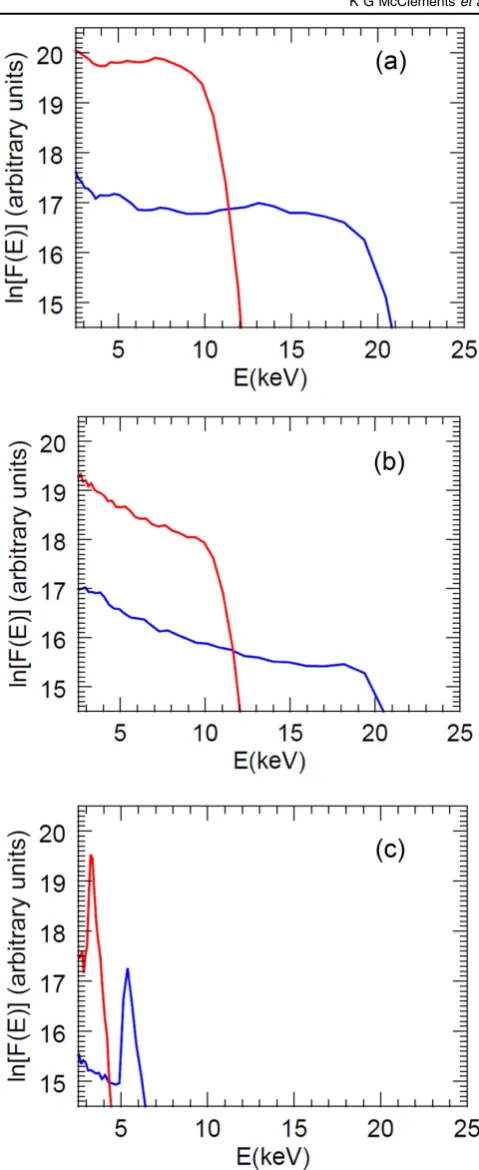
Figure 7 shows the deuterium and hydrogen spectra obtained using the parameters listed above. In all three cases it can be seen that protons are accelerated to higher max-imum energies than deuterons, consistent with the experi-mentally-measured spectra shown infigure3. However only in cases(a)and(b)are the maximum energies close to the measured values; in case(c), with the smallest current sheet, the maximum energies are clearly lower than the measured values. In the other two cases there is no difference in the maximum simulated particle energies, but case(b)seems to capture more of the features of the NPA deuterium data in that the spectrum for this species is less flat at low energy than in case(a), although it is still flatter than the measured spectrum. It is interesting to note that there is a break in the deuterium spectrum at about 10 keV in both the measurements and the synthetic spectra for cases (a)and(b). We conclude that the current sheet parameters that reproduce most accurately the measured spectra aredR=0.05 m,dZ=0.01 m.
Examination of individual particle orbits suggests that ions are accelerated to lower maximum energies in the case of the smallest assumed current sheet (dR=0.025m,
Z 0.005
d = m) mainly because the magnetic field in the region of highEj is then mainly poloidal (since BRand BZ scale inversely withdZ2 and dR2, respectively). This means
that the parallel component of the electricfield is significantly smaller than Ej, and hence less effective at accelerating particles to high energies.
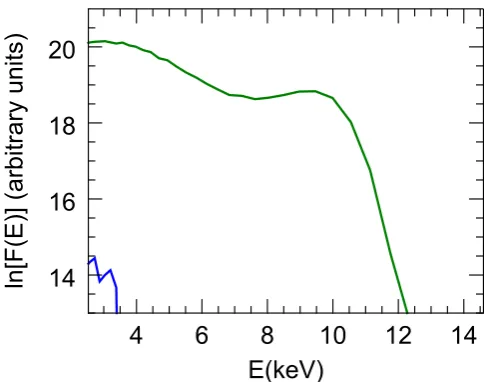
We can also infer fast ion pitch angle distributions from the CUEBIT simulations. Figure 8 shows the computed energy distributions of deuterons with vj v in the range 0.97–1.00 (green curve) and in the range 0.94–0.97 (blue curve) at the end of the simulation with dR=0.1m,
Z 0.02
d = m. In the energy range used here(chosen to pro-vide an exact comparison to the NPA data), a negligible number of ions hadv vj <0.94. For case (b)infigure 7, a negligible number of deuterons with energies within the NPA range hadv vj <0.97. For case(c), the fast deuterium dis-tribution was found to be somewhat more isotropic than in the other two simulations, but, as discussed above, this scenario does not account for the highest particle energies detected using the NPA. In all three simulations, the accelerated deu-terons were found to have pitch distributions that were strongly peaked in the toroidal direction, particularly at high energy. By this stage of the simulations the poloidal field associated with the reconnection process had decayed to a negligible level, and so the toroidal direction coincided with
[image:9.595.306.546.56.642.2]the direction ofB. Since the particles were initially isotropic in all cases, the anisotropy evident in figure 8 is solely a consequence of the acceleration process rather than the choice
Figure 7.Deuterium(red)and hydrogen(blue)energy spectra obtained usingCUEBITwith(a)dR=0.1m,dZ=0.02m,(b)dR=0.05m,
Z 0.01
d = m and(c)dR=0.025m ,dZ=0.005m.
7
of initial conditions. As shown in section 2, the NPA measurements in shots with different RNPA imply strong
field-aligned anisotropy in the fast ions during merging, and theCUEBITsimulations are qualitatively consistent with the experimental data in this respect. Figure4 suggests that the true fast ion anisotropy is less extreme than that indicated by the simulations; this could be due in part to the neglect of the global poloidalfield in the simulations.
The acceleration of protons to energies higher than those of deuterons, as shown infigures3and7, can be understood quantitatively as follows. Neglecting the mirror force arising from spatial variations inB, the parallel equation of motion of a singly-charged ion of massmiis
m v
t eE t d
d , 8
i =
( ) ( )
whereeis the proton charge and E t( )is the parallel comp-onent of E on the ion orbit. When EP is given by (4) and particle motion in the(R Z, )plane is neglected(so thatRand
Z are not functions of time along the trajectory), it is straightforward to integrate(8). For the case of an ion initially at rest and undergoing the maximum acceleration, at R=R0,Z =0, we obtain
v t e
m Ri 9
0
0
y
¥ =
( ) ( )
and hence, neglecting any perpendicular motion (see figure8), afinal kinetic energy of
e
m R
2 i . 10
2 0 2
02
= y ( )
This expression is inversely proportional to mass, indicating the acceleration of protons to twice the energy of deuterons. In the simulations the maximum proton energies are slightly
less than twice the maximum deuteron energies, but the absolute values of these maximum energies are close to those given by (10), which are 24.8 keV for protons and 12.4 keV for deuterons. The assumptions used to derive (10) thus appear to be justified for the highest energy ions, and this expression is consistent with both the simulations and the NPA measurements.
4. Modelling of microwave emission
Microwave bursts similar to those described in section2were detected during the early stages of edge localised modes (ELMs)in MAST, and attributed to the anomalous Doppler instability (ADI), driven by strongly field-aligned energetic electron distributions resulting from parallel electric fields
[22]. However, unlike the bursts observed during merging start-up, those correlated with ELMs were often accompanied by strong enhancements(up to a factor of two or more)in soft x-ray emission, providing clear evidence of energetic elec-trons with energies exceeding the soft x-ray threshold of about1keV. However the non-detection of soft x-ray emis-sion enhancements during the early stages of merging does not necessarily preclude the presence of suprathermal elec-trons at that time, for two reasons. First, the pre-merging electron temperature was about 10 eV, i.e. about two orders of magnitude below the soft x-ray threshold, and therefore a suprathermal electron population with energies in the range 10 eV–1 keV could not have been detected using the soft x-ray diagnostic. Second, the bulk density in the plasma core region was generally about an order of magnitude lower during the merging phase than in theflat-top phase, and the emissivity of nonthermal bremsstrahlung is proportional to the densities of both the nonthermal electrons and the bulk ions which are decelerating them. Typically the soft x-ray signals recorded prior to the merging phase are very noisy, and it is possible that the bremsstrahlung signature of a dilute suprathermal electron population could remain within the noise, even if some of these electrons have energies in excess of the x-ray energy threshold.
With these considerations in mind, we have used a one-dimensional PIC code EPOCH [23]to model an equilibrium plasma containing bulk electrons and ions with temperature 10 eV, density2.5´1018m-3 and a dilute (1%
concentra-tion)magneticfield-aligned electron beam with aflat velocity distribution extending to a maximum energy of 1.6 keV(our reasons for choosing this particular value are explained below). The magnetic field was set equal to 0.82 T, corresp-onding to the toroidal field at the major radius of peak elec-tron heating during the merging phase of MAST pulse 28146 (seefigure 5). Thefield was tilted at an angleαof 65°with respect to the single space direction to accommodate waves withk k, ^¹0.
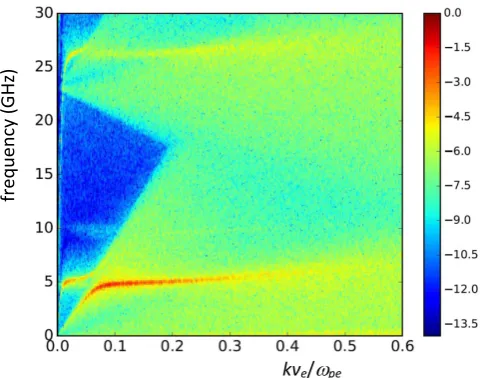
[image:10.595.48.293.65.256.2]Figure9is a logarithmic plot of the longitudinal(i.e. parallel to the wave vector) electric field amplitude in wave number/ frequency space, obtained by Fourier analysing the simulation results corresponding to a period between 832 and 999 electron cyclotron periods after t=0. Wavenumber k is normalised
Figure 8.Energy distributions of deuterons with pitchvj vin the
to wpe ve where wpe=2pnpe is the angular electron plasma
frequency andve=(2T me e)1 2is the electron thermal speed at
the start of the simulation(meis electron mass). The dominant feature in this dispersion plot is a strong mode at about 5 GHz, below the SAMI frequency range; a somewhat weaker mode appears at a frequency of about 26 GHz, close to the peak microwave burst frequency(∼26.5 GHz)in MAST pulse 28146 (seefigure5). Whilefigure9shows the electrostatic component of thefluctuations, lower amplitude excitation is also visible in the electric field component perpendicular to both the wave vector and the magneticfield, indicating that thefluctuations have an electromagnetic component. This is important in terms of diagnostic interpretation, since, in order to be detected by SAMI, a plasma wave mode must either have an electromagnetic component or acquire one through a mode conversion process.
It is instructive to compare the results shown infigure9 with the following expression for the frequencies of electro-static modes in a cold magnetised plasma[24]:
1 2
1
2 4 ce pecos . 11
1,2 2
UH 2
UH
4 2 2 2 1 2
n = n [n - n n a] ( )
Evaluating these frequencies using the equilibrium density and magnetic field of the EPOCH simulation, we obtain
5 1
n GHz,n226 GHz, which match closely the fre-quencies of the two modes apparent infigure9. The higher of these two frequencies is very close to the upper hybrid fre-quencynUH. As in the case of the PIC simulations reported in [22], it appears that these normal modes are being excited due to the anisotropy in the fast electron tail via the anomalous Doppler resonance condition
k v ℓ e 0, 12
w- - W = ( )
whereℓ= -1,wis the angular wave frequency,W =e 2pnce
and k v, denote wavenumber and electron velocity
components parallel to B. At resonance we thus have
k ev. 13
w w
w
= + W
( )
To avoid strong Landau damping on the bulk electron population,w kneeds to be at least several times the electron thermal speed. This constraint, combined with (13), means that there is a minimum suprathermal tail velocity for the ADI to be excited, which determined the choice of maximum electron tail energy (1.6 keV) in the simulation. This max-imum energy is comparable to the low energy threshold of the soft x-ray detectors in MAST(∼1 keV), and, as we noted in section 2, the relatively low densities of MAST plasmas during the early merging phase means that the presence of suprathermal electrons with energies above this threshold cannot in any case be ruled out. On this basis we conclude that the the ADI, excited by anisotropic suprathermal elec-trons, provides a possible explanation of the microwave burst shown in figure5.
As shown in figure 6, the highest intensity microwave bursts during merging in MAST ranged in frequency from 10 to 30.5 GHz(although in individual bursts the emission was generally narrow-band, as shown infigure5). It is not certain that the ADI can account for the full range of measured burst frequencies, although it should be noted that there was some variation in the major radius(which determinednce)at which
peak electron heating occurred during merging, and the electron density at this location (which determinednpe)also
had a range of values. Moreover the frequencies excited by the ADI also depend on the propagation angleαof the wave with respect toB, and it is not possible to determine values of this parameter from the available data. While it is unclear whether all of the microwave bursts detected during merging in MAST can be attributed specifically to the ADI, the high intensities, short durations and narrow bandwidths of these bursts suggest strongly they were all caused by the presence of suprathermal electrons.
5. Conclusions and discussion
[image:11.595.50.291.66.255.2]We have demonstrated that MAST NPA and microwave data provide strong evidence of, respectively, ion and electron acceleration due to magnetic reconnection associated with merging plasma start-up. Ion energy spectra from pulses with different NPA lines-of-sight suggest that the fast ions are strongly aligned with the magnetic field. Modelling of ion acceleration, using axisymmetric fields obtained from an assumed time-varying poloidal flux based on Hall-MHD simulations of the reconnection process, has yielded results that reproduce some of the features of the NPA data, for example the inferred strong field alignment of the fast ion distributions and the result that protons are accelerated to higher energies than deuterons. A PIC simulation of a plasma with a magnetic field-aligned suprathermal electron popula-tion, and bulk parameters approximating those of the merging phase in a particular MAST pulse, shows the excitation of waves via the ADI at a frequency close to that of a high
Figure 9.Logarithmic plot of electrostaticfield amplitude(in arbitrary units)versus dimensionless wave numberkve wpeand
frequency inEPOCHsimulation with bulk plasma parameters characteristic of merging plasmas in MAST and a dilute suprather-mal electron beam.
9
intensity microwave burst detected during this pulse. The ADI thus provides a credible explanation of this particular burst, although the absence of simultaneous enhancements in soft x-ray emission suggests that few of the fast electrons were accelerated to energies higher than about 1 keV.
In reality plasma merging in MAST is likely to have been to some extent a three-dimensional process, and so the ion modelling presented in section 3 could in principle be made more realistic by addingj-dependent terms to the reconnecting flux,ψ. HoweverEj= -(1 R)¶ ¶y twould then also depend on j, and it would thus be necessary to include additional components in the electric field to ensure that it remained divergence free, as required by quasineutrality. It would not therefore be straightforward to extend the model in this way. Nevertheless three-dimensional effects may need to be con-sidered since, in the framework of the two-dimensional model and the very large electricfields occurring in the Hall-MHD simulations reported in[3], it is difficult to account for the fact that there is no evidence for electron runaway acceleration during merging. The collision time of a bulk electron prior to merging is much shorter than that of a bulk ion(for the para-meters used in the PIC simulation it is about 0.2μs), but col-lisions would not prevent runaway acceleration from occurring when super-Dreicer electricfields are present, as suggested by the fluid simulations. Indeed the fact that bulk electrons are collisional on timescales shorter than that of the rise and decay of the electricfield suggests that they are more likely than ions to undergo cross-field transport into the current sheet, thereby providing an additional source of electrons for acceleration.
It is possible that electrons are transported away from the acceleration region too rapidly to undergo runaway acceleration due to three-dimensionalfield perturbations. It is well-established that stochastic magnetic fields produce a cross-field particle diffusivityDRR given by[25]
D v L B
B , 14
B RR
2
d
~ ⎜⎛⎝ ⎟⎞⎠ ( )
whereLBis the parallel length scale of the magneticfield and B
d is the typical fluctuation in the field. If we assume that vertical transport due to this effect is as likely to occur as radial transport, the confinement time tc of particles in the
acceleration region is then determined principally bydZ, since we have taken this to be smaller thandR:
Z D
Z v L
B
B . 15
B c
2
RR
2 2
t d d
d = = ⎜ ⎟ ⎛ ⎝ ⎞⎠ ( )
A particle of mass m will not undergo significant further acceleration if taccºmv eE >tc. Using (15), we deduce
that this inequality leads to the following expression for the magnetic field fluctuation level required to quench the acceleration process: B B B B Z eE L
2 B , 16
crit
2 1 2
d d d
>⎜⎛ ⎟ º ⎝ ⎞⎠ ⎛ ⎝ ⎜ ⎞ ⎠ ⎟ ( )
where =mv2 2 is again the particleʼs parallel kinetic energy. For a given fluctuation level, (16)implies the same
maximum energy for particles of different mass. The ions recorded infigure3had energies of up to about 20 keV. With LB ~2pR E, =10 kV m-1 and dZ =0.01 m, it follows from (16) that particles with this energy would typically be ejected from the reconnecting current sheet before undergoing significant further acceleration if dB B~2´10-3 (note
however that the ion energies in our particle simulations were not limited by three-dimensional perturbations, since a two-dimensional model was used in these simulations). It is rea-sonable to suppose that field fluctuations of this magnitude could occur during the merging process, given that it resulted in a sudden transformation of the magnetic field topology of the plasma and a very rapid increase in its thermal energy[1]. In such a scenario electrons would be expected to have about the same maximum energy as ions, i.e. ∼20 keV. As noted previously, there is no evidence from soft x-ray data for the presence during the early merging phase of suprathermal electrons with energies higher than about 1 keV, although this could be due to the nonthermal bremsstrahlung emissivity being below the detection threshold, given the low densities of MAST plasmas during this phase. In any event three-dimensionalfield perturbations provide a possible explanation of the fact that runaway electron acceleration did not occur during merging in MAST, despite the presence of electric fields capable of accelerating ions to energies in the tens of keV range.
Fast ion and electron production during merging start-up in MAST does not appear to have had any adverse consequences for plasma performance during the flat-top phase. The significance of the results presented in this paper lies chiefly in the insights they provide into the basic plasma physics of reconnection-induced particle acceleration. In solar flares, fast electrons with energies in the tens and hundreds of keV range can be detected much more readily (via hard x-ray and microwave emission) than fast ions with energies in the same range [7, 8]. During merging-compression in MAST, the situation is reversed, insofar as substantial fluxes of suprathermal ions have been detected directly via charge-exchange with neutrals whereas we have only indirect evidence(in the form of microwave bursts)for the presence of suprathermal electrons. The results from MAST thus suggest that parallel electric fields arising from magnetic reconnection can be at least as effective in producing fast ions as fast electrons, and, given the simi-larity noted previously between plasma conditions during merging in MAST and those in theflaring solar corona, it is reasonable to conjecture that this may also be the case in solar flares.
Acknowledgments
FA9550-17-1-0054. JOA was funded by the EPSRC Centre for Doctoral Training in Science and Technology of Fusion Energy grant EP/L01663X. RGLV acknowledges EUROfusion Enabling Research grant AWP17-ENR-MFE-CCFE-01. To obtain further information on the data and models underlying this paper please contact [email protected].
Appendix. Ion collisions
For the purposes of computing ion orbits in thefields described in section3we neglect collisions. For a bulk ion of mass mi and charge Ze colliding with ions of the same species with temperatureTiand densityni, the collision rate is given by[2]
n Z e
m T 2 12 ln , A.1 ii i i i 1 2 3 2 4 4
1 2 3 2 0 2
n
p
= L ( )
wherelnL is the appropriate Coulomb logarithm and0is the
permittivity of free space. Thomson scattering measurements at the start of the merging process in MAST pulse 9153 indicate values of electron density and temperature of around ne1019m-3andTe30 eVin the vicinity of the merging
point. If we make the reasonable assumptions thatnineand TiTe in the highly collisional pre-merging plasma, we infer
from(A.1)an ion–ion collision time of about 26μs. Since this is much longer than the duration(∼1μs)of large reconnection-induced parallel electricfields in the simulations of Stanier and co-workers[3], we are justified in neglecting ion–ion collisions in our particle simulations.
We also need to consider the possibility that collisions of test ions with bulk electrons could affect the acceleration process, since, in the usual case in which the ions are moving slower than the electrons, the ion–electron collision ratenieis
a constant, and therefore the corresponding drag force increases with the test ion speed, potentially setting a limit to the energy gain. This can be seen from the equation of motion
m v
t ZeE m v d
d , A.2
i i
i ien i
=
-
( )
wherevi,Edenote the components of the test ion velocity and electric field parallel to B. Acceleration will evidently cease if vi reaches a value vmax=ZeE m i ien . For vi less
than the electron thermal speedve, we have[2]
n Z e m
m T 2
12
ln
. A.3
ie i e
i e 1 2
3 2
2 4 1 2
3 2 0 2 n p
= L ( )
This expression for nie, evaluated with the same bulk plasma
parameters as before (ni=1019m ,-3 Te=30 eV), together withE =10 kV m-1
, implies a value ofvmax which is much
higher thanve, indicating that(A.3)is not in fact applicable, and therefore that the ion–electron collisional drag force does not in this case limit the energy gain. In any case 10 kV m−1is much higher than the Dreicer field for typical densities and
temperatures in MAST prior to plasma merging. It may be concluded that the ion acceleration process can be modelled without needing to take into account either ion–ion or ion– electron collisions.
ORCID iDs
K G McClements https://orcid.org/0000-0002-5162-509X J O Allen https://orcid.org/0000-0003-2075-6107
S C Chapman https://orcid.org/0000-0003-0053-1584 O Marshall https://orcid.org/0000-0002-6199-8754 R G L Vann https://orcid.org/0000-0002-3105-2546
References
[1] Tanabe Het al2015Phys. Rev. Lett.115215004 [2] Helander P and Sigmar D J 2002Collisional Transport in
Magnetized Plasmas(Cambridge: Cambridge University Press)
[3] Stanier A, Browning P, Gordovskyy M, McClements K G, Gryaznevich M P and Lukin V S 2013Phys. Plasmas20 122302
[4] Helander P, Eriksson L-G, Akers R J, Byrom C, Gimblett C G and Tournianski M R 2002Phys. Rev. Lett.89235002
[5] McClements K G and Turnyanskiy M R 2017Plasma Phys. Control. Fusion59014012
[6] Browning P K, Stanier A, Ashworth G, McClements K G and Lukin V S 2014Plasma Phys. Control. Fusion56064009 [7] Forrest D J and Chupp E L 1983Nature305291
[8] Emslie A G, Miller J A and Brown J C 2004Astrophys. J. 602L69
[9] Fletcher Let al2011Space Sci. Rev.15919
[10] Gekelman W and Stenzel R L 1985Phys. Rev. Lett.542414 [11] Ono Y, Yamada M, Akao T, Tajima T and Matsumoto R 1996
Phys. Rev. Lett.763328
[12] Brown M R, Cothran C D, Landreman M, Sclossberg D and Matthaeus W H 2002Astrophys. J.577L63
[13] Ono Yet al2012Plasma Phys. Control. Fusion54124039 [14] Tanabe Het al2016Plasma Fusion Res.111302093 [15] Tanabe Het al2017Nucl. Fusion57056037 [16] Tanabe Het al2017Phys. Plasmas24056108
[17] Tournianski M R, Carolan P G and Akers R J 2004Rev. Sci. Instrum.752854
[18] Turnyanskiy M R, Keeling D L, Akers R J, Cunningham J G, Conway N J, Meyer H, Michael C A and Pinches S D 2009
Nucl. Fusion49065002
[19] Shevchenko V F, Vann R G L, Freethy S J and Huang B K 2012J. Instrum.7P10016
[20] Wesson J A 2004Tokamaks3rd edn(Oxford: Clarendon)p 129
[21] Hamilton B, McClements K G, Fletcher L and Thyagaraja A 2003Sol. Phys.214339
[22] Freethy S J, McClements K G, Chapman S C, Dendy R O, Lai W N, Pamela S J P, Shevchenko V F and Vann R G L 2015Phys. Rev. Lett.114125004
[23] Lai W N, Chapman S C and Dendy R O 2015Phys. Plasmas 22112119
[24] Mikhailovskii A B 1974Theory of Plasma Instabilities, Vol 1: Instabilities of a Homogeneous Plasma(New York: Consultants Bureau)
[25] Rechester A B and Rosenbluth M N 1978Phys. Rev. Lett.4038
11
![Figure 1. Cartoon of merging-compression formation in MAST, withflux ropes shown in purple, forming around the P3 poloidal fieldcoils (left panel) and on the point of merging (right panel).Reproduced from [3], with the permission of AIP Publishing.](https://thumb-us.123doks.com/thumbv2/123dok_us/9440357.451333/4.595.307.550.60.291/compression-formation-withux-poloidal-eldcoils-reproduced-permission-publishing.webp)