RAMP UP AND RAMP DOWN DYNAMICS IN DIGITAL
SERVICES
HENK AKKERMANS
Tilburg University
CHRIS VOSS
The University of Warwick
ROELAND VAN OERS
Tilburg University
Volume ramp ups are notoriously difficult in digital services, where mar-ket pressures can lead to ramping up too soon and too rapidly which in turn can lead to the need to ramp down. This paper addresses the chal-lenge of taking innovation to scale in an established firm by enhancing our understanding of the nature of service ramp ups and ramp downs. Digital service ramp ups differ substantially from production ramp ups as the speed is much greater, and problems are visible to customers. How-ever there are similarities between service ramp downs and product recalls and an important contribution is exploring the nature of ramp downs their processes and possible causes. Using an engaged research approach, longitudinal data from three consecutive ramp ups in a European telecom operator were collected. Through analyses of cases, qualitative and quanti-tative case data, and using a system dynamics model, we identified a set of issues that affect service ramp ups and ramp downs. These include the need to ramp up the service supply chain, biases leading to unrealistic assumptions about scalability and problem-solving, decision biases in var-ious functions, launching digital services in beta form, a lack of trans-parency of capacity and lack of learning from previous ramp ups. We show that if these problems are not addressed or resolution is delayed, this can lead to cycles of delay, backlogs and productivity problems and the inevitability of a ramp down. We explore reasons and importance for such delays that lead to service ramp downs.
Keywords: service supply chains; ramp ups; ramp downs; recalls; system dynamics; clinical methods; engaged research
INTRODUCTION
Nobody has been as fast as we intend to be. (Ramp up manager)
Markets are pressuring companies to develop new services quickly and to get them to market as soon as possible, leading to pressure for rapid deployment and ramp ups. Such pressure has increased with the growing digitalization of service sectors such as bank-ing, insurance, and media (McKinsey & Co., 2015). Ramp ups of such services usually require a significant commitment of resources, which may cause problems if the available resources do not match the demand growth or if they are diverted from other services and involve ramping up the whole service supply chain. Acknowledgments: The authors would like to thank those
associated with ETEL over the period of this research, in particular Annelore Buijs, Eric Kuisch, and Willem van Oppen, for their support and invaluable insights.
One of the top five reasons for new product and ser-vice failures is organizations failing to manage the ramp up (Schneider & Hall, 2011). Problems during ramp up can lead to difficulties in meeting time-to-market targets and may negatively influence service outcomes. For example, following an SAP rollout by an energy provi-der in 2011, many of the company’s 5.4 million cus-tomers experienced issues, such as billing delays as account details were transferred to the SAP platform. A resulting backlog of complaints created longer call-wait-ing times. The UK energy regulator highlighted a seri-ous deterioration in service levels (Finnegan, 2013), prompting a public apology from the CEO. A public sector example is the rollout of the US Affordable Care Act (Obamacare). In 2013, former Secretary of Health and Human Services, Kathleen Sebelius, said that the administration’s original predictions about its timetable were “flat-out wrong.” She remarked, “Could we have used more time and testing? You bet” (Alter, 2014). This created problems for both the potential users and the government. Negative publicity around repeated problems with new service and system ramp ups is not uncommon, with numerous examples of rapid ramp ups and a pattern of initial rapid rollouts followed by ramp downs—a slowdown or complete halt.
There is extensive literature on the need for product and service innovation, such as new service develop-ment (NSD) and the processes involved (Menor, Tati-konda & Sampson, 2002). However, this literature is virtually silent on the challenge of taking innovation to scale. In this paper, we focus on this challenge in service firms, specifically in the context of digital ser-vices. The effectiveness of ramp ups can be an impor-tant factor in competitiveness. The competitive advantage gained from knowledge-based assets, such as new services, depends in part on exploiting them effectively via rapid and effective ramp up and doing so consistently better than one’s competitors. Thus, it is important for managers in service organizations to understand the issues, key decisions, and trade-offs associated with ramp ups and how any problems can be mitigated during the ramp up process. Equally, at a theoretical level, we need to develop a better under-standing of the nature of service ramp ups. Research into digital service supply chains has shown how unforeseen problems can lead to the phenomenon of fallout (Akkermans & Vos, 2003). Scalability is an important aspect of service ramp ups, both the nature of the service and management assumptions affect it (Boyer, Hallowell & Roth, 2001; Hallowell, 2001).
The research in this paper set out to explore ramp ups in the context of digital services. As the research progressed, we observed problematic ramp ups lead-ing to ramp downs and extended the scope of the research to address this. There is a growing body of ramp up research in manufacturing (Heine, Beaujean
& Schmitt, 2016; Terweisch, Bohn & Chew, 2001) and the supply chain (Li, Shia, Gregory & Tan, 2014). We contend that the context of services, in particular digital services, can differ substantially from products during ramp ups. We put forward and explore three areas of difference. First, service ramp ups take place in the field, and as production and consumption are simultaneous, they may manifest themselves directly to the customer in setup or use. Second, in services, especially digital services, ramp ups can be much stee-per. Finally, there can be pressures to ramp up the ser-vice before it is fully developed. In addition to differences, there are commonalities between product and service ramp ups, especially in that both require ramping up the supply chain resources and capacities. Ramp downs have not been studied, though product recall, which has similar characteristics, is an area of increasing concern to supply chain managers and researchers (Wowak & Boone, 2015). The objective of this paper is to explore ramp ups and ramp downs in the context of digital services, which we address through longitudinal field research in three digital ser-vices in a medium-sized European telecom company.
This paper contributes to knowledge on the chal-lenge of taking innovation to scale in an established firm by enhancing our understanding of the nature of service ramp ups, ramp downs, and associated issues. A distinctive contribution of this research is identify-ing the importance and the nature of the ramp down stage and associated decisions and issues.
LITERATURE REVIEW
Service and Product Ramp upsDesign schedule slippage can cause ramp ups to be accelerated to meet delivery targets, leading to huge budget and schedule overruns, described as “train wrecks” (Mass & Berkson, 1995). Moreover, the increasing levels of automation in the service pro-cesses of digital services give rise to the possibility of “order fallout.” For example, quality problems often occur in service supply chains, especially when they are under pressure (Oliva & Sterman, 2001); if the problem cannot be addressed by IT, it “falls out” and requires manual intervention, sometimes called “re-work” (Akkermans & Vos, 2003). Backlogs resulting from fallout can lead to high workloads, more errors, and more rework, triggering a vicious cycle of more errors, rework, and work pressure. This can lead to high uncertainty concerning future capacity requirements.
Products and services are increasingly linked, both conceptually and through design. An example is servi-tization, where manufacturers develop the capabilities needed to provide services that supplement their tradi-tional product offerings (Baines, 2015). The extant research on product ramp ups is relevant to services, but the nature of services—especially digital services during ramp up—may lead to differences from pro-duct ramp ups. First, propro-duct ramp ups take place in the factory, whereas service ramp ups take place in the field. In services, problems during ramp up will not only lead to delays, but as production and consump-tion are simultaneous, problems may manifest directly to the customer in setup or use. In contrast, many problems that occur in product ramp ups may not be visible to customers beyond delivery delays, and they may allow problem-solving and learning to take place prior to delivery to customers (Terweisch et al., 2001). Another potential difference between products and services is the speed of ramp up. As companies look beyond time-to-market to time-to-volume, the speed of ramp up has become increasingly important (Ter-weisch et al., 2001). Although there are equal pres-sures on products and services to get innovations to market rapidly, in services, especially digital services, where IT lead times can be extremely short, ramp ups can be much steeper. The steeper the ramp up, the less time there is to detect and react to problems before they affect a large customer base.
An important antecedent of the ability to ramp up rapidly is scalability: the ability of a system, network, or process to handle a growing amount of work in a capable manner or enlarged to accommodate that growth. The scalability of the service itself is a mea-sure of how it scales when deployed on larger and/or more systems or as more load is applied. Boyer et al. (2001) described a continuum from high to low scala-bility in services. Services that are pure information have high scalability, and commoditized and
standardized services exhibit higher scalability, while more unique or awkward handling issues exhibit lower scalability. Hallowell (2001) argued that scala-bility is often neglected when firms seek to maximize the growth of technologically intermediated services. To achieve high scalability, firms seek to reduce their dependence on human resources through automation. This approach can have severe limitations, such as when the physical components associated with the service do not lend themselves to high scalability (Boyer et al., 2001).
There are issues associated with overly rapid pro-duct/service development. The “get big fast” strategy is associated with the growth of the Internet and digital business; it is widely accepted that getting big too fast can be dangerous, and there are limits to growth (Sterman, Henderson, Beinhocker & Newman, 2007). Setting aggressive commercialization schedules often has the opposite effect than intended, creating longer delays and lower quality, with cascading effects on product development projects (Mass & Berkson, 1995). Too rapid growth also contributes to the ero-sion of service quality, for example, by hiring inexpe-rienced employees. This leads to productivity fall-offs, the diversion of experienced personnel to support this, excessive workloads, and subsequent employee burn-out and, ultimately, to even worse service quality.
Ramp ups must be managed throughout the supply chain (Li et al., 2014). A service supply chain is where service providers draw on the resources of diverse subcontractors, including internal suppliers, and integrate those resources into the production of the service (Maull, Geraldi & Johnston, 2012; Samp-son & Spring, 2012). Elements of service components can also be delivered to the customer directly from the subcontractor (Wynstra, Axelsson & van der Valk, 2006). Conceptualizations of service supply chains stress the interconnected relationships among cus-tomers, service providers, and their subcontractors (Selviaridis & Norrman, 2014). The process of creat-ing and defincreat-ing value is not as straightforward since multiple actors, including the customer, are involved in service design, production, and delivery. When a complex service is ramped up, there is an implicit assumption that all components of the service, including the upstream service supply chain, can be ramped up at the same rate or already have the capacity in place.
normally performed by test engineers and “friendly users.” Most known critical issues should be fixed at this stage. The beta phase takes the nearly usable ser-vice and develops it into a serser-vice that is ready for release. Testing takes place in the “real world” with real customers, and feedback can cover every element of the service, typically involving the full service team, including marketing, support, quality, and engineering personnel. The beta phase is considered closed and ready for launch when all major and minor issues have been addressed. Commercial pressures to launch early, combined with the difficulty of fully testing a service before ramp up, can lead to a product or ser-vice being released before it is fully developed. There is evidence that it is increasingly common for services to be launched before being fully tested –”launching in beta” (Zomerdijk & Voss, 2011).
Although the phenomenon of service ramp downs has not been studied, it may have similarities to pro-duct recalls. There are growing numbers of recalls, par-ticularly in products such as automotive and pharmaceutical where defective products have the potential to cause harm (Ball, Shah & Donohue, 2018; Hora, Bapuji & Roth, 2011). Causes of the need to recall can include design defects, manufacturing defects, inadequate testing, or inadequate or mislead-ing instructions for use (Hall & Johnson-Hall, 2017; Hora et al., 2011). Of concern in product recalls is the time taken to recall (Ni & Huang, 2017). The decision to recall may be voluntary, initiated by the supplier, or involuntary, required by a regulatory body. Product recall costs, which can be considerable, are pressing concerns for supply chain managers (Wowak & Boone, 2015). Hora et al. (2011) point out that in addition to the societal costs of recalls, firms face their own exter-nal failure costs, both direct and indirect, that arise from product recalls. Direct costs include the costs of managing the reverse flow of products, disposal costs, restitution costs, and legal and liability costs due to any litigation. Indirect costs, which in some instances may be higher than direct costs, include loss of brand image and erosion of market value.
Research Objectives
At the outset of this research, the objective was to develop our understanding of service ramp ups. Ramp ups remain a relatively understudied area; “while researchers have studied product development cesses, relatively few studies directly address new pro-duct launch” (Schoenherr & Swink, 2015, p. 901), and extant research has focused on product but not on service ramp ups. As the research progressed, we observed problems during ramp up leading to major ramp downs, which made us extend our objectives to include developing understanding of the nature and process of service ramp down. Given the paucity of
research into both service ramp ups and ramp downs, to improve knowledge and understanding, especially in the case of digital services, we needed to build on extant research from products but recognize potential differences. To do so, we needed to explore the ante-cedent processes, dimensions, and outcomes of service ramp ups and ramp downs. Areas highlighted by pre-vious research include scalability, ramping up the sup-ply chain, and managerial behavior with respect to the speed of ramp up and timing of ramp down. The above review suggests that the scope of study should include both the antecedents and the supply network of the services studied. As the ramp up and ramp down processes extend over a period of time, a longi-tudinal research process is appropriate.
METHOD
The research is based on a longitudinal study of three cases embedded in a single company using an engaged research process (Van de Ven, 2007). The research was conducted at ETEL, a medium-sized European telecommunications provider. This industry involves frequent ramp ups of new services, which are early in product life cycles, with increased demand for on-time deliveries in shorter time frames and gener-ally shorter lead times (Agrella, Lindroth & Andreas Norrman, 2004, p. 2). These services are increasingly digitally based, and thus, the industry is an appropri-ate setting for this study. ETEL was chosen because two of the authors were already conducting research there.
For research in emergent areas and theory develop-ment, inductive methods using a limited number of cases are appropriate (Barratt, Choi & Li, 2011). A longitudinal research design (Ahlstr€om & Karlsson, 2016) is appropriate for examining processes that unfold over time. Taking the service ramp up as our unit of analysis, we selected three consecutive cases of ramp ups embedded in one company. When selecting cases, it is also important to consider the parameters that will be held constant across the sample (Voss, Johnson & Godsell, 2016). The selected cases all had similar organizational contexts, markets, technologies, and market pressures for rapid ramp up.
VOIP, the company launched a business VOIP service
—case 3 (2010–2011). In all three cases, a key goal was to roll out the new service as fast as possible, either to preempt or react to the competition. Because of their strategic importance, there were effectively no budget constraints.
Data Collection1
In longitudinal studies, the main method of data collection is participant observation, where the researcher records actions as they occur in the research setting. A clinical research process was used (Karlsson, 2016), supplemented by case research methods in case 2. Clinical research is an established engaged method in social sciences where the organization invites the researcher to examine and contribute to understanding and addressing an important problem or set of problems. It typically involves a research question that is of interest to both the researcher and the organization (Karlsson, 2016; Schein, 1987). In this study, the case company invited one of the co-authors to study and address the problems associated with the ramp up of a new service. Schein (1987) argued that there are four possible modes for clinical enquiry: pure enquiry, diagnostic enquiry, action-oriented enquiry, and confrontive enquiry. This research followed the diagnostic and action-oriented enquiry modes. The purpose of diagnostic enquiry is searching for causalities, and for action-oriented enquiry, it is influencing the organization’s thought process in regard to actions in the past, present, and future (Karlsson, 2016, p. 281).
One researcher had a continuous relationship with the organization and kept a logbook of all the interac-tions with the company. In addition to the direct interactions, the researcher had access to substantial documentation and company databases. In case 1, as part of developing an understanding of the causalities, a system dynamics-type cause-and-effect model was developed (Sterman, 2000), and four workshops were held with a set of managers from the organization and the associated supply chain to discuss the concep-tual structure of the model. At the end of the first case, the developed understandings and model were discussed with the leadership of the ramp up process. These led to action by the company in seeking to improve their processes. Based on the learning from case 1, the data needed to be collected for the second case to enable understanding of the ramp up were identified. The process the researcher used was repeated for the second ramp up. The cause-and-effect model was developed further to reflect the findings from the second case. Again, a workshop was held
with company managers, which also led to improve-ment action by the company. At the end, the research and top management reflected on the experience, the findings, and the learning for future ramp ups. A simi-lar process was conducted for case 3.
Additional data in case 2 were collected by a second author using case research rather than clinical research. Twenty interviews were carried out with company managers, with 13 conducted in case 2 and seven after the ramp down in case 3. The model developed in the previous case provided initial guide-lines for the research. A simple protocol was used for the interviews (e.g., “What went wrong? Why did it go wrong?”). All the interviews were recorded in the local language and transcribed, and their durations lasted 45–90 minutes in length.
Sources of data in longitudinal research should include interviews and documents (Ahlstrom & Karls-€ son, 2016), yielding both qualitative and quantitative data (Voss et al., 2016). Quantitative data on all three ramp ups were collected from company records and databases on sales, orders at various process stages, rework rates, backlogs, and call and complaint rates over the ramp up period. Qualitative data were gath-ered from interviews, attendance at meetings, and archival material. The researchers also had access to the company’s intranet database. Analysis was based on a combination of the clinical and case research data. Management decisions were annotated using archival meeting records and presentations (~700 archive records), and some 180 separate events were distilled. For each case, a narrative or story of how the sequence of events produced the outcome was con-structed. Timelines were developed for each ramp up, identifying key issues and decisions at points along the timeline. The data were coded using the relational database functionality of Excel. An iterative process was followed to search for patterns, commonalities, and differences across the cases, which were then reviewed with the research team and company man-agers for refining and further development. For cross-case analysis, the timeline patterns and key themes were compared across the three cases. This research design provides strong situational grounding and enhances the quality and depth of insights in emer-gent areas, but it has limitations in terms of generaliz-ability (Ketokivi & Choi, 2014).
To address reliability and validity, a range of people involved in decision-making were interviewed, and results were fed back to participants (Voss et al., 2016). A senior manager responsible for large parts of the services participated in discussions and reflections on what had taken place in all three ramp ups. The iterative collection of data from different sources pro-vided multiple triangulation opportunities, enhancing reliability and validity (Barratt et al., 2011).
ANALYSIS
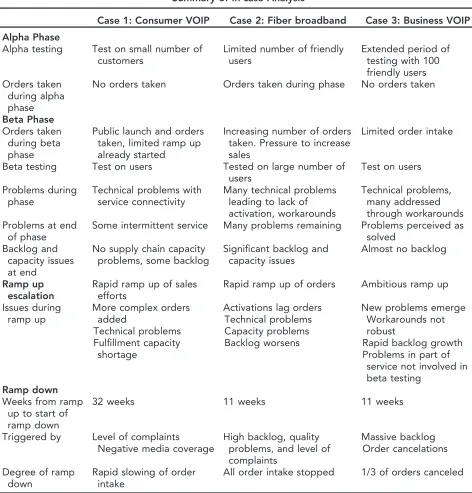
The qualitative data for the three ramp ups are shown in Appendix and summarized in Table 1. In all three, the supply chains were a combination of ser-vice, IT, and physical elements. An overview of the supply chain for case 1 is shown in Figure 1.
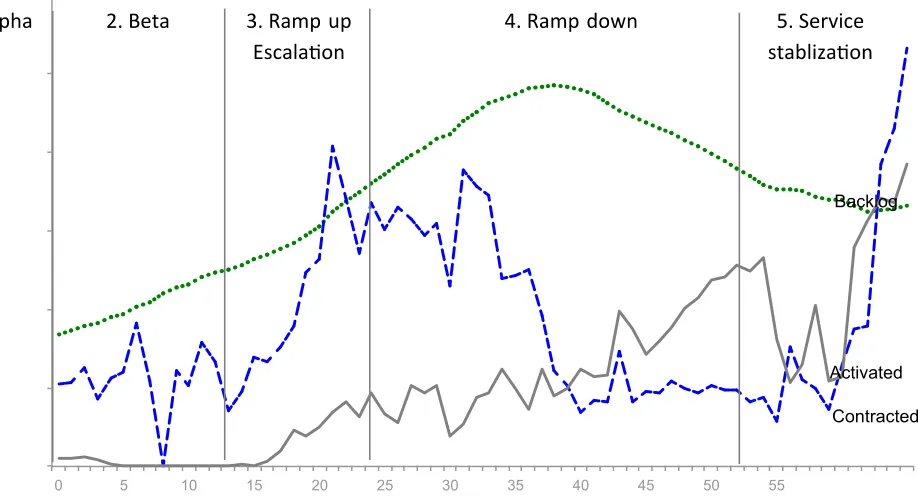
Cross-case analysis found that all three cases showed similar patterns of ramp up behavior (see Figures 2–4)
—development followed by rapid ramp up and, after
[image:6.594.82.554.99.592.2]problems developed, ramp down. For example, in case 1, once a sale had been made (contracted), installation and activation were required before the customer can use the service. When backlogs or post-installation problems occurred, customers contacted the helpdesk, who also registered complaints. While installation was not delayed, as the supply chain was able to cope with the growth in contracts, there were problems in using the installed services, leading to an escalation in calls to TABLE 1
Summary of In-case Analysis
Case 1: Consumer VOIP Case 2: Fiber broadband Case 3: Business VOIP
Alpha Phase
Alpha testing Test on small number of customers
Limited number of friendly users
Extended period of testing with 100 friendly users Orders taken
during alpha phase
No orders taken Orders taken during phase No orders taken
Beta Phase
Orders taken during beta phase
Public launch and orders taken, limited ramp up already started
Increasing number of orders taken. Pressure to increase sales
Limited order intake
Beta testing Test on users Tested on large number of
users
Test on users
Problems during phase
Technical problems with service connectivity
Many technical problems leading to lack of activation, workarounds
Technical problems, many addressed through workarounds Problems at end
of phase
Some intermittent service Many problems remaining Problems perceived as solved
Backlog and capacity issues at end
No supply chain capacity problems, some backlog
Significant backlog and capacity issues
Almost no backlog
Ramp up escalation
Rapid ramp up of sales efforts
Rapid ramp up of orders Ambitious ramp up
Issues during ramp up
More complex orders added
Technical problems Fulfillment capacity
shortage
Activations lag orders Technical problems Capacity problems Backlog worsens
New problems emerge Workarounds not robust
Rapid backlog growth Problems in part of
service not involved in beta testing
Ramp down
Weeks from ramp up to start of ramp down
32 weeks 11 weeks 11 weeks
Triggered by Level of complaints
Negative media coverage
High backlog, quality problems, and level of complaints
Massive backlog Order cancelations
Degree of ramp down
Rapid slowing of order intake
the contact center and, in turn, an escalation in com-plaints. Figure 2 shows the data for the rapid growth of contracted sales, growth of complaints pending, and rapid growth of helpdesk call volume.
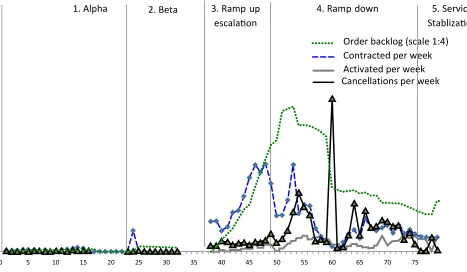
Activation lagging behind sales created a backlog (cumulative orders contracted less orders activated). This is illustrated by cases 2 and 3: Problems during ramp up meant that, although orders were taken, installation (and therefore activation) was delayed. Figure 3 shows the resulting dramatic rise in backlog in case 2. Figure 4 shows the same pattern for case 3 as well as the resulting order cancelations. One strik-ing feature was the extent of the ramp down. In all three cases, when the level of backlog and/or plaints eventually became extremely high, the com-pany had to stop, slow, or cancel order intake, leading to ramp down.
We analyze the data across the three cases in two phases, ramp up and ramp down. We then model the dynamics of the interactions between marketing and operations to gain further insights into the ramp up and ramp down processes.
Ramp up
Alpha Phase. In this phase, the service was tested with limited use. For example, in case 2, testing was initially conducted internally and then with a number of friendly users, followed by a first local pilot. In case 3, testing was extended to 100 friendly users. This phase generated considerable feedback, which informed problem-solving and refinement. In all three cases, there were explicit strategies for restraining growth, but there were actual initial sales in cases 1 and 2.
[image:7.594.63.491.107.377.2]Beta Phase. In this phase, further development of the service was ongoing, with a strong focus on prob-lem-solving, learning, and resolving all problems so that full ramp up could proceed. Sales began with real rather than friendly customers to enable beta testing of the service in the delivered mode. In cases 1 and 2, the level of order intake, although low, was higher than desired by the technical teams; problems with delivery and use led to increased backlogs and nega-tive customer feedback. No formal beta testing took place before the decision was made to ramp up; FIGURE 1
Case 1 Service Supply Chain [Color figure can be viewed at wileyonlinelibrary.com]
Information flow
Physical flow Note: 1) Either online/self-care, through a store or via phone
2) if required (for existing customers hardware may already be present) 3) by either the customer herself or a field engineer
Customer orders service1
Order information is processed
Network is configured Customer
data error checks
Customer receives hardware peripherals2
(Modem, TV unit, Phone)
Hardware is installed and configured2,3
Service(s) are activated Warehouse
ships hardware
In case of service change (e.g., upgrade, move)
although many problems remained unsolved or the solutions were workarounds, it was decided to execute a very rapid ramp up. In effect, in cases 1 and 2, the
[image:8.594.112.551.113.350.2]service was launched in beta. In case 3, management decided not to launch in beta and felt that all prob-lems had been addressed. However, only the upstream FIGURE 2
Case 1 Timeline [Color figure can be viewed at wileyonlinelibrary.com]
FIGURE 3
[image:8.594.101.560.431.679.2]service supply chain had been tested, not the down-stream activities.
Ramp up Escalation. In all three cases, sales effort was increased dramatically. The demand for all three services was high, and the sales teams were successful in meeting their aggressive sales targets. In cases 1 and 2, despite testing, unanticipated problems occurred during scale-up, delaying activations and leading to a huge increase in the order backlog (see Figure 3). In case 1, the delay in acquiring and deploying resources to address customer problems led to a rapid growth in complaints (see Figure 2). In all three cases, various efforts were made during this period to resolve prob-lems and ensure that activations and problem-free use were back on track.
ETEL’s management was aware of the potential pit-falls of ramping up too quickly and the importance of building an effective cross-functional sales and opera-tions planning process (Oliva & Watson, 2011). They sought to learn from both ongoing and previous failed ramp ups, to avoid repeating earlier mistakes. However, despite the steps taken to preempt such issues, all three ramp ups were problematic, raising the question of how effective the learning was from case to case. We next explore this in the context of two important decisions, when to ramp up and how fast to scale up the service.
Ramp up Decisions
[image:9.594.37.504.114.386.2]Prelaunch. Given the competitive pressure for early launch and rapid ramp up in combination with uncertainty over technical issues, deciding when and how aggressively to ramp up is crucial. In cases 1 and 2, the decision was made to ramp up early, in particu-lar launching took place before beta testing was com-plete. This is consistent with previous research (Zomerdijk & Voss, 2011) indicating that this is com-mon when there are strong market pressures and fully testing a service before launch may be difficult and slow. The greater the pressure to get to market before competitors, the greater the likelihood that decisions will be made to ramp up before the firm is ready to do so—increasing the risk of order fallout and result-ing cycles of delay, backlog, and productivity prob-lems. There was a clearly understood risk that early ramp up could lead to problems, despite this the company ramped up early assuming that these prob-lems would be addressed. Ramp up escalation was driven by commercial pressure, which could have blinded marketing to the reality of the ramp up prob-lems. In cases 2 and 3, although the activation rates increased slowly, no management action was taken to reduce the pressure on sales. This may have been due in part to the lack of visibility of both activation rates and backlogs. These decisions could also be explained FIGURE 4
Case 3 Timeline [Color figure can be viewed at wileyonlinelibrary.com]
Order backlog (scale 1:4)
Contracted er week Ac vated per week Cancella ons per week
ti ti
0 5 10 15 20 25 30 35 40 45 50 55 60 65 70 75
as a result of the planning fallacy (Buehler, Griffin & Ross, 1994), the tendency to optimistically plan pro-ject timescales and resources and to overlook propro-ject risks. This is one manifestation of the optimism bias: a cognitive bias leading people to think they are more likely to succeed, or are less at risk of failure or of experiencing a negative event, than they really are. “Planners tend to overestimate the probability of the successful completion of a project and underestimate the probability of negative events, overspends, and setbacks. Moreover, this occurs even when knowing that the majority of similar projects have over-run” (Behavioural Insights, 2017, p. 5). A service such as this draws on the resources of diverse subcontractors, including internal suppliers (Sampson & Spring, 2012). Thus, the decision on when to ramp up should also address availability of resources and the readiness of the supply chain. The data from cases 1 and 2 indi-cate that this was inadequate and a contributor to ramping up too early.
Ramping up early led to predictable negative out-comes. Technical or design problems occurred during ramp up and post-ramp up use. When problems occur in use that cannot be dealt with easily, resolving the ensuing phenomenon of “order fallout,” discussed earlier, often requires substantial human resources. In digital services, this can lead to a cycle of unexpected and sharp workload increases in the problem-solving and customer-handling areas (Akkermans & Vos, 2003). This was evident in the negative outcomes; for example, dealing with the problems in case 1 led to a major workload increase in both problem- and complaint-handling, leading to further delays and backlogs.
Postlaunch. A second key decision is the speed of ramp up. In all three cases, consistent with previous research (Mass & Berkson, 1995), our data indicated that the rapid ramp up caused problems. The speed of ramp up is linked to scalability. Two factors that can limit scalability are the non-IT elements of the service and the complexity of the service (Boyer et al., 2001; Hallowell, 2001), these were evident in all three cases, thus limiting the scaling of the services.
We observed that scalability encompassed two areas: scalability of the supply chain and scalability of the service. Problems with the scalability of the supply chain were most apparent in case 2, where the rapid ramp up required scaling up of capacity in multiple locations. All cases illustrated problems with the scala-bility of the service. In case 1, the initial version of the service was designed for simple-use contexts, and it did not scale up well for more complex uses. The service still being in beta at the start of the ramp up compounded the scaling problems. This was also a problem in case 2, where the immaturity of the soft-ware led to increasingly more IT workarounds. In case
3, the service was not ramped up until the company was confident that it was working well. However, this testing was limited to the upstream order-handling. Downstream, a multitude of smaller orders was all interdependently executed by a wide variety of inde-pendent internal and outsourced units. As a result, the service soon encountered a multitude of technical problems and delays.
In all three cases, management, despite knowing in advance about the risks of ramping up too fast, decided to ramp up early and to ramp up very rapidly. This raises the question of: Why? The plan-ning fallacy (Buehler et al., 1994) is one explanation of management’s behavior. They may also have ramped up too quickly because of a lack of under-standing of the constraints of scalability. Despite there being a spectrum of scalability, from high to low (Boyer et al., 2001), their behavior is consistent with assuming that the scalability is much higher that should be expected from the service context (Hallow-ell, 2001). This was compounded by a failure to rec-ognize the complexity of the service supply chain— indeed, as one senior manager at ETEL stated, “We have no supply chain.”
We conclude that unrealistic expectations of scalabil-ity due to the planning fallacy and a lack of attention to and understanding of the scalability of both the service and the supply chain contributed significantly to decisions to accelerate ramp up speed, leading to the experienced ramp up problems.
Capacity Management
The operations management team were set a target of 100 percent utilization of all resources. In a volatile context, a conservative approach to setting capacity levels can lead to a lack of flexibility in dealing with extra capacity demands, limiting rapid response capa-bility. For example, in case 1, the problems led to a quadrupling of capacity in the call centers along with 300 additional installation technicians and a new team to deal with complex complaints individually. These resources took considerable time to be deployed.
times the volume) and that capacity build-up would not be an issue: “We then believed the network would go live very quickly” (Marketing manager, case 2). In cases 2 and 3, the complexity of the service supply chain was underestimated, leading to difficulties in imple-menting robust demand and capacity systems before full ramp up. Case 2 involved a complex service, requiring many steps to be taken in harmony by mul-tiple independent parties in synchronizing activities as diverse as digging to place cables and installing soft-ware upgrades for communication with new equip-ment. New reporting methods also had to be implemented, making it problematic to assess actual delivery performance for the current pool of orders, and, as a result, the service supply chain lacked trans-parency.
Ramp down
Corrective efforts were insufficient to reduce the backlogs or levels of customer problems in the short term. In case 1, there was major public discontent; in cases 2 and 3, management came to realize that the backlog of contracted customers waiting to be acti-vated had become excessive, lead times were too long, and quality problems and complaints were at unac-ceptably high levels. In all three cases, management drastically curtailed the order intake, and in case 3, they even canceled a large part of the backlog (Fig-ure 4). Following ramp downs, management focused on solving the main service problems to ready the company for renewed ramp ups, which were more cautious and conservative. An important but neglected decision area is whether, when, and how to ramp down. We examine the empirical data to explore why they occurred, why and when decisions to ramp down were made, and how they were handled.
The antecedents of the ramp downs arose from the factors described in the previous section: ramping up while still in beta, ramping up very fast, and failing to manage the scaling of the service and the supply chain. These led to problems that needed to be addressed, and the longer such problems went unsolved, the greater the probability that there would be a need for a major ramp down. In all the cases, there was failure to fully resolve the problems quickly. We observe a number of possible reasons for this. First, as in case 1, when problems did occur, there were insufficient resources to address them as they occurred, and there was a time lag in mobilizing suffi-cient resources. Second, time pressure meant that problems were addressed through a range of fixes, technical compromises, and workarounds “We con-tinue to connect small batches of customer and commercial testing to facilitate learning in operations and support a quick ramp up when the supply chain is fully ready” (Management presentation, case 2). In case 2,
workarounds were already being used in the alpha phase: “What doesn’t work will be solved with work-arounds”(Management team presentation, case 2). Just prior to the ramp down, the company was managing about 30 workarounds, ranging from simple to com-plex, costly, and time-consuming solutions. Gross (2014) observed in product launches where unex-pected problems occur, these need to be addressed as soon as they arise, leading to improvisational behav-ior, workarounds. This decreases both the launch per-formance and financial performance, and thus, improvisation should be avoided during new product development as well as during the launch. He also argued that this could be a source of valuable learning in regard to new problems and their solutions. There is thus a trade-off between solving problems perma-nently, which may slow down ramp ups, or hoping that workarounds will lead to problems being fully addressed before there is market damage and poten-tially ramp down.
The above led to a situation where problems could likely not be resolved rapidly and where there would be negative customer impact. However, the time taken to decide to ramp down seemed to be slow, for case 1 it was 32 weeks (see Table 1), though faster subse-quent reactions indicate that learning may have taken place. Cases 1 and 2 in particular indicate that there were delays in making the ramp down decision. We see evidence of a number of possible causes for this. First is lack of, or lack of visibility of, appropriate data to indicate that there were serious current or potential problems. In cases 1 and 2 in particular, although problems were evident at an early stage to those deliv-ering the ramp up, the problems and the signals that there were problems, such as low levels of activation, high levels of backlog and customer complaints, were not necessarily reaching those with decision-making powers concerning ramp up and ramp down. For example, in case 1, senior management was celebrat-ing record sales at the point when customer com-plaints were peaking.
customer complaints and in case 3 to order cancela-tions by both customers and ETEL. The need for a ramp down occurred when the negative outcomes would be compounded by continued delivery or roll-out of the service.
What triggered the decision to ramp down? It is interesting to note that in all three cases ramp downs were not triggered by the initial recognition that there were potentially difficult-to-address problems, although there was ample evidence of such problems occurring and the growth of unplanned backlogs. While these may have raised managerial awareness, it would seem that the decision to ramp down was made only after customer-based feedback. This included increasing customer complaints, order cance-lations, and, in case 1, negative social media and tele-vision coverage. For example, in case 1, customer problems featured in several programs on national TV, prompting the CEO to state, “We became victims of our own success.” If decisions had been made earlier to slow or halt ramp up to allow the issues at hand to be addressed more effectively, the longer-term ramp ups may have been more successful.
To summarize, our observations indicate that there are similarities between service ramp downs and pro-duct recall. Whether and when to recall a propro-duct is one of the most important, yet complex decisions that an operations manager may face (Ball et al., 2018). Recalls and ramp downs are needed when a point is reached where continued ramp up of the service or use of the product will lead to negative outcomes. There is concern about the time it takes for product recalls to happen, which parallels our case data indi-cating that the services should have been ramped down earlier. We observe that launching in beta and ramping up rapidly contribute to the problems that trigger the subsequent need to ramp down. This was compounded by the time needed to put in place the resources to deal with the problems and improvisa-tional problem-solving. Moreover, we observe a num-ber of factors that contributed to delaying the decision to ramp down, including optimism bias and lack of visibility of key indicators, such as backlogs and customer complaints, as well as pressure from financial incentives. After these aggressive launches under technical uncertainties, it is unlikely that the ramp downs could have been avoided. However, through more thorough problem-solving, better data visibility, and rapid decision-making there could have been gentler and earlier ramp downs, which could have led to reduced costs to the company.
Learning and Ramp downs
It could be argued that if the company had learned from the problems in each case, then the problems that led to ramp down subsequent cases may not
have occurred. Learning is important in ramp ups (Pisano, 1996), and the longitudinal study gave us the opportunity to examine the learning from case to case. The first opportunity for learning from problems was the ramp up for case 1, which led to develop-ment of improved sales and order planning systems. However, no connection seems to have been made between launching early and technical problems in the installation, resulting in the early launch in case 2. By case 3, all these issues had been recognized and steps are taken to address them. Despite this learning, a new set of problems arose from scaling up the ser-vice. The workshops held during the ramp ups were specifically designed for learning (Vennix, 1996) and would have provided management with the opportu-nity to debate and learn from failure (Canon & Edmonson, 2005); moreover, the involvement of the researchers would have resulted in greater learning than would otherwise have taken place. However, in case 2, it seems that not all this learning was taken on board. This may have been due to the financial and market pressures from senior management as well as optimism bias. In contrast, the learning was taken on board for case 3. Although learning from failure is an obvious thing for an organization to do, there is evidence that it is difficult and often does not occur. A study of a European telecom organization comparable to our case concluded that the company “learned surprisingly little from the failures we inves-tigated. Managers generally explained away large fail-ures on the basis of general societal trends or the involvement of outsiders” (Baumard & Starbuck, 2005, p. 294). To learn from failure or major prob-lems, companies must first learn to identify failure, not just large-scale, but especially the small failures, and then use analysis to capture the lessons (Canon & Edmonson, 2005). We conclude that in ramp ups, identifying and learning from problems are important for improving the ramp up process but that there are barriers to this process. In addition, even when there has been valuable learning, it must be recognized that new problems can arise.
Modeling the Dynamics
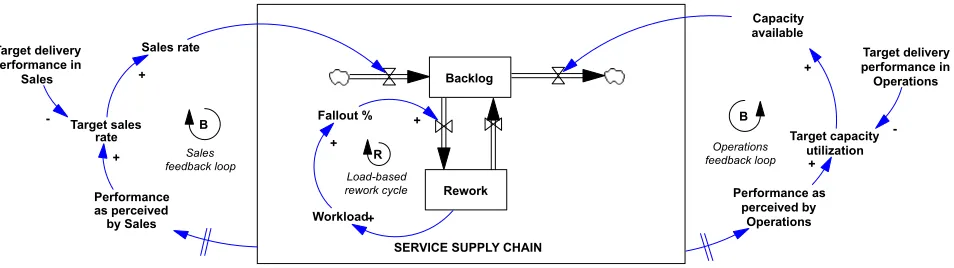
system dynamics models were developed. Based on these, to increase our understanding of the dynamics of the ramp up and ramp down processes, a generic model was developed that represents how the actions of the sales and operations functions in the service supply chain were linked, both causally and over time (see Figure 5).
In system dynamics, behavior over time is seen as the result of the dynamic interactions of two types of feedback loops: balancing loops that steer the system toward a certain goal or desired behavior and rein-forcing feedback loops that steer the system toward a path of exponential growth or decline. The net result of all feedback loops determines the actual behavior of the system. Our model is comprised of three inter-acting feedback loops—two balancing (B) and one reinforcing (R). Examining the underlying causal structure that generates the complex dynamics observed, it is apparent that both ramp ups and ramp down decisions are the consequences of the same bal-ancing loops that overshoot.
The first balancing loop is in sales, whose aim is to set the target sales rate as high as possible without compromising service delivery performance. The sales rate is adjusted based on performance data. However, there are lags in assessing current delivery perfor-mance as it takes time for orders to travel through the service supply chain and for information about deliv-ery delays, fallout rates, and so on to travel back to sales and to confirm with sufficient certainty that the perceived performance is a trend and not just a ran-dom signal. Finally, there are implementation delays in translating the new understanding into revised poli-cies—maintaining, increasing, or reducing the level of sales (Sterman, 2000). It is these delays that lead to an overshoot.
The second balancing loop is in operations, where the objective is to optimize capacity utilization
without compromising delivery performance. As in sales, acquiring and processing the required informa-tion are subject to several delays. For example, it can be difficult to determine how much capacity is required for a given volume of incoming orders. As many processes are digital, significant capacity may be required for dealing with problems and rework, but the extent of the rework depends on the quality of the orders rather than their volume (Akkermans & Vos, 2003). Thus, it takes time to establish when corrective action is needed; the corrective action (hiring and training extra staff) also takes time, as does evaluating the adequacy of that corrective action. Again, these delays can lead to an overshoot. Between these two balancing loops, a third, but reinforcing loop is con-cerned with rework. Fallout leads to rework, which increases workload to address the problems. How well the service performs will be determined by this rework cycle (Oliva & Sterman, 2001).
[image:13.594.39.516.123.257.2]“It is important to understand the relationship between operational and marketing processes and out-comes because, logically, operational success is an essential precondition to market success” (Tatikonda & Montoya-Weiss, 2001, p. 152). Our empirical data indicate opposing decision biases in marketing and operations. Decision biases are systematic deviations in decision-making (Bendoly, Croson & Goncalves, 2010). In operations, the observed policy of maximiz-ing rather than optimizmaximiz-ing capacity utilization in the context of high uncertainty and the high market cost of failing to fulfill customer needs can be viewed as deci-sion bias. In marketing, performance measurement-dri-ven pressure for rapid growth, prompting a willingness to ignore ongoing technical problems and capacity considerations in favor of ambitious ramp ups, can also be viewed as decision bias. These decision biases thus reflect a misalignment between targets. Figure 5 indicates these biases in targets will lead to higher sales FIGURE 5
Service Ramp ups and Ramp downs—Three Interconnected Feedback Loops [Color figure can be viewed at wile yonlinelibrary.com]
Target sales rate Target delivery performance in
Sales
Performance as perceived by Sales
Sales rate
+
Performance as perceived by
Operations Capacity available
Target capacity utilization
Target delivery performance in Operations
Sales feedback loop
Operations feedback loop Load-based
rework cycle
Backlog
Rework Fallout %
Workload+ +
+
SERVICE SUPPLY CHAIN +
-+
-+
B B
rates and lower capacity availability than is needed, which in turn will lead to higher backlogs. As the model predicts, establishing when action is needed, taking corrective action, and assessing the adequacy of actions taken all took time, creating a strong amplifica-tion of the issues in both funcamplifica-tions. Delays and a lack of information made addressing this more difficult. In addition, for both the sales and operations feedback loops, the rework cycle loop further complicated decisions and performance. Contributing to this were temporary fixes and workarounds for problems com-pounded the need for capacity to solve the problems. This can (and did) exhibit a tipping point, where increasingly more orders can be processed relatively smoothly until a capacity threshold is passed. At that point, a vicious cycle was triggered, in which more rework led to higher workloads, leading to more errors and more temporary fixes, which led to further rework. In less extreme ramp ups, or with less delay, deci-sions could be made to reduce sales targets. However, in all three cases here it was too late, and the only possible decision was to ramp down. Out-of-control feedback loops forced the company to ramp down to regain control of the process.
Because ramp ups require cross-functional coordina-tion and good visibility of capacity and backlogs (Oliva & Watson, 2011), the more complex the ser-vice, the more important these become and the more difficult they are to put in place. This was a major problem in case 2, and it proved problematic in the other cases, indicating that poor systems and lack of visibility can compound ramp up problems. Effective systems can help build synergies between marketing and operations. Such synergies are valuable when built on complementary resources (Harrison, Hitt, Hoskisson & Ireland, 2001).
We conclude that the behavior of the three ramp ups and the consequent ramp downs can be understood from a system dynamics perspective. In particular, the system dynamics model shown in Figure 5 indicates the conditions under which ramp up overshoots will occur, ramp downs will occur, and the need to align target sales rates and target capacity utilization. We argue that the capacity strategy should be consistent with the complexity of the service and its supply chain and the technical uncertainty associated with the new service. It seems realistic to expect that many new ser-vices will be launched in beta, and capacity and resource decisions should take account of this. Finally, the model indicates that delays have a major impact on the capacity to deal with misalignments and problems.
DISCUSSION
The purpose of this research is to explore ramp ups in the context of digital services, with a focus on the
understudied area of ramp downs. It is based on three cases in a narrow context, but from our analysis, we set out a more general base for understanding service ramp ups and ramp downs.
Ramp up
Deploying new services rapidly is increasingly important for competitiveness (Qiang, Voss & Zhao, 2018); however, extant research shows that too rapid growth leads to negative outcomes (Sterman et al., 2007). Our research builds on this by exploring rapid growth in digital services and the precursors of and behavioral contributors to ramp up problems. Service ramp ups can be understood in two parts—pre- and postlaunch.
Prelaunch. Service ramp ups typically take place immediately after the NSD process. Because the ser-vice may be difficult to fully test before launch and due to competitive pressure, services may be ramped up early, before they are fully developed—launching in beta. However, launching services that are not fully developed and/or tested can negatively influence the ramp up process and outcomes (Mass & Berkson, 1995). Thus, the key decision on when to ramp up will require explicit attention to trade-offs: launching too late—which may lead to loss of market share or first-mover advantage—and launching too early— which risks service failure. The decision to ramp up should also address whether all the resources needed, not just those directly associated with the service, but across the whole supply chain, are in place.
Postlaunch. Service ramp ups, unlike products, take place in the field. Thus, any problems with the service or its delivery will manifest themselves to customers. The speed of ramp up is a central issue. Although ser-vice systems do not necessarily ramp up rapidly, a context of high competitive pressures and the growing digitization of services can lead to planning ramp ups that are an order of magnitude faster than product ramp ups.
We identify in our cases a number of factors leading to ramping up too soon and/or too fast, though they may not be present in all service ramp ups. As with projects, pressure to ramp up soon and rapidly accen-tuates the risk of the planning fallacy (Buehler et al., 1994)—that is, planning optimistically and overlook-ing project risks. The risks associated with early ramp up include unforeseen technical problems, and lack of capacity and capability in the service delivery system. The risks associated with rapid ramp up can include growing faster than scalability constraints, failure to resolve technical and service design problems quickly, and an inability to rapidly resource problem-solving when needed (Morrison, 2015).
range from low to high (Boyer et al., 2001), and there are risks that this scalability can be assumed to be higher than it actually is. There is often an assump-tion that digital services can scale rapidly even when there are constraining factors (Hallowell, 2001). These issues may be compounded by lack of recognition of the full service supply chain. In addition, as the nat-ure of the service may change over time, the scalabil-ity of the service as well as the supply chain must be considered.
How fast to ramp up is a decision to be taken at launch and involves decisions by marketing on sales rates and operations on capacities. These decisions also need reviewing regularly during ramp up. This requires transparency and appropriate data on capaci-ties, backlogs, and order problems. As ramp ups take place in the field, they involve both sales/marketing and operations functions when making decisions about resources, ramp up speed, and ramp down. Tang (2010) contends that marketing and operations can coexist in harmony within a firm when the mar-ket condition is stable. However, he argues that when developing and launching new products and services quickly, operations groups may find it challenging to meet marketing’s expectations because production cannot be changed quickly. Thus, in rapid ramp ups co-operations between marketing and operations can be expected to be challenging. Although they may have been accentuated here, we contend that there is a general potential for functional misalignments to occur in the context of rapid service ramp ups. First, there may be differences in team culture. Second, per-formance measures for operations and marketing may be not aligned. For example, we observed an aggres-sive sales policy and a conservative capacity policy in our cases. In a service ramp up where capacity is uncertain, a potential dilemma for operations man-agers is whether to aim high and potentially incur cost penalties or adopt a conservative approach and risk building up insufficient capacity. These misalign-ments derive in part from the specific organization, but they also reflect the broader cultures associated with marketing, operations, and other functional spe-cialisms, and as such, they are perhaps less easily changed. In ramp ups, functional decision biases can lead to misalignment, worsening cycles of delay, and backlogs. Thus, particularly in rapid ramp ups, there is a need for firms to manage potential conflict between marketing and operations. Our system dynamics model indicates how this conflict can lead to escalating feedback loops and failure to react effec-tively to problems. Out-of-control feedback loops lead to conditions requiring ramp down.
Ramp ups can be a common process in service firms, so learning is needed to avoid mistakes and improve processes (Pisano, 1996). Learning in
complex, dynamic systems with significant feedback delays and accumulations in contexts such as this are problematic (Bendoly et al., 2010). As projects get more complicated, managers stop learning from their experience and fall into an “experience trap” using simplified heuristics developed from earlier, simpler contexts (Sengupta, Abdel-Habid & van Wassenhove, 2008). Hall and Johnson-Hall (2017) argue that in product recall, the learning derived from failures can reduce the potential for future recalls. We would expect a similar pattern in ramp downs.
Ramp down
A key finding from this research was the impor-tance and nature of ramp downs. In ramp ups, prob-lems are likely to occur, particularly if launched in beta and with rapid ramp ups. Delays or failure to resolve problems leads to the possibility of the need to ramp down, cutting back or even stopping sales and delivery of the service and/or canceling existing orders. We have learned four things about ramp downs.
The Conditions Triggering the Need for a Ramp Down and Their Precursors. There are parallels between the processes of service ramp down and pro-duct recall. The conditions for both are when there are potentially significant costs arising from not ramp-ing down or recallramp-ing (Hora et al., 2011). In services, these are direct costs, loss of revenue, and indirect costs, such as impact on brand image and market value. We identified multiple precursors of the need to ramp down. In addition to those that influence recalls, such as operational issues and actions that influence the quality of the product (Wowak & Boone, 2015), there are those distinctive to service ramp downs. We observed many in our research: services launched in beta, leading to design problems remain-ing to be solved durremain-ing ramp up; havremain-ing inadequate resources to address problems, leading to delays in acquiring resources and addressing problems (Mor-rison, 2015); ramping up with inadequate attention to scaling the supply chain, leading to logistics and delivery problems; inadequate planning for the nature and scope of the service, which can lead to delays in service delivery; and finally solving problems by the use of improvisational means, such as workarounds, which may delay real problem-solving (Gross, 2014). Other precursors are possible; for example, Qiang et al. (2018) report a case where too late a ramp up led to ramp down as the service was obsolete by the time it was deployed.
of ramping down could be less severe. In our study, the time from launch to ramp down was in the range of 11–32 weeks (Table 1). Hora et al. (2011) and Ni and Huang (2017) report substantial concern about delays in product recall decisions; for example, in a product recall of toys, the average time to recall ran-ged from 463 to 869 days and in automakers from 5.78 to 16.29 months. This substantial difference between products and services could be due to prod-ucts being fully tested prior to launch and further problems only being identified after substantial use, while for digital services, a fast ramp up would lead to problems being identified much more rapidly. We observed that in rapid ramp ups, delays in addressing problems can result in a tipping point where a cycle of higher workloads leads to more errors and more temporary fixes, leading to further problems. This in turn has implications for capacity strategy in digital services, since the bulk of the human capacity required is often rework, depending on the quality of orders, more than their quantity (Akkermans & Voss, 2013).
Causes of Ramp down Delay. In rapid ramp ups, delays in information and decision-making can seri-ously delay adjustments in ramp ups and decisions to ramp down. The model in Figure 5 indicates that cor-rective action will only be taken once the function rec-ognizes a performance problem. In all cases, considerable time elapsed before sales grasped what was happening in the field and could decide what to do. Rapid response requires both capturing the appro-priate information, for example, backlogs and com-plaints, and to have systems for capturing it early. Today, monitoring social media is increasingly effec-tive for rapid forewarning of problems.
Management behavior can be a cause of delays. Optimism bias may lead to assumptions that prob-lems can be solved rapidly and permanently and thus delaying decision-making. Consistent with outcomes observed in the cases, Meyer (2014) found that in-project optimism bias contributed significantly to decision makers’ motivation to continue with a failing project. Moreover, ramping down may not be an easy decision to make. First, with aggressive target-setting linked to sales (as in this case), where marketing and sales personnel are financially incentivized, a ramp down can have a negative financial effect at the per-sonal level. Second, there is significant institutional investment in a major ramp up, and ramp down entails a loss of face, internally and potentially exter-nally. Face-saving is associated with behavior that pro-tects an individual’s self-esteem and that of others (Scheff, 1988). An inability to meet the standards of social norms or values results in a loss of face for the individual (Young, 2014). These factors may bias organizations toward delaying ramp down decisions.
Mitigating Ramp up Problems. A further issue iden-tified in product recalls is mitigation approaches (Wowak & Boone, 2015). While we did not collect data on this, there is a substantial field of study on mitigation approaches in services—service recovery. There are choices in service recovery including whether apologies should be pro-active or reactive and whether and where recompense should be given. The effectiveness and choices of service recovery strate-gies are contingent on context (Mattila, 2001); thus, there is a need for exploring these in the context of ramp downs.
Our research argues for extension of the scope of theories of NSD. Extant research sees the process as being completed prior to ramp up: “the process of devising a new or improved service, from idea or con-cept generation to market launch” (Biemans, Griffin & Moenaert, 2016; p. 2). Menor et al. (2002) see the endpoint of NSD as a full launch. Consequently, that ramp up takes place at the end of the NSD process has either been ignored or seen as nonproblematic. Successful exploitation of service innovations requires attention to their deployment (Qiang et al., 2018). We argue that theories of service innovation and NSD should be extended to include the processes of deployment and ramping up.
The rapidly changing business environment raises the question, what are the future implications of this research? Technology evolution has increased the complexity of the service context by multiplying the ways customers can interact with other customers and different service providers, leading to complex service networks (Karmarkar, Kim & Rhim, 2015; Patricio, Gustafsson & Fisk, 2018). We contend that these trends will accentuate the issues that we have identi-fied in service ramp ups. However, increasing learning and awareness of the need to manage service supply chains and experience in ramping up in digital ser-vices may counter this.
CONCLUSIONS
This research contributes to our understanding of service ramp ups and ramp downs. First, it proposes both similarities and differences between service and product ramp ups. Second, it elaborates a sequential model of the service ramp up process and identifies and explores key decisions, problems, and their causes. A distinctive contribution is the identification and exploration of the ramp down phenomenon. We identify reasons for the need to ramp down, their antecedents and in particular identify delays as a key issue and explore their potential causes.
contexts may exhibit different or additional issues and behaviors. Second, such cases risk bias by the researcher and need validation in different contexts. Third, some of the issues identified ex post were strongly related to management behavior and Ball et al. (2018) call for research into behavioral aspects of the decision to recall. More in-depth methods are needed to build on these insights, such as whether company-level behavior would influence our findings. The research was conducted in the context of digital services; thus, a question arises as to its wider general-izability to nondigital service contexts. At first glance, the problems in the three cases could be viewed sim-ply as examples of bad management. However, we argue that, although the observed problems may be worse than in many ramp ups, they reflect the multi-ple potential causes of service ramp up and ramp down problems.
Our findings provide implications for practice. To avoid falling into ramp up traps, ideally, ramping up should occur only after successful testing; however, the reality of competitive pressure and technical understanding means that many organizations will opt to launch in beta. They must manage the balance between ensuring the product is right, the market pressures to launch quickly, and investment in agile capacity to deal with potential technical issues. They require effective sales and operations planning systems to ensure transparency and minimize information delays as well as to coordinate planning in both func-tions. To avoid delayed ramp down decisions, compa-nies need early warning signals and a fast and effective process to ramp down in a timely, controlled manner when required.
Managers must understand the context of their ser-vice and how it will influence scalability and constrain ramp up speed; particularly in digital services, they should be wary of assumptions of “infinite scalabil-ity.” These are challenges for many organizations, owing to the optimism and cognitive biases that affect decision-making and the technical and market uncer-tainty inherent in such ramp ups.
With the growth of services in a highly competitive environment, implementing ramp ups effectively and avoiding costly ramp downs will be increasingly important for long-term success. Promising directions for further research include exploring the interaction of the factors and decisions associated with service ramp ups, and extending research to other empirical settings to understand how service ramp ups and ramp downs vary with context. The use of system dynamics models and simulations can contribute to this. There is scope for examining the learning pro-cesses, behavioral aspects, the decision biases, and assumptions that inform the management of service ramp ups and ramp downs.
REFERENCES
Agrella, P. J., Lindroth, R., & Andreas Norrman, A. (2004). Risk, information and incentives in tele-com supply chains.International Journal of Produc-tion Economics, 90, 1–16. https://doi.org/10.1016/ S0925-5273(02)00471-1
Ahlstr€om, P., & Karlsson, C. (2016). Longitudinal field studies. In C. Karlsson (Ed.), Research meth-ods for operations management (pp. 198–232). Lon-don, UK: Routledge.
Akkermans, H. A., & Vos, B. (2003). Amplification in service supply chains: An exploratory case study from the telecom industry. Production and Opera-tions Management, 12, 204–223.
Akkermans, H. A., & Voss, C. A. (2013). The service bullwhip effect. International Journal of Production and Operations Management, 33, 765–788.
Alter, C. (2014). Sebelius: Obamacare Rollout Was “Terribly Flawed.” Retrieved from http://time.c om/61395/kathleen-sebelius-obamacare-rollout, accessed May 14 2018 https://doi.org/10.1111/ deci.12163
Baines, T. (2015). Exploring service innovation and the servitization of the manufacturing firm. Research-Technology Management, 58, 9–11.
Ball, G. P., Shah, R., & Donohue, K. (2018). The deci-sion to recall: A behavioral investigation in the medical device industry.Journal of Operations Man-agement, 62, 1–15.
Barratt, M., Choi, T., & Li, M. (2011). Qualitative case studies in operations management: Trends, research outcomes and future research implications.Journal of Operations Management, 29, 329–342.
Baumard, P., & Starbuck, W. H. (2005). Learning from failures: Why it may not happen.Long Range Planning, 38, 281–298.
Bendoly, E., Croson, R., & Goncalves, P. (2010). Bodies of knowledge for research in behavioral operations.Production and Operations Management, 19, 434–435.
Biemans, W. G., Griffin, A., & Moenaert, R. K. (2016). New service development: How the field devel-oped, its current status and recommendations for moving the field forward. Journal of Product Inno-vation, Management, 33, 382–397.
Boyer, K., Hallowell, R., & Roth, A. (2001). E-services: Operating strategy—A case study and a method for analyzing operational benefits.Journal of Oper-ations Management, 20, 175–188.
Brauner, P., Philipsen, R., Fels, A., Fuhrmann, M., Ngo, Q. H. A. O., Stiller, S., Schmitt, R., & Ziefle, M. (2016). A game-based approach to raise qual-ity awareness in ramp up processes. Quality Man-agement Journal, 23, 55–69.
Buehler, R., Griffin, D., & Ross, M. (1994). Exploring the “planning fallacy”: Why people underestimate their task completion times. Journal of Personality and Social Psychology, 67, 366–381.
![FIGURE 1Case 1 Service Supply Chain [Color figure can be viewed at wileyonlinelibrary.com]](https://thumb-us.123doks.com/thumbv2/123dok_us/9420556.444890/7.594.63.491.107.377/figure-service-supply-chain-color-gure-viewed-wileyonlinelibrary.webp)