A Study of Data Continuity in Adult
Social Care Services
Sarunkorn Chotvijit
1,*, Malkiat Thiarai
1,2and
Stephen A. Jarvis
11Warwick Institute for the Science of Cities, University of Warwick, Coventry, CV4 7AL, UK
2Information, Technology & Digital Service, Birmingham City Council, Birmingham, B1 1BR, UK
*Correspondence to Sarunkorn Chotvijit, Warwick Institute for the Science of Cities, University of Warwick, Coventry, CV4 7AL, UK. E-mail: [email protected]
Abstract
Financial challenges in adult social care services are a considerable concern for UK government. With an ageing population, UK local authorities were reported to have spent £168 million more than budgeted in 2015–16 and had struggled to maintain care quality and manage unprecedented demand. We report on the assessment pro-cess employed in adult social care in Birmingham, the UK’s second largest city, and use data-analytic methods to examine the flow and continuity of data from referral, through the assessment process, to the resulting service provision. We identify the decision-making points and the data recorded for service users throughout the work-flow. Data are derived from the local government social care system in Birmingham and span 2013–16. Findings highlight the complexity of the social care system, the fragmentation of the data and the discontinuity of data flow within the system. This data analysis resulted from a two-year study commissioned by Birmingham City Council as part of the ‘case for change’ following several poor Ofsted reports. Our commission was to understand what could be ascertained from a data-led investi-gation, independently of how the data were collected and used. This research estab-lishes the foundation for service improvement and potential resource savings.
Keywords:Assessment, data analysis, local government, service users, social care
Accepted: August 2018
Introduction
The social care assessment process captures an important interaction be-tween local government and individuals. According to the Care Act (2014), a local authority must have regard to an individual’s assessment of their needs, an individual’s views and beliefs, their well-being and those of friends and relatives who may be caring for them, and must be flexible in terms of individual rights and the participation of recipients in the decision-making process (Lea, 2014).Milneret al. (2015)note that the flexibility of assessment is impacted by the fact that assessment is of-ten a continuous process.
The proportion of service recipients who require assessment in the UK remains high, particularly for older adults (NHS Digital, 2011, 2014,
2016a, 2016b): 46 per cent of referrals in 2014 received an assessment and, in 2015–16, approximately 0.9 million people received state-funded social care services in England. Changes in demographics adds to the complexity of the assessment process (Kane and Kane, 2004; Clarke, 2011). At the same time, changes to social care services, resulting from minor or major care-planning reviews, should be seamless from the point of view of the care-recipient (Walker and Beckett, 2003). This creates significant challenges for local government because needs and outcomes must be serviced equitably, regardless of the fact that the mechanism for meeting needs will differ, depending on local circumstances and individ-ual preferences (Abendstern et al., 2011).
Adult social care in England has seen major restructuring over time and this has led to the introduction of ‘personalisation’, where an indi-vidual is placed at the heart of service provision to maximise accessibil-ity and reinforce personal solutions (Leadbeater et al., 2008; Lymbery, 2014). Person-centred services assist individuals in retaining more con-trol over services they receive. There is some evidence that this has led to a reduction in spending on services for older adults by local authori-ties (Humphries, 2011). However, other studies suggest more mixed evi-dence for personalised services reducing local authority spend (Slasberg
et al., 2012,2013;Zamfir, 2013).
and cognition, learning disability and mental health (NHS Digital, 2016b). Alongside the funding gap, councils with social care responsibili-ties spend roughly 30–35 per cent of their total budget on adult social care (Local Government Association, 2016). The Association of Directors of Adult Social Services (2016) (ADASS) suggest that neces-sary savings to adult social care budgets by local authorities—approxi-mately £940 million—could not be reached without serious consequences for front line services.
Good-quality assessments are required to support personalisation for the individual. However, it is possible that accessibility to services for people with significant needs might still be limited; social care professionals are still required to make a judgement about eligibility before co-producing a response in accordance with the client concerns and outcomes they are seeking. Data will also be input in concurrent streams, and therefore the decision-making points could also contribute to rate limiting in the process over time (Cooper et al., 2011). Historically, there has been interest in us-ing case-review systems, monitorus-ing tools that support social work service provision to clients, while promoting the use of new technology for digital-based record keeping (Goldberg and Warburton, 1979). Using data from existing assessment documents provides the basis for identifying require-ments and improving decision making (Fosteret al., 2008).
and support needs, councils have proposed methods to embed new ‘cus-tomer journeys’ into the care system (Birmingham City Council, 2015).
The data analysis documented in this article is a result of a two-year study commissioned by Birmingham City Council, as part of an agreed ‘case for change’ following several poor Ofsted reports. Our commission was to understand what could be ascertained from a data-led investigation, independently of the context of how the data were collected and used. We use data-analytic methods to examine the flow and continuity of data from referral, through the assessment process, to the resulting service provision. We identify the decision-making points and the data recorded about service users throughout the workflow. Data are derived from the local govern-ment social care system in Birmingham and span the years 2013–16.
Process assessment proceeds in a similar manner to the Assessments and Packages of Care return (RAP) and the Adult Social Care Combined Activity return (ASC-CAR) in NHS Digital (2014, p. 119). Related studies have explored the relationship and proportion of service provision for children under the age of five and their safeguarding sys-tems (Bilson and Martin, 2016). Other studies have used data-analytic techniques on different applications in the social care domain: for exam-ple, decision trees have been employed to improve the decision-making options of social workers in order to improve service outcomes (O’Sullivan, 2011); correlational analysis has been applied to explore the relationship between service demand, failure demand and workforce sta-bility (Hoodet al., 2016).
Birmingham and its city council
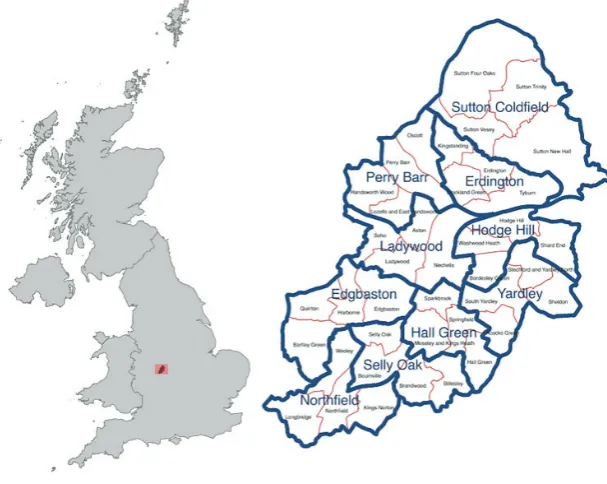
Birmingham City Council (BCC) is the local government body responsi-ble for the governance of Birmingham, the UK’s largest and most popu-lous city outside of London, with a population of over 1.1 million people (ONS, 2015). Birmingham is managed through division into ten council constituencies and forty electoral wards (see Figure 1). BCC is the larg-est local authority in Wlarg-estern Europe and expenditure in 2016–17 was £3.094 billion, of which £805 million was spent on services for people. Birmingham is a young and diverse city; the population of adults and older adults is reported to have increased by more than 10 per cent since 2013 (ONS, 2015) and now accounts for more than 75 per cent of the to-tal population in the city (ONS, 2013).
Performance of adult social care
BCC commissioned this research to build evidence that would assist with assessment of demand, analysis of process and identifying opportunities for service improvement and budget reductions. The Council Business Plan 2016 (Birmingham City Council, 2016) provides the context for this research, identifying: (i) seamless health and social care provision, so peo-ple can get the service they require or the correct information and advice in one place, with people who need services able to access these irrespec-tive of who the provider is; (ii) citizens having greater control and inde-pendence and making informed choices about care providers, support they require and place of delivery, with all citizens with an eligible care having access to either a Direct Payment or individual budget.
Net expenditure on adult social care for Birmingham in 2014–15 was £272.5 million, from which £202.8 million (74.4 per cent) was spent on directly providing care to citizens, buying care from other organisations and providing Direct Payments (money paid by the council to indepen-dently meet assessed care needs).Table 1 shows that the largest contri-butions from the £202.8 million 2014–15 budget-funded services for people aged sixty-five and over (44.2 per cent) and for those aged eigh-teen to sixty-four with learning disabilities (33.7 per cent).
[image:5.442.73.377.62.304.2]BCC has continued to face cuts in its grants from central government. In 2014–15, Birmingham’s adult social care services needed to make net
savings of over £32 million—approximately 16 per cent of its annual spend (Birmingham City Council, 2016). This research focuses specifi-cally on adult social care from the initiation of the request of the service. In particular, we sought to:
understand the data-creation and -collection process and the structure of social care, including different phases of the assess-ment process;
understand the data flow of the process for adult social care service users;
identify possible areas for further investigation, with a particu-lar focus on underpinning future processes that would allow the council to meet its savings targets.
The research revealed significant challenges with the assessment data, highlighting issues in data capture between referral and service delivery. Given that these data underpin future strategic decision making, these findings were considered to offer substantial new insight.
Assessment process
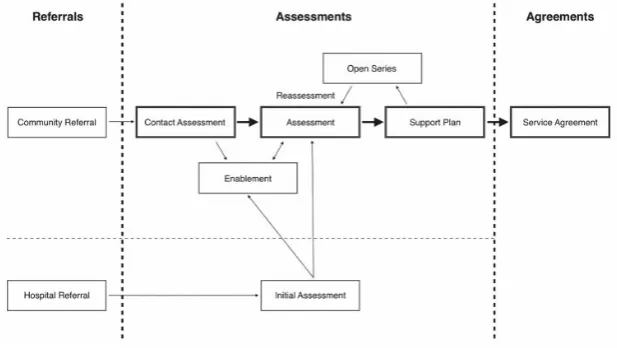
To understand the assessment processes, we study the data flow as it is captured for a client from the initial request for social care support to the council. There are two principal routes into social care in Birmingham: (i) community referrals and (ii) hospital referrals. The data in this research show a 65:35 ratio of people receiving care through the community against hospital referrals. The referral process is then sup-ported by a number of linked processes, as seen inFigure 2.
Referrals
[image:6.442.56.380.68.143.2]A community referral can be generated by the service users themselves, a family member, a general practitioner or others with concerns for the welfare of an individual. A hospital referral, on the other hand, will re-quire input from a relevant social care assessor employed by the author-ity to make a primary social care need decision for that individual.
Table 1Total adult social care net expenditure of 2014–15
Category Cost
Older peoples’ services £89.7 million
Adults with learning disabilities £68.4 million
Adults with physical disabilities £20.7 million
Older adult services £15.2 million
Additional information from the social worker may be added to com-plete the referral process:
Community Referral (CR): referrers have an opportunity to dis-cuss the referral with a qualified social worker to determine the next step;
Hospital Referral (HR): referral is created as part of the dis-charge plan for an inpatient, categorised as (i) a hospital refer-ral for a new client or (ii) a hospital referrefer-ral for an existing client who is currently receiving a service but has now been ad-mitted to hospital.
Assessments
The recording of the assessment process in BCC’s CareFirst system con-sists of six sub-processes:
Contact Assessment (CA): a screening-level assessment to pro-vide information and record clients’ basic information before transferring the case for further consideration;
Initial Assessment (IA): creating a concise assessment, carried out twenty-four to forty-eight hours after receipt of the referral;
[image:7.442.71.380.60.234.2]Assessment (AS): a record of the discussion between the eligi-ble client and the social worker to determine the level of the individual’s needs; the focus will include the eligibility of the client and the options available to meet their needs;
Support Plan (SP): details the services that the client is eligible for, including their duration and location, based on the out-come of the assessment;
Enablement (ENB): a short-term support option with no charge, normally consisting of an intense six-week period of home support and homecare to help a client regain their independence;
Open Services (OS)/Reassessment (RE): where changing cir-cumstances and level of need are reassessed in the SP or assessment.
Agreements (AG)
The service agreement refers to the contract between the council and the commissioned service provider to deliver the SP.
Adult social care eligibility
An assessment is carried out to establish whether a citizen may be eligi-ble for social care services. During the period covered by the data, prior to April 2015, the eligibility threshold was set locally, based on the Fair Access to Care directive. New criteria came into effect in April 2015, as set out in the Care Act and its statutory guidance (Lea, 2014). The Care Act needs assessment employs a three-stage test that establishes (i) whether needs are connected with disability or illness, (ii) whether those needs prevent an individual achieving two or more outcomes, from a list that includes criteria such as managing and maintaining nutri-tion, being appropriately clothed and being able to care for dependent children, and (iii) whether this then impacts the individual’s well-being (House of Parliament, 2014). As the data utilised in this study cover both regimes, the impact of these changes is explored further as part of the qualitative exploration of the data flow in the assessment process.
Care service assessment and agreement data
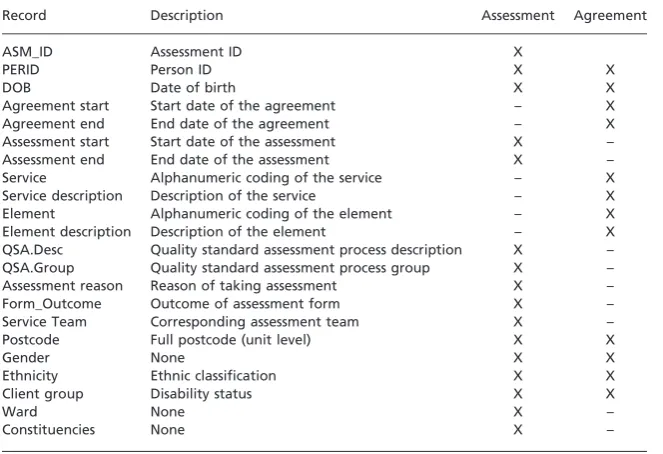
Data used in this research are derived from structured assessment and service agreements, which are extracted from BCC’s CareFirst informa-tion system.
processes were experiencing a period of change at that time, in prepara-tion for and during the adopprepara-tion of Care Act changes. The data sub-sample included over 69,147 distinct users, registered for more than 238,000 assessments and comprising eight major assessment sub-processes. Each extracted assessment consisted of sixteen associated variables.
For agreements, open and closed data for the same period were used to study the progress of individuals. The data included over 29,385 dis-tinct people and more than 90,600 service agreement records. Each ser-vice agreement consists of twelve records (seeTable 2).
We note that there will be some duplication of individuals with such categorisation, as a person may be registered for more than one assess-ment and agreeassess-ment within a period.
The data were further filtered and focused on four core sub-processes: contact assessment, assessment, support planning and service agreement (seeTable 3).
Process completion
[image:9.442.63.395.367.594.2]Each assessment-process stage should be subject to a completion status, reflecting the decision made during that sub-process. Our investigation of possible completion statuses has identified forty-two different options.
Table 2The service assessment and agreement records used in this study
Record Description Assessment Agreement
ASM_ID Assessment ID X
PERID Person ID X X
DOB Date of birth X X
Agreement start Start date of the agreement – X
Agreement end End date of the agreement – X
Assessment start Start date of the assessment X –
Assessment end End date of the assessment X –
Service Alphanumeric coding of the service – X
Service description Description of the service – X
Element Alphanumeric coding of the element – X
Element description Description of the element – X
QSA.Desc Quality standard assessment process description X –
QSA.Group Quality standard assessment process group X –
Assessment reason Reason of taking assessment X –
Form_Outcome Outcome of assessment form X –
Service Team Corresponding assessment team X –
Postcode Full postcode (unit level) X X
Gender None X X
Ethnicity Ethnic classification X X
Client group Disability status X X
Ward None X –
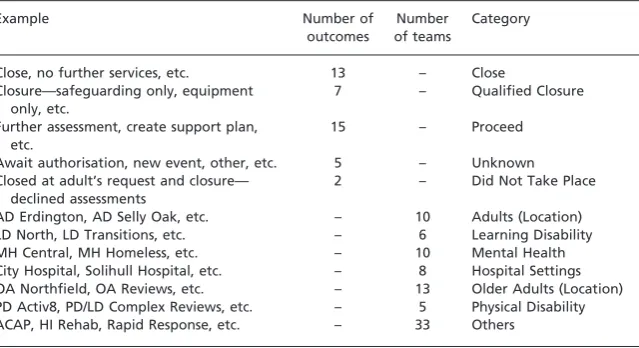
For the purposes of this research, we group the forty-two different out-comes into five categories (seeTable 4).
‘Proceed’, ‘close’ and ‘did not take place’ are self-explanatory. ‘Qualified closure’ refers to an assessment process that has ended, but requires more data or denotes a subsequent assessment process follow-ing a hospital admission. Finally, ‘unknown’ refers to either an unknown outcome or a data-quality issue.
Data cleansing and pre-processing
The data contained 432 service teams supporting social care across the city. The teams are mapped with team codes provided by the council; this map-ping allows us to reduce the service teams to eighty-five with seven catego-ries; this distribution will be used during the case studies (seeTable 4).
[image:10.442.57.378.79.142.2]Pre-processing scripts and the statistical tools in R are used, removing erroneous characters, conducting range checks and identifying missing values (Ihaka and Gentleman, 1996; R Core Team, 2013). Of the
Table 3Number of service records and unique individuals of the sub-process in the assessment process
Process Number of records Number of individuals
Contact assessment 124,575 56,701
Assessment 37,581 26,632
Support plan 42,593 23,936
Service agreement 94,400 29,385
Table 4The category of form of outcome and corresponding team and the samples
Example Number of
outcomes
Number of teams
Category
Close, no further services, etc. 13 – Close
Closure—safeguarding only, equipment only, etc.
7 – Qualified Closure
Further assessment, create support plan, etc.
15 – Proceed
Await authorisation, new event, other, etc. 5 – Unknown
Closed at adult’s request and closure— declined assessments
2 – Did Not Take Place
AD Erdington, AD Selly Oak, etc. – 10 Adults (Location)
LD North, LD Transitions, etc. – 6 Learning Disability
MH Central, MH Homeless, etc. – 10 Mental Health
City Hospital, Solihull Hospital, etc. – 8 Hospital Settings
OA Northfield, OA Reviews, etc. – 13 Older Adults (Location)
PD Activ8, PD/LD Complex Reviews, etc. – 5 Physical Disability
[image:10.442.58.378.178.352.2]292,343 assessments studied, 54,193 (18.53 per cent) are removed be-cause of ‘bad data’; the majority of these involve (i) missing values, (ii) unreadable or invalid data records and/or (iii) unknown, invalid or out-of-range age entries.
We employ open-source geographical information systems to perform spatial-temporal mapping. Eastings and Northings—geographic cartesian coordinates for eastward and northward-measured distances—are trans-formed into latitude–longitude coordinates using the ‘rgdal’ package in R.
Initial findings
Our analysis seeks to understand the relationship between different stages of the assessment process, from referral to agreement in the CareFirst sys-tem. We first look at the continuity and structure of the process flow (see
Figure 2). This may reflect the quality of care and impact on the effective-ness of service delivery (McCormacket al., 2008), and/or reflect character-istics of and interaction with the system itself. The flow suggests a linear pattern of referrals, where each sub-stage should contain a decision that either closes the assessment or proceeds to the next stage. Analysis of the continuity of the assessment process is based on three-plus-one (agree-ment) sub-processes (highlighted in bold inFigure 2).
We identify the number of unique recipient records in each sub-process using the unique identifier assigned to every recipient. From the data-flow standpoint, this step might assume results would show a flow of individuals’ information through the process, either ending in a ser-vice being delivered or a record of a decision closing the assessment: we recognise that, due to the limitation of the system, ‘shortcuts’ may be made as practitioners seek to make their jobs more manageable.
The results yield interesting findings. First, there are numerous service users who appear in sub-stages without appearing in earlier stages. Second, whilst the numbers of users moving from CA to AS drops considerably (expected if the service users’ needs cannot be met), the records do not re-flect the closure of assessment. Rather, many records report users requiring further assessment. Third, of the total number of unique individuals in the data-sets, only 40 per cent appear in all four sub-processes. An analysis of the flow of all recipients in the assessment process is highlighted.
We present a more detailed analysis of results through three case studies.
Case study 1: qualitative exploration of data flow in the
assessment process
four core sub-processes (not from HR, IA, Enablement (ENB) and Open Services (OS)/Reassessment (RE)) and that the focus is quality and flow of data, not why it is as such.
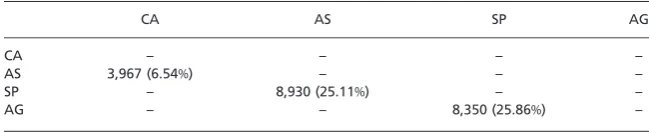
The study concentrates on three linked processes: CA to AS, AS to SP and SP to AG. To improve our understanding of each sub-process, a matrix is generated to examine the flow of data through these linked processes. Findings highlight that as many as a quarter of individual records appear in a stage but not the proceeding stage. For example, 8,350 recipients received agreements but did not have a corresponding SP. To understand the potential anomalies, we considered other sub-processes that are in place and that may account for these figures; we expand on this below.
Assessment is a complex process in which information can be recorded and obtained in several ways. We explore other possible data-sets that could potentially help explain the source of individuals: (i) data from other sub-processes such as HR, IA and RE named as HIR; (ii) data from the ENB stage; and (iii) data from excluded lists. Table 5
[image:12.442.55.379.401.474.2]highlights the numbers from all three sources. ENB is obtained by extracting its related records from open/closed agreement data. The ex-cluded list refers to a CA where there are insufficient data for the coun-cil to take forward the case.
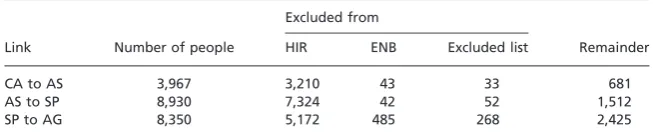
Table 6 uses information fromTable 7. The records are then matched and linked using personal identity numbers to those external sources. The results show that there are still 681 (2.55 per cent of AS clients), 1,512 (6.3 per cent of SP clients) and 2,425 (8.25 per cent of AG clients)
Table 5Number of people involved in other non-core stages within the assessment process
Sub-process name Number of people
Hospital Referral (HR) 22,771
Initial Assessment (IA) 15,628
Reassessment (RE) 16,344
Enablement (ENB) 9,363
[image:12.442.53.380.522.592.2]Excluded List 10,773
Table 6Number of people who are filtered from HIR, ENB and excluded list
Excluded from
Link Number of people HIR ENB Excluded list Remainder
CA to AS 3,967 3,210 43 33 681
AS to SP 8,930 7,324 42 52 1,512
unique individuals whose information does not appear in the previous adjacent stage.
In addition to analysing the complete data-set, the matrix-base method shown in Table 7 is also applied to the data pre and post April 2015 (recognising the change in eligibility criteria at this time). Two findings were apparent: first, that the pattern of individual’s data being recorded in one stage of the process but not in the preceding stage remains a feature of the recording process; second, that the data after April 2017 involve around 10,000 fewer service users, which may be a reflection of the new Care Act eligibility criteria. There is further scope to study in more detail the impact of the introduction of the 2015 Care Act on BCC’s processes and data; this remains the topic of future research.
The analysis of mapping the data emphasises the complexity of data recording in assessment processes. The analysis of the complete data-set identified approximately 4,500 service users who cannot be accounted for when considering their entrance or exit from the social care process. The case study shows the fragmented nature of the data across the four-year period and the two assessment regimes. It should be recognised that this is a data-led study and therefore does not reflect the use of the system by practitioners. There are likely to be elements of the process that are not recorded or cannot be recorded easily due to system limita-tions and/or practical workarounds.
Case study 2: identifying anomalies in the assessment
process
[image:13.442.62.387.68.134.2]We examine 27,238 unique individuals whose information is only present in CA and investigate the outcomes associated with each. This, as with Case study 1, demonstrates a significant number of cases where recorded data do not flow sequentially between and through stages. The CA sub-process represents the start of the workflow, and should therefore in-clude a decision to proceed or not as part of the assessment process. It is assumed therefore that some client information would only appear in this stage and not subsequent stages.
Table 7Matrix of number of people who appear in a stage but not the proceeding stage
CA AS SP AG
CA – – – –
AS 3,967 (6.54%) – – –
SP – 8,930 (25.11%) – –
To understand how data are being recorded in the system, we con-sider the recorded outcomes in CA. We explore other sources that may explain the number of records in CA, including referral to enablement services or records appearing in the excluded list. The results reveal that 124 unique people are progressed to the ENB stage and, by matching people to the excluded list, we filter 2,298 individuals from the CA data. Therefore, we investigate a total of 24,816 remaining CA records.
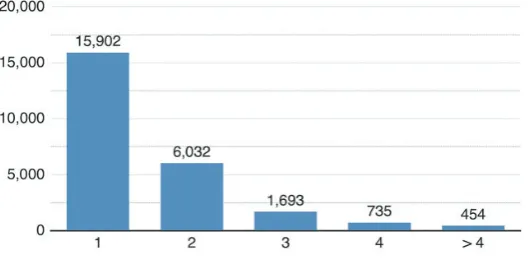
Figure 3 reflects the number of assessments a person receives within CA. Sixty-four per cent of people receive a single assessment. If the pro-cess is followed correctly, then, for each single assessment, there should be a corresponding record reflecting one of the possible ‘closed’ catego-ries set out inTable 2. However, the data reveal that, instead of closure (CL), 53 per cent of records highlight the need for further assessment (FA), which indicates that the record should be held for revision or pro-gressed to AS for additional support.
The impact upon clients whose records denote FA is significant in the context of access to services, as is the ability to manage demand in an environment where savings need to be made. The absence of a recorded closure of assessment at this stage leads to questions about the reliability of service user data in the CareFirst system and also the outcomes for the service users. Furthermore, this may also reflect an unmet care need that will require management in the future.
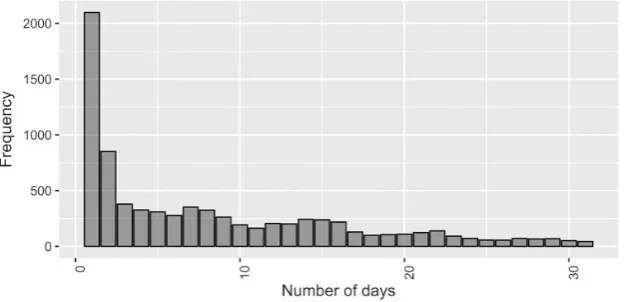
Start and end assessment dates indicate when people register for as-sessment and for how long. These variables can be used to calculate the length of assessment in days (see Figure 4). The graph illustrates a high correlation between frequency of start and end dates; 94 per cent of individuals end their assessment within the first month and almost 58.5 per cent leave the process within a week.
The data expose a relationship between assessment duration and forms of outcome. People who are assigned to FA as an outcome
normally terminate the assessment within ten days, compared to slightly more than two weeks for those who are assigned to CL, despite being a larger proportion. The data also show that 25 per cent of people with FA as an outcome are assessed within a day—about 5 per cent higher than those from CL. The fact that the FA occurs earlier than a CL within the group is another unexpected finding from the data.
We also investigate the provision of assessments by location. Ward regions are used to display the geographical dispersal of people who re-ceive one assessment over the period. To address low numbers of assess-ments per ward and a fluid population, the frequency of records per ward is normalised by the total population per ward from the Birmingham 2011 census (ONS, 2013). The colour of the area is determined by the number of people who only register for one assessment per 1,000 of the population; a darker area indicates that more people have been assessed (Figure 5). Note that this case study only includes unique individual records.
The map displays where there is only one documented response at the CA stage across the city region. A deeper analysis of the one documented re-sponse in Figure 5 allows us to explore the proportion of those responses that are either stated as CL or FA inFigure 6. The colour of the area is de-termined by the ratio of outcome, FA against CL per 1,000 population; a darker area indicates that more people are assigned to FA. By identifying possible locations where FA is a significant outcome recorded, it may be pos-sible to target these areas to better understand the reasons behind these data.
Case study 3: characteristics of completed stages
[image:15.442.71.384.59.210.2]We also investigate the progress of service users through the sub-processes and the outcomes of each stage. The data show that 11,575
people (16.42 per cent) of a total of 70,474 successfully progress through the assessment process to receive a service. However, this only accounts for 40.57 per cent of individuals at the AG stage.
Our analysis maps the outcomes and corresponding assessment teams for all registered people in the assessment process (Table 3); Figure 7
displays these results as a matrix, matching outcome groups (rows) to as-sessment teams (columns), using the supporting data set out in Table 4
that determine the number of subgroups in each category. The groups are then ordered alphabetically (see sample at the top left sub-figure of Figure 8). Individuals whose information consists of two or more distinct outcomes and/or teams are excluded to avoid record bias; this accounts for only 0.8 per cent of all unique recipients.
The colour indicates the magnitude of people involved in each crite-rion; a darker shade represents fewer people and, in contrast, the lighter shades are graded by percentile distribution—the darkest cells denote a frequency at the (lowest) 10th percentile and the brightest cells form the 95th percentile. The light-grey grid in the matrix helps to distinguish the boundary of each group and aids interpretation among the sub-processes.
[image:16.442.64.373.57.332.2]The representation of data in Figure 8 allows us to focus on emerging patterns in the data at each sub-process. The top left sub-figure displays a sample of how the format and layout of the remaining matrix cells are displayed. The two key findings from the matrix are that:
The ‘proceed’ outcome indicates where service users require further support from the council. The corresponding team that accounts for most of the decision making for ‘FA’ in CA is Adults and Communities Access Point (ACAP) (70.69 per cent), who initiate the contact assessment, collect and triage users’ ba-sic information, and assign the assessment where appropriate. FA of the outcomes also causes us to reflect on the quality and the accuracy of data collection in the assessment process by the council. Given these findings, the council might consider reduc-ing the number of possible assessment outcomes.
[image:17.442.72.381.58.334.2]The ‘unknown’ outcome indicates an absence of sufficient data for an accurate determination to be made regarding the assess-ment. Interestingly, the matrix shows that there are significantly fewer unknown outcomes recorded in the CA process than
there are in the AS process. In theory, none of the ‘unknown’ outcomes should appear at the AS stage. This is unusual, as the ‘unknown’ refers to key data that are unavailable and should have been considered at the CA part of the process. The data
also show that these assignments are mostly handled by hospi-tal-related subgroups. In contrast to the previous key finding, this potentially highlights poor nomenclature and/or miscom-munication and co-ordination between social workers in differ-ent departmdiffer-ents along the workflow from CA to AS.
Overall, the data expose that, within each outcome group, especially in ‘close’ and ‘proceed’, many subgroups are recorded using similar headings. For example, ‘plan finalised’ and ‘support plan finalised’ in the ‘proceed’ outcome have identical meanings. This adds further evi-dence to Case study 1 and our argument regarding the inconsistencies in the recording of outcomes in the system by practitioners, which requires further investigation by the council. The case study suggests merging outcomes and standardising terminology, both of which should go some way to ensuring better data collection across the assessment process.
This case study has sought to understand the flow of data through the assessment process and identify gaps among the sub-processes. We be-lieve that, by taking a data-driven approach to this topic, it will lay the foundation to better data collection and analysis, upon which better planning, budget setting and financial scrutiny can be built.
Discussion
This research sought to examine the assessment process for adult social care in Birmingham, including the creation and collection of data, the potential outcomes for service recipients at each stage of the process and identifying possible areas for consideration that may support (or im-pact on) proposed financial savings.
The assessment process in Figure 2 shows the complexity of the data flow for a service user from referral to agreement. There are a range of possible outcomes from this process and these are impacted by the qual-ity of the data available at each stage, as highlighted by the existence of an excluded list that contains details of those service users for whom there are insufficient data for the council to take any meaningful action.
The three case studies highlight a range of issues facing the council in managing and delivering services whilst attempting to meet difficult sav-ings targets as part of the budget-setting processes; the case studies also indicate that these challenges are compounded by aspects of data collec-tion and management.
number of cases, be using workarounds to data input. In the context of financial analysis, this highlights a significant risk to the council achiev-ing budgetary savachiev-ings as well as their ability to plan for future demand for services.
The second study investigates the extent to which records are com-plete at any sub-stage in the process. The data again highlight a signifi-cant proportion of the records as incomplete and yet no further action is recorded to have been taken. We also identify anomalies with regard to the higher proportion of FAs against CL. Three-quarters of all wards in Birmingham display a higher proportion of FA to CL out-comes by the end of the first sub-stage of the process. Without further investigation, it is difficult to understand the rationale behind the ab-sence of the data as well as the fragmented process. However, its po-tential impact upon both the service users and the council could be significant.
The last study considers frequency of service use. This can be crucial for future planning and commissioning of services, as well as for the development of the social care tendering process and for third-party pro-viders, in that this provides some certainty of the profile of service users and their needs. This study also highlights the difficulty of future budget planning for the local authority.
Limitations
Although several significant outcomes have been identified in this re-search, limitations are also exposed. First, the analyses rely on a single administrative data source. Other forms of assessment data could help explain the rationale behind some of the assessment decisions found in the CareFirst data. Second, whilst the data used for the analyses are considered ‘good-quality’, during the pre-process stage, some data records were removed because of corrupt fields. This will have some (although we believe limited) impact on the results and strength of analysis. Third, the related work is restricted to that which combines the social care assessment process with administrative data; broader studies clearly exist but, for the sake of brevity, we restrict our litera-ture survey. Finally, the research recognises that human input into the CareFirst system is not linear in the way that is described in Figure 2. The system is more than ten years old and is therefore likely to be lim-ited in its flexibility.
Conclusions and future work
This article explores the continuity of data associated with adult social care assessment in the city of Birmingham, the UK’s second largest city. We use data-analytic techniques to examine the flow of information from referral through the assessment process and the resulting service provision between 2013 and 2016, using data from the local authority’s internal CareFirst system. In a similar manner to the rate-limiting tech-niques of Cooper et al. (2011), we identify the decision-making points throughout the process, to understand and analyse the service users’ data. The paper presents three case studies to illustrate key findings, highlighting the complexity of social care services, the fragmentation of the processes and the discontinuity of information flow within the sys-tem. The issues identified will help isolate areas for service improvement and, as a result, potential resource savings.
Future work will consider human interaction with the CareFirst sys-tem from both an assessment practitioner and service users’ perspective. We hope that, by doing this, we can expose real-life interaction and pro-cess flow that reflects a more temporal picture of data collection and decision-making processes. This may go some way to accounting for the anomalies that we have discovered in our work thus far.
Acknowledgements
The lead author gratefully acknowledges funding support by the UK Engineering and Physical Sciences Research Council (EPSRC) for the Centre for Doctoral Training in Urban Science and Progress under Grant number EP/L016400/1. The authors also thank Birmingham City Council for providing support and data access for this research.
Funding
This work was financially supported by the UK Engineering and Physical Sciences Research Council (EPSRC) under Grant number EP/ L016400/1.
Conflict of interest statement. None declared.
References
Association of Directors of Adult Social Services (2016) ‘ADASS Budget Survey 2016 Report’, available online at https://www.adass.org.uk/media/5379/adass-bud get-survey-report-2016.pdf (accessed on 4 September 2018).
Audit Commission (2011) ‘Improving value for money in adult social care’, available on-line at https://www.housinglin.org.uk/_assets/Resources/Housing/Support_materials/ Other_reports_and_guidance/Improving_Value_for_money_in_Adult_Social_Care.pdf (accessed on 4 September 2018).
Audit Commission (2012) ‘Reducing the cost of assessments and reviews: An adult social care briefing for councils’, available online at http://www.scie-socialcareon line.org.uk/reducing-the-cost-of-assessments-and-reviews-an-adult-social-care-brief ing-for-councils/r/a11G00000017yXlIAI (accessed on 4 September 2018).
Bilson, A. and Martin, K. E. C. (2016) ‘Referrals and child protection in England: One in five children referred to children’s services and one in nineteen investi-gated before the age of five’,British Journal of Social Work,47(3), pp. 793–811. Birmingham City Council (2015) ‘How are we doing? The local performance account
for directorate for people adults’ social care services’, available online at https:// www.birmingham.gov.uk/downloads/file/104/how_are_we_doing_-_adult_social_care_ services_-_2014-15 (accessed on 4 September 2018).
Birmingham City Council (2016) ‘Business plan and budget 2016þ’, available online at https://www.birmingham.gov.uk/download/downloads/id/1696/birmingham_city_ council_business_plan_and_budget_2016.pdf (accessed on 4 September 2018). Care Act (2014)Care Act 2014, Chap. 23, London, TSO.
Clarke, A. (2011) ‘How can local authorities with less money support better outcomes for older people?’, available online at https://www.jrf.org.uk/report/how-can-local-authorities-less-money-support-better-outcomes-older-people (accessed on 4 September 2018).
Cooper, G., Sherlock, K. G. and Hoy, M. (2011) ‘Method and apparatus for rate lim-iting’, McAfee LLC. U.S. Patent 7,917,647.
Department of Health (2010) ‘A vision for adult social care: Capable communities and active citizens’, available online at http://www.cpa.org.uk/cpa_documents/vi sion_for_social_care2010.pdf (accessed on 4 September 2018).
Department of Health (2016) ‘Personalised commissioning in adult social care’, avail-able online at https://www.nao.org.uk/wp-content/uploads/2016/03/Personalised-commissioning-in-adult-social-care-update.pdf (accessed on 4 September 2018). Foster, M., Harris, J., Jackson, K. and Glendinning, C. (2008) ‘‘Practitioners’
docu-mentation of assessment and care planning in social care: The opportunities for organizational learning’,British Journal of Social Work,38(3), pp. 546–60. Glasby, J. (2011) ‘Adult social care’, in Yeates, N., Haux, T., Jawad, R. and Kilkey,
M. (eds), In Defence of Welfare: The Impacts of the Spending Review, London, UK, Social Policy Association, pp. 30–2.
Goldberg, E. M. and Warburton, R. W. (1979) ‘Ends and Means in Social Work: The Development of Outcome of a Case Review System for Social Workers’,George Allen and Uwin, Journal of Social Policy,10(3), p. 155.
HM Treasury (2010) ‘Spending review 2010’, available online at https://www.gov.uk/ government/uploads/system/uploads/attachment_data/file/203826/Spending_review_ 2010.pdf (accessed on 4 September 2018).
House of Parliament (2014) ‘The care and support (eligibility criteria) regulations 2014: Social care, England’, available online at https://www.legislation.gov.uk/ ukdsi/2014/9780111124185/pdfs/ukdsi_9780111124185_en.pdf (accessed on 4 September 2018).
Humphries, R. (2011) ‘Social care funding and NHS: An impending crisis?’, available online at https://www.kingsfund.org.uk/sites/default/files/Social-care-funding-and-the-NHS-crisis-Kings-Fund-March-2011.pdf (accessed on 4 September 2018). Ihaka, R. and Gentleman, R. (1996) ‘R: A language for data analysis and graphics’,
Journal of Computational and Graphical Statistics,5(3), pp. 299–314.
Kane, R. L. and Kane, R. A. (eds) (2004) Assessing Older Persons: Measures, Meaning, and Practical Implications, New York, NY, Oxford University Press. Lea, W. (2014) ‘Assessment and eligibility’, inSection 6, Care and Support Statutory
Guidance: Issued under the Care Act 2014, available online at www.legislation.gov. uk/ukpga/2014/23/pdfs/ukpga_20140023_en.pdf (accessed on 4 September 2018). Leadbeater, C., Bartlett, J. and Gallagher, N. (2008) ‘Making it personal’, available
online at http://www.partnerships.org.au/Making%20It%20Personal.pdf (accessed on 4 September 2018).
Local Government Association (2016) ‘Adult social care funding: 2016 state of the nation report’, available online at https://www.local.gov.uk/adult-social-care-fund ing-2016-state-nation-report (accessed on 4 September 2018).
Lymbery, M. (2014) ‘Austerity, personalisation and older people: The prospects for creative social work practice in England’,European Journal of Social Work,17(3), pp. 367–82.
McCormack, B., Mitchell, E. A., Cook, G., Reed, J. A. N. and Childs, S. (2008) ‘Older persons’ experiences of whole systems: The impact of health and social care organizational structures’,Journal of Nursing Management,16(2), pp. 105–14. Milner, J., Myers, S. and O’Byrne, P. (eds) (2015) ‘Assessment in Adults’ Services’, in
Assessment in Social Work,4th edn, Basingstoke, Palgrave.
NHS Digital (2011) ‘Community Care Statistics, Social Services Activity, England 2009–2010’, available online at https://digital.nhs.uk/catalogue/PUB01663 (accessed on 4 September 2018).
NHS Digital (2014) ‘Community care statistics: Social services activity, England—2013–2014’, available online at http://content.digital.nhs.uk/catalogue/ PUB16133 (accessed on 4 September 2018).
NHS Digital (2016a) ‘Community care statistics: Social services activity, England—2015 to 2016’, available online at https://www.gov.uk/government/statistics/community-care-statistics-social-services-activity-england-2015-to-2016-report (accessed on 4 September 2018).
NHS Digital (2016b) ‘Personal social services: Expenditure and unit costs, England—2015 to 2016’, available online at https://www.gov.uk/government/statis tics/personal-social-services-expenditure-and-unit-costs-england-2015-to-2016 (accessed on 4 September 2018).
ONS (2013) ‘2011 census: Key statistics for Birmingham and its constituent areas: KS101 usual resident population’, available online at https://www.birmingham.gov.uk/ download/downloads/id/4573/census_2011_ks101_usual_resident_populationpdf.pdf (accessed on 4 September 2018).
nandmigration/populationprojections/bulletins/nationalpopulationprojections/2015– 10-29 (accessed on 4 September 2018).
O’Sullivan, T. (2011) Decision Making in Social Work, 2nd edn, Basingstoke, Palgrave.
R Core Team (2013) R: A Language and Environment for Statistical Computing. Vienna, Austria, The R Foundation for Statistical Computing.
Slasberg, C., Beresford, P. and Schofield, P. (2012) ‘How self directed support is fail-ing to deliver personal budgets and personalisation’, Research, Policy and Planning,29(3), pp. 161–77.
Slasberg, C., Beresford, P., Schofield, P. and Harlow, E. (2013) ‘The increasing evi-dence of how self-directed support is failing to delivery personal budgets and per-sonalisation’,Research, Policy and Planning,30(2), pp. 91–105.
Walker, S. and Beckett, C. (2003) Social Work Assessment and Intervention, Lyme Regis, Russell House.