M E T H O D O L O G Y A R T I C L E
Open Access
Learning protein binding affinity using
privileged information
Wajid Arshad Abbasi
1,2,3, Amina Asif
1, Asa Ben-Hur
3*and Fayyaz ul Amir Afsar Minhas
1*Abstract
Background:Determining protein-protein interactions and their binding affinity are important in understanding cellular biological processes, discovery and design of novel therapeutics, protein engineering, and mutagenesis studies. Due to the time and effort required in wet lab experiments, computational prediction of binding affinity from sequence or structure is an important area of research. Structure-based methods, though more accurate than sequence-based techniques, are limited in their applicability due to limited availability of protein structure data. Results:In this study, we propose a novel machine learning method for predicting binding affinity that uses protein 3D structure as privileged information at training time while expecting only protein sequence information during testing. Using the method, which is based on the framework of learning using privileged information (LUPI), we have achieved improved performance over corresponding sequence-based binding affinity prediction methods that do not have access to privileged information during training. Our experiments show that with the proposed framework which uses structure only during training, it is possible to achieve classification performance comparable to that which is obtained using structure-based features. Evaluation on an independent test set shows improved performance over the PPA-Pred2 method as well.
Conclusions:The proposed method outperforms several baseline learners and a state-of-the-art binding affinity predictor not only in cross-validation, but also on an additional validation dataset, demonstrating the utility of the LUPI framework for problems that would benefit from classification using structure-based features. The implementation of LUPI developed for this work is expected to be useful in other areas of bioinformatics as well.
Keywords:Protein-protein interactions, Protein binding affinity prediction, Privileged information, Machine learning
Background
Protein interactions are crucial in cells for maintaining homeostasis and in regulating metabolic pathways involv-ing thousands of chemical reactions runninvolv-ing in parallel within an organism [1, 2]. Protein binding affinity is one of the most important aspects of protein interactions which determines protein complex stability and binding specificity and distinguishes highly specific binding part-ners from less specific ones [2]. Protein binding affinity is measured in terms of change in the Gibbs free energy upon binding (ΔG). The importance of measuring binding affinity has prompted the development of various
experimental techniques such as Isothermal Titration Calorimetry (ITC), Surface Plasmon Resonance (SPR), and Fluorescence Polarization (FP) which can be used to accurately measure the protein binding affinity [3–5].
However, these techniques involve laborious,
time-consuming, and expensive experimental procedures and cannot be applied at a large scale. As a consequence, accurate predictive computational methods can be very useful in this domain.
Machine learning based methods are important in this area because of their ability to treat unknown factors in-volved in protein binding implicitly and to learn a data-driven flexible functional form [6,7]. A number of machine learning based methods have been proposed both for predicting the absolute affinity value and to classify protein-protein complexes into low and high binding affinities using structure or sequence informa-tion [8–16]. Some of the structure-based methods give * Correspondence:[email protected];[email protected]
3Department of Computer Science, Colorado State University (CSU), Fort
Collins, CO 80523, USA
1Biomedical Informatics Research Laboratory (BIRL), Department of Computer
and Information Sciences (DCIS), Pakistan Institute of Engineering and Applied Sciences (PIEAS), Nilore, ISL 45650, Pakistan
Full list of author information is available at the end of the article
reasonable accuracy on predicting absolute binding af-finities on the affinity benchmark dataset [8, 10,11,15]. However, these methods have limited applicability be-cause they require 3D structures of protein complexes which are typically not available. On the other hand, state-of-the-art sequence-based methods for predicting binding affinity are not sufficiently accurate [12–14, 17,
18]. Therefore, accurate prediction of protein binding af-finity using sequence information is still an unsolved problem.
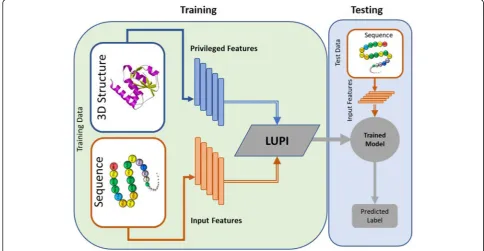
In this article, we present an implementation of the Learning Using Privileged Information (LUPI) frame-work for classifying protein complexes into low and high binding affinity. Our proposed method is different from previously proposed methods for the classification of protein complexes in that it uses both protein structural and sequence information during training but requires only sequence descriptors for testing (see Fig. 1). Using this method, we are able to utilize information from pro-tein complexes with known propro-tein 3D structures to learn a better model and still be able to predict binding affinities using sequence information alone during test-ing. This has led to a significant improvement in the ac-curacy in comparison to models which utilize only sequence information during training. We expect the LUPI framework to be very useful for other problems in bioinformatics, particularly problems that benefit from the use of protein 3D structures, such as protein
function prediction and prediction of protein-protein and protein-nucleic acid interactions.
Results
In this work, we describe a novel machine learning method to predict protein binding affinity using protein sequence and structure information. Previously, various machine learning models have been developed for this purpose using standard machine learning approaches using sequence or structure information. Typically, structure-based methods generate better predictions than sequence-based ones but are limited by the fact that structural information is not available for the vast majority of proteins. In the proposed method, we handle this constraint by following the learning using privileged information (LUPI) framework in conjunction with an SVM classifier (LUPI-SVM). In LUPI, a machine learn-ing model is built by uslearn-ing additional or more inform-ative features (called privileged space features) which are available only during training in addition to input space features that are available in both training and testing. The privileged information is expected to help the classi-fier converge to a better decision boundary in the input space, leading to better generalization. Applied to bind-ing affinity prediction, LUPI-SVM uses both protein se-quence and structure during training but at test time it uses only sequence-based descriptors. In what follows
we present results comparing the classification
[image:2.595.54.539.443.694.2]performance of LUPI-SVM to several baseline classifiers to illustrate the usefulness of this approach.
Protein binding affinity prediction with baseline learners using structure and sequence descriptors
We first compare the performance of sequence-based descriptors to structure-based ones on the task of classi-fying protein complexes as having low and high binding affinity. For this purpose, we have used a number of classifiers such as classical Support Vector Machines (SVMs), Random Forest (RF), and XGBoost as baseline classifiers with both sequence- and structure-based fea-tures. Results obtained with different types of structure and sequence-based features through leave one complex out (LOCO) cross-validation over the protein binding af-finity benchmark dataset version 2.0 [19] which has 128
complexes, are shown in Table 1. The sequence-based
features include k-mer composition and features com-puted using a Blosum substitution matrix to capture substitutions of physiochemically similar amino acids. For structure features, we have used Number of Interact-ing Residue Pairs (NIRP) to get the frequency of inter-acting amino acid pairs at the interface of a protein complex, Moal Descriptors which include statistical potentials, solvation and entropy terms and potentials for hydrogen bond, Dias Descriptors representing infor-mation related to binding assay pH, temperature, and methodology of determining experimental binding affin-ity, and Blosum-based features to capture the substitu-tions of physiochemically similar amino acids involved in the interface of a protein complex.
The results shown in Table 1 demonstrate that
structure-based features produce higher accuracy than sequence-based features for all the classifiers. For ex-ample, by using structure-based features during training
and testing, we observed area under the ROC curve of 0.74 and under the precision-recall curve (PR) score of 0.71 with the number of interacting residue pairs (NIRP) as features derived from the structure of the protein complex. On the other hand, sequence-based features produce a maximum ROC score of 0.72 and PR score of 0.68 (SVM and XGBoost with 2-mer features). More-over, we observe that most of the structural descriptors perform better than the sequence-based features. This observation suggests that structural descriptors are more informative than sequence-based features. We have also observed that performance of classical SVM is compar-able to other standard state-of-the-art learners (RF and
XGBoost) with different types of structure and
sequence-based features. A similar trend regarding the relative performance of SVM and RF classifiers was ob-served by Yugandhar and Gromiha with a different data-set and evaluation protocol [13].
Protein binding affinity prediction with LUPI-SVM using protein structural descriptors as privileged information
In this section, we present our results with the Learning Using Privileged Information (LUPI) Support Vector Machine (LUPI-SVM). LUPI-SVM uses structure-based features as privileged information which is assumed to be available only during training in conjunction with sequence-based descriptors which are used in both training and testing. Our hypothesis is that due to its modeling of structural information, LUPI-SVM will pro-duce better accuracy for prediction of binding affinity while overcoming the limitation of predictors that re-quire structure information during testing.
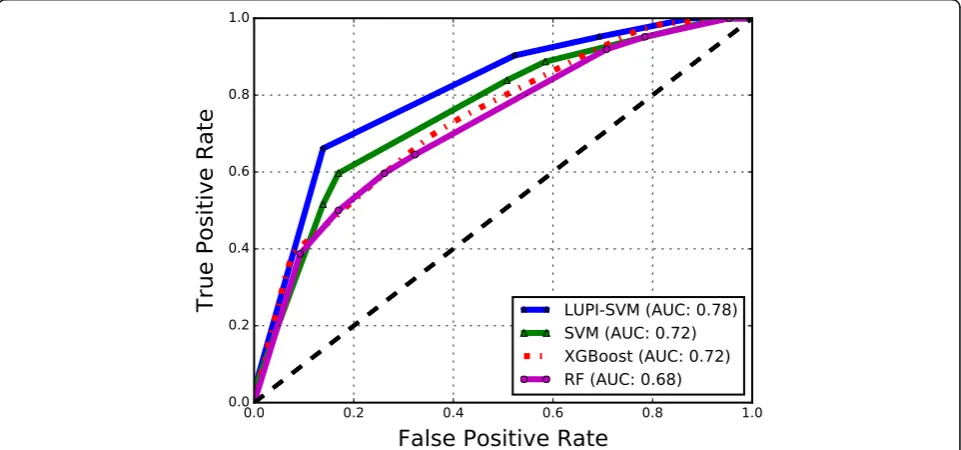
The results obtained with the LUPI-SVM framework using LOCO cross-validation on the affinity benchmark
[image:3.595.60.539.542.698.2]dataset are shown in Table 2 and Fig. 2. In LUPI-SVM
Table 1Protein complex classification results obtained using classical SVM, Random Forest and XGBoost using input and privileged features with LOCO cross-validation over the affinity benchmark dataset
Features Classical SVM Random forest XGBoost
ROC PR Sr ROC PR Sr ROC PR Sr
Input space
2-mer 0.72 0.68 −0.40 0.68 0.63 −0.38 0.72 0.66 −0.40
Blosum (Protein) 0.70 0.63 −0.36 0.69 0.62 −0.39 0.69 0.63 −0.34
Privileged space
NIRP 0.74 0.71 −0.45 0.74 0.67 −0.44 0.72 0.69 −0.42
Moal descriptors 0.73 0.68 −0.43 0.70 0.68 −0.37 0.71 0.68 −0.34
Dias descriptors 0.72 0.69 −0.42 0.69 0.69 −0.37 0.71 0.67 −0.34
Blosum (Interface) 0.61 0.60 −0.19 0.56 0.54 −0.11 0.66 0.59 −0.25
Bold faced values indicate best performance for each model. Blosum (Protein) refer to Blosum substitution scores averaged over the protein, while Blosum (Interface) are Blosum substitution scores averaged over the interface. Moal descriptors are taken from Moal et al. [8], and Dias descriptors are taken from Dias and Kolaczkowski [11]
we used sequence-based features (2-mer and Blosum substitution scores averaged over the protein) as input and structure-based descriptors (NIRP, Moal Descrip-tors, Dias DescripDescrip-tors, and Blosum substitution scores averaged over the interface) as privileged features, i.e., both sequence and structure features were used in train-ing the classifier but only sequence-based features in testing. In Table 2we have also show results of classical SVM using sequence-based features for an easy com-parison with LUPI-SVM. An area under the ROC curve (ROC) score of 0.78 and under the precision-recall curve (PR) score of 0.73 were obtained using Moal Descriptors
as privileged information and 2-mer features as
input-space features; this is a large improvement over the best baseline SVM performance of 0.72 and 0.68 for area under the ROC curve and PR curve, respectively. In all cases, the use of privileged information led to im-proved performance, even when using the Blosum sub-stitution scores averaged over the interface, that had lower performance than sequence-based features. Sur-prisingly, the performance of LUPI-SVM was also slightly higher than an SVM which used privileged struc-ture information for both training and testing. This sug-gests that LUPI-SVM can make effective use of both sources of information and provide performance that is better than both sources by themselves. Moreover, it is worth noting that the best features as privileged features are not the ones that give the best performance on the classification task, and that Moal descriptors consistently provided the best performance as privileged features.
[image:4.595.56.291.122.261.2]In order to test the performance of the proposed scheme in predicting binding affinity of different types of protein complexes, we have also computed the per-formance of LUPI-SVM across three major classes of complexes in the dataset. We observed area under the precision-recall curve (PR) score of 0.68, 0.58 and 0.82 and area under the ROC curve (ROC) score of 0.82, 0.67 and 0.71 for enzyme containing (E), antibody/antigen (A), and other complexes (O), respectively using Moal Descriptors as privileged information and 2-mer features as input-space features. These results also show a signifi-cant improvement in comparison to baseline SVM per-formance in terms of PR score of 0.62, 0.42 and 0.80 and ROC score of 0.72, 0.57 and 0.69 for enzyme containing Table 2Protein complex classification results obtained through
classical SVM and LUPI across different features using LOCO cross-validation over the affinity benchmark dataset
Input features
2-mer Blosum (Protein)
ROC PR Sr ROC PR Sr
Classical SVM
0.72 0.68 −0.40 0.70 0.63 −0.36
Privileged features LUPI-SVM
NIRP 0.76 0.71 −0.47 0.74 0.70 −0.42
Moal descriptors 0.78 0.73 −0.48 0.75 0.73 −0.43 Dias descriptors 0.74 0.70 −0.45 0.73 0.69 −0.40
Blosum (Interface) 0.73 0.69 −0.41 0.73 0.69 −0.42
Bold faced values indicate best performance for each model
ROCArea under the ROC curve,PRArea under the precision-recall curve,Sr
Spearman correlation coefficient
[image:4.595.58.539.470.695.2](E), antibody/antigen (A), and other complexes (O), respectively.
We have also divided complexes into rigid, medium and difficult classes on the basis of conformational change upon complex formation. We have observed an improved performance of LUPI-SVM for rigid and medium complexes with area under the precision-recall curve (PR) score of 0.74, 0.84 and area under the ROC curve (ROC) score of 0.82 and 0.92, in comparison to the baseline SVM with PR score of 0.69, 0.78 and ROC score of 0.73 and 0.84, respectively. For difficult com-plexes, both LUPI-SVM and the baseline SVM exhibited the same performance with PR score of 0.85 and ROC score of 0.74.
Performance comparison of LUPI-SVM and models build using classical machine learning setting on the
independent validation dataset
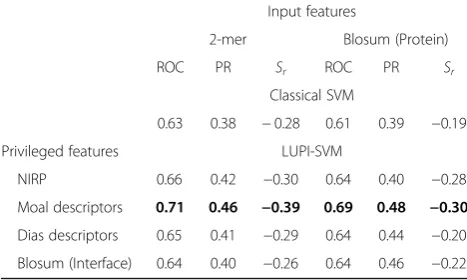
In addition to performance comparison using LOCO cross-validation, we have also used an additional valid-ation set to compare different machine learning models with the proposed LUPI-SVM approach. This dataset contains 12 positive examples (high affinity) and 27 negative examples (low affinity) and has no overlap with the affinity benchmark dataset. In this case, we trained the baseline and LUPI-SVM models on the affinity benchmark dataset and tested on the validation dataset. The results are shown in Table3. Using a classical SVM, we obtained a maximum area under the ROC curve (ROC) score of 0.63 and precision-recall curve (PR) score of 0.38 using 2-mer features, whereas by using LUPI-SVM trained using 2-mer as input features and Moal descriptors as privileged information, we obtained a much higher ROC score of 0.71 and PR score of 0.46. This shows an improved performance of LUPI-SVM over the classical SVM.
We have also used this validation set to compare LUPI-SVM against the existing state-of-the-art method
for protein affinity prediction called PPA-Pred2 [12]
using its webserver (accessed: March 18, 2018). For this comparison, we obtained predictions for the complexes in our validation dataset from the PPA-Pred2 webserver and computed the ROC score based on the predicted binding affinity values. We obtained a ROC score of 0.63 compared to 0.71 using the proposed LUPI-SVM method. The low performance of PPA-Pred2 on this val-idation dataset has already been reported independently by Moal et al., [17,18] as well. These results provide fur-ther support for the advantage of using protein struc-tural information as privileged information in the LUPI framework.
Feature analysis for binding affinity prediction
To discover the features that contribute to predicting binding affinity, we used the SHapley Additive exPlana-tions (SHAP) tool [20]. SHAP values reveal the import-ance of a feature in predicting binding affinity: for example, a high SHAP value of the count of the amino acid pair EK in the ligand proteins (denoted by L (EK) in
Fig. 3) indicates that the existence of EK contributes
more for predicting low binding affinity complexes.
Similarly, R (GT) (Counts of ‘GT’ mer in a protein
sequence designated as receptor) contributes more for predicting high binding affinity complexes (see Fig.3).
Different types of amino acids are involved in these top 20 2-mers such as lysine (K), Glutamic Acid (E), Ar-ginine (R), Aspartic Acid (D), Leucine (L), Tryptophan (W), Tyrosine (Y) and Serine (S). In the top 20 2-mers, Tryptophan (W), Tyrosine (Y), Serine (S), Thyronine (T) and Arginine (R) are involved in those 2-mers which contribute more in predicting high binding affinity com-plexes. These amino acids have already been highlighted as hot spots in protein interactions in previous studies [21,22].
Learned models using LUPI and classical SVM
We have used weight vectors of the best-trained models using both LUPI-SVM and classical SVM to get insight into the role of privileged information in training. Figure4 shows the weight vector of the trained classifier for the ligand Blosum features using both LUPI-SVM and classical SVM. Overall, both models show similar contributions of each residue, and the role of privileged information in LUPI-SVM appears to be in fine-tuning the weights for improved accuracy.
Discussion
[image:5.595.56.290.567.707.2]Computational protein binding affinity prediction tech-niques are important for determining the binding speci-ficity of proteins and their interactions due to the Table 3Comparison of classical SVM and LUPI-SVM on the
external independent validation dataset with training on affinity benchmark dataset
Input features
2-mer Blosum (Protein)
ROC PR Sr ROC PR Sr
Classical SVM
0.63 0.38 −0.28 0.61 0.39 −0.19
Privileged features LUPI-SVM
NIRP 0.66 0.42 −0.30 0.64 0.40 −0.28
Moal descriptors 0.71 0.46 −0.39 0.69 0.48 −0.30 Dias descriptors 0.65 0.41 −0.29 0.64 0.44 −0.20
Blosum (Interface) 0.64 0.40 −0.26 0.64 0.46 −0.22
Bold faced values indicate best performance for each model
ROCArea under the ROC curve,PRArea under the precision-recall curve,Sr
difficulty of obtaining this information experimentally. Among these computational methods, a number of ma-chine learning methods have been proposed which use both protein sequence and structures. All the available machine learning methods operate in the setting where information used during training should be available in in the same way during testing. This requirement limits the applicability of methods trained using protein 3D structure, as most proteins do not have solved 3D struc-tures. We have also observed that training models using sequence information only and ignoring structural infor-mation results in a loss of accuracy. It turns out that it is possible to have the best of both worlds and obtain even better performance than either source of data on its own, while still only requiring sequence information during testing using the proposed LUPI-SVM method.
Improved performance of LUPI-SVM over the baseline
classifiers and existing state-of-the-art method
(PPA-Pred2) [12] suggests that the proposed method
can effectively use both sources of information.
Conclusions and future work
We presented a novel machine learning method for pro-tein affinity prediction that uses both propro-tein structure and sequence information during training but needs only sequence information for testing. To the best of our knowledge, this is first attempt to combine protein structure and sequence information in this way to pre-dict binding affinity. A comparison of the proposed LUPI-SVM framework with different baseline learners and a state-of-the-art binding affinity predictor shows that our proposed method not only performs better in
Fig. 3Feature analysis using SHAP. The impact of mer features on model output is shown using SHAP values. The plot shows the top 20 2-mers for the Ligand (L) or Receptor (R) by the sum of their SHAP values over all samples. Feature value is shown in color (Red: High; Blue: Low) reveals for example that a high value of L (EK) (Counts of‘EK’in a protein sequence designated as ligand) contributes more for predicting low binding affinity complexes
A B
[image:6.595.59.539.86.289.2] [image:6.595.59.539.555.704.2]cross-validation but also on an additional validation dataset. However, there is still a large room of improve-ment in protein affinity prediction. As already suggested in a recent study by Dias and Kolaczkowski, to achieve better performance in this domain, we need either a sig-nificant increase in the amount of quality affinity data or methods of leveraging data from similar problems [11].
A number of other problems in bioinformatics in which the existence of structure data is a bottleneck, can be ad-dressed by combining sequence and 3D structural infor-mation using the framework of learning using privileged information. These include protein function prediction
[23], protein-DNA, protein-RNA and protein-protein
interaction prediction [24–27] as well. Finally, we expect that the freely available Python implementation of the LUPI-SVM framework will be helpful for applications in other problem domains.
Methods
Dataset and preprocessing
In this study we have used the protein binding affinity benchmark dataset 2.0 [19]. This dataset is a subset of docking benchmark version 4.0 (DBD-4.0) and contains 144 non-redundant protein complexes with solved bound and unbound 3D structures of the ligand and receptor pro-teins at an average resolution of 1.2 Å (min: 0.17 Å; max: 4.9 Å) [19, 28]. Protein complexes in this dataset have known binding affinities in terms of binding free energy and disassociation constant and have been divided into three major groups: (A) antibody/antigen, (E) enzyme con-taining, and (O) other complexes. The binding free energy ranges from−18.58 to−4.29. One protein complex (CID: 1NVU) in this dataset has two entries due to allostery [19,
29]. We considered only one of them (1NVU_Q: S), with
an affinity value of −7.43, due to lack of availability of structural information of interacting chains of the second entry. Following the same data curation and preprocessing technique used by Moal et al., and Yugandhar and Gro-miha, we have selected 128 complexes (for detail see in the Additional file1: Table S1) from this dataset after removing those complexes which: have a protein with length less than 50 amino acids, are not heterodimeric and have difficulty of deriving a full structural feature set [8, 12]. This allows us to use descriptors from Moal et al. and Dias et al., [8,11]. We have divided this dataset into two parts: complexes with low binding affinity (65 complexes) and complexes with high binding affinity (63 complexes) using a threshold
−10.86 which is median value of binding affinity in our data set and has been used in other studies as well [13].
We have also used an external validation dataset of 39 protein-protein complexes with known binding free en-ergy to perform a stringent performance comparison of different methods and machine learning models. This dataset is derived from Chen et al. by removing
complexes having more than two chains and involving chains of size less than 50 residues [30]. This dataset has been used for validation in a related study [17]. We have also used this dataset to compare the performance of
our proposed method with PPA-Pred2 [12] by using the
predicted binding affinity values obtained from its
web-server, which is available at https://www.iitm.ac.in/
bioinfo/PPA_Pred/, accessed on 18-03-2018.
Classifiers for prediction of binding affinity
We propose a machine learning approach for the classi-fication of protein-protein complexes based on their binding affinities using both structure and sequence in-formation. As discussed earlier, the novelty of the pro-posed approach is that it uses both sequence and structure of protein during training time but requires
only sequence information during testing (see Fig. 1).
The proposed scheme is based on the paradigm of learn-ing uslearn-ing privileged information (LUPI) [31].
In this work, we formulate binding affinity as a classifi-cation problem: classifying protein complexes as having low or high binding affinity. Thus, our dataset consists of examples of the form (ci,yi) where ci is a protein
complex and yi∈{+1,−1} is its associated label
indicat-ing whether cihas binding free energy less than −10.86
(+1) or not (−1). The threshold −10.86 is the median
value of binding affinity in our data set and has been used in other studies as well [13]. This results in 63 high binding affinity complexes (with label +1) and 65 low binding affinity complexes (with label −1). For a given
protein complex ci, we extract sequence and
structure-based features from it which are denoted byxi
and x′i, respectively. Our objective is to learn a function that classifies a given protein complex into high or low affinity using sequence information alone.
Baseline classifiers
As a baseline, we have used three different classifiers: classical Support Vector Machine (SVM), Random For-est (RF) and Gradient Boosting Machine (XGBoost) [32–35].
Classical Support Vector Machine (SVM)
We used SVM to classify a protein complex into high or low binding affinity by learning a function f(x) =〈w, x〉withw as parameters to be learned from the training data {(xi,yi )|i= 1, 2, …, N}. Optimal value of the w is
obtained in SVM by solving the following optimization problem [32].
minw;ξ1 2λ∥w∥
2þXN
i¼1
ξi ð1Þ
yihw;xii≥1−ξi;ξi≥0;∀i¼1;…;N:
The objective function in Eq. (1) maximizes the
mar-gin while minimizing marmar-gin violations (or slacks ξ)
[32]. The hyperparameterλ¼ 1
Ccontrols the tradeoff be-tween margin maximization and margin violation. We used both linear and radial basis function (RBF) kernels
and coarsely optimized the values of λ and γusing grid
search with scikit-learn (version:0.18) [36].
Random Forest
Random Forest (RF) is an ensemble learning method that operates by constructing multiple decision trees on random subsamples of input features and examples and classifies an example using a majority vote [33]. Random Forests have been used in many related studies [13,14]. Hyperparameter selection was performed with respect to the number of trees and the minimum number of exam-ples required for a split and used the implementation available in scikit-learn (version:0.18) [36].
Gradient Boosting (XGBoost)
Gradient boosting is also an ensemble learning method; it combines weak learners into a strong learner in an it-erative fashion [34,35]. We have performed model selec-tion for XGBoost in terms of the number of boosting iterations, booster, subsample ratio, learning rate, and maximum depth using a grid search and xgboost 0.7 [35].
LUPI-SVM
The LUPI-SVM framework was recently proposed by
Vapnik and Izmailov [31]. Like the standard SVM, this
model also learns a linear discriminant function f(xi) =
〈w,xi〉 in the input space. However, in LUPI, instead of slack variables as in a standard SVM, we have a slack function ξi¼⟨w′;x′i⟩ based on the privileged features. This controls the decision boundary in the input space using information from privileged features. In LUPI, we learnw by using training data of the form fðxi;x0i;yiÞji ¼1;…;Ng where,xiandx′iare feature vectors for
pro-tein complex ci belonging to the input and privileged
feature spaces, respectively, and yi∈{+1,−1} is the
asso-ciated label. The mathematical formulation of the LUPI-SVM can be written as:
minw;w′;ξ′1
2½λ∥w∥
2þλ′∥w′∥2
þλ′′XN
i¼1
½yi⟨w′;x′i⟩þξ′i þ
XN
i¼1
ξ′i ð2Þ
Subject to:
yi⟨w;xi⟩≥1−½yi⟨w′;x′i⟩þξ′i;
yi⟨w′;xi′⟩þξ′i≥0;
ξ0
i≥0;∀i¼1;…;N
where,λ,λ′, andλ′′are hyper-parameters which control the trade-off between margin maximization and margin violations. Slack variables in the privileged space ξ′ en-force the constraint that input-space slack values are non-negative.
In order solve this optimization problem, we have de-veloped a stochastic sub-gradient optimization (SSGO) algorithm inspired by the Pegasos solver for binary
SVMs [37]. To do so, we write the constrained
optimization problem in Eq. (2) as an unconstrained one as follows:
minw;w′1
2½λ∥w∥
2þλ′∥w′∥2
þλ′′XN i¼1
yi⟨w′;x′i⟩þ
XN
i¼1
lðyi;fðxi;x′i;w;w′ÞÞ ð3Þ
with the loss function:
lðyi;fðxi;x′i;w;w′ÞÞ
¼ maxf0;−yi⟨w′;x′i⟩;1−yi⟨w;xi⟩−yi⟨w′;x′i⟩g:
The stochastic sub-gradient solver for this problem operates iteratively by choosing a protein complex ran-domly in each iteration and estimating the sub-gradient of the objective function given in Eq. (3) based only on
the chosen complex. The sub-gradient at iterationt can
be written as:
∇t¼
( λwT−y
txt if yt⟨w;xt⟩þyt⟨w′;x′t⟩>1and1−yt⟨w;xt⟩>0
λwT otherwise
∇′
t¼
( λ′w′T
þλ′′y
tx′t−ytx′t if−yt⟨w′;x′t⟩>0oryt⟨w;xt⟩þyt⟨w′;x′t⟩>1
λ′w′T
þλ′′
ytx′t otherwise
The weight vectors are updated in a direction opposite to the direction of the sub-gradient by the following equations
wtþ1←wt−μt∇t
w′
tþ1←w′t−μ′t∇′t
using a step size of μt¼t1λ and μ0t¼t1λ0 . The complete
Feature representations
In this work we have used both structure- and sequence-based feature representations. The sequence-sequence-based fea-tures are used as input space feafea-tures whereas structural features are used as privileged space features, i.e., it is as-sumed that structural features are available only for train-ing. All feature representations are standardized to zero mean and unit variance across all complexes. The details of feature representation are as follows.
Sequence-based features
In order to model the sequence-based attributes of a protein complex containing ligand and receptor chains, we first obtain sequence-based features of all chains in the ligand and receptor separately. The features of all chains in the ligand (or receptor) are then averaged across chains to get a single feature vector for the ligand (or receptor). The feature vector representations of lig-and lig-and receptor are then concatenated to produce a feature vector for the protein complex as performed elsewhere [38]. We give details of the individual chain level sequence-based feature descriptors used in this study below.
k-mer composition (k-mer)
k-mer composition i.e. the counts of the occurrences of k-mers in a protein sequence, is a widely used descriptor of a protein sequence [39]. We used this feature repre-sentation to capture the composition of a protein se-quence. For k-mers of size 2 (2-mer) this yields a
400-dimensional feature representation of each protein chain.
BLOSUM-62 features: Blosum (Protein)
In order to represent amino acid composition and at the same time capture substitutions of physiochemically similar amino acids in a protein sequence, a protein sequence is converted into a 20-dimensional vector by averaging the columns from a BLOSUM substitution matrix corresponding to each amino acid in a given sequence. We used a BLOSUM-62 substitution matrix to extract this feature representation [40]. This feature representation has already been used successfully in sev-eral related studies [41–44].
Structure-based features (privileged feature space)
Proteins interact and perform their function through their 3D structure. Therefore, structural properties of a protein complex play a vital role in defining the binding affinity of a protein complex. In order to extract struc-tural properties of a protein complex, we used different complex level feature representations. We have used these features both as a baseline and for LUPI as privi-leged information. Different type of structural feature representations of each complex in our dataset used in this study are described below.
Number of interacting residue pairs (NIRP)
Interactions in a protein-protein complex are normally stabilized by the non-covalent interaction between
[image:9.595.56.537.459.712.2]residues occurring at the interface of ligand and receptor [45]. The amino acids involved in these non-covalent in-teractions at the interface of a protein complex deter-mine the binding mode and binding energy of a protein complex [1]. For this reason, we used the frequency of interacting amino acids pairs at the interface of a protein
complex as shown in Fig. 6. Through this method, we
extracted a 211-dimensional feature representation from the bound structures of ligand and receptor of a protein complex using a distance cutoff of 8 Å.
Moal descriptors
These descriptors were obtained from a study on protein-protein binding affinity prediction by Moal et al., [8]. This 200-dimensional feature representation of a complex describes the interface and conformational changes upon binding. These features include statis-tical potentials (residue and atomic pair potentials, four-body potentials), solvation and entropy terms (atomic contact energies, continuum electrostatics models, hydrophobic burial, terms for translational, rotational, vibrational, side chain and disorder to order transition entropies), unbound-bound descrip-tors (change in internal energy) and other potential terms like energy terms associated with electrostatics, London dispersion and exchange repulsion forces, as
well as potentials for hydrogen bond [8]. By using
these descriptors, a correlation score of 0.55 has been reported between the experimental and predicted binding affinities of the complexes in the affinity benchmark dataset [8].
Dias descriptors
We obtained these descriptors from a study on protein-protein binding affinity prediction by Dias and
Kolaczkowski [11]. These descriptors include
informa-tion related to binding assay pH, temperature, and meth-odology of determining experimental binding affinity
value of each complex in the benchmark dataset [11].
We have converted the string values of experimental methods into a feature vector using binary one-hot encoding [46]. These descriptors give a 27-dimensional feature representation for each complex in our dataset. A Pearson correlation of 0.68 between the experimental and predicted binding affinities has been reported using these descriptors [11].
Average BLOSUM-62 features: Blosum (Interface)
As discussed earlier, we extracted Blosum features to model substitution of physiochemically similar amino acids in a protein sequence. We have also extracted this feature representation for amino acids involved in the interface of a protein complex with a distance cutoff of 8 Å.
Model validation, selection and performance assessment
We used Leave One Complex Out (LOCO)
cross-validation to evaluate our classification models over the non-redundant binding affinity benchmark dataset [8]. This scheme of cross-validation allows us to include more training data by developing the model with
(N–1) complexes and testing on the left out complex.
This process is repeated for all the complexes in the
[image:10.595.59.540.475.684.2]dataset to get a single value of an accuracy metric. We have used area under the ROC curve (ROC), area under the precision-recall curve (PR) and the Spearman
correl-ation coefficient (Sr) as accuracy metrics for model
evaluation and performance assessment [44, 47–49].
Average values of all the metrics obtained by shuffling the data across 3 runs of LOCO cross-validation have been reported in the results and discussion section.
In order to get the optimal values of the hyperpara-meters for all the baseline classifiers and LUPI-SVM, we used grid search with an area under the ROC curve as the metric for selection with nested 5-fold cross-validation. For the standard SVM, the range of values forλandγwas [10−3, 103 ] and [10−3, 101 ], respectively. Similarly, for LUPI-SVM, we used values forλ, λ′ andλ′′ in the range [10−5, 103 ]. We used the best hyperparameters selected through grid search for the training and testing of the final model.
Additional file
Additional file 1:Table S1.Detail of 128 protein complexes with known binding affinity values used as training dataset. (DOCX 34 kb)
Abbreviations
LOCO:Leave one complex out; LUPI: Learning using privileged information; PR: Area under the precision-recall curve; RF: Random Forests; ROC: Area under the ROC curve
Acknowledgements
WAA would like to acknowledge the support of Higher Education Commission (HEC) of Pakistan in terms of grants: (PIN: 213-58990-2PS2-046) under indigenous Ph.D. fellowship and (PIN: IRSIP-37-Engg-02) under International Research Support Initiative Program (IRSIP). AA is supported through a Ph.D. scholarship from IT Endowment Fund, PIEAS. ABH would like to acknowledge the support of the NSF-ABI program under grant # 1564840.
Funding
This work is supported by National Research Program for Universities (NRPU), Higher Education Commission, Pakistan (Project ID: 6085).
Availability of data and materials
All data generated or analyzed during this study are included in this paper or available at online repositories. A Python implementation of the proposed method together with a webserver is available athttp://faculty.pieas.edu.pk/ fayyaz/software.html#LUPIandhttps://github.com/wajidarshad/LUPI-SVM.
Authors’contributions
WAA developed the scientific workflow, performed the experiments, analyzed and interpreted the results and was a major contributor in manuscript writing. AA developed the mathematical formulation of LUPI-SVM. ABH contributed to the analysis and interpretation of the results and writing of the manuscript. FuAAM conceived the idea, supervised the study and helped in manuscript writing. All authors have read and approved the final manuscript.
Ethics approval and consent to participate
This research does not involve human subjects, human material or human data.
Consent for publication
This manuscript does not contain details, images or videos relating to an individual person.
Competing interests
The authors declare that they have no competing interests.
Publisher’s Note
Springer Nature remains neutral with regard to jurisdictional claims in published maps and institutional affiliations.
Author details
1
Biomedical Informatics Research Laboratory (BIRL), Department of Computer and Information Sciences (DCIS), Pakistan Institute of Engineering and Applied Sciences (PIEAS), Nilore, ISL 45650, Pakistan.2Information Technology Center (ITC), University of Azad Jammu & Kashmir, Muzaffarabad, Azad Kashmir 13100, Pakistan.3Department of Computer Science, Colorado State University (CSU), Fort Collins, CO 80523, USA.
Received: 17 July 2018 Accepted: 25 October 2018
References
1. Swapna LS, Bhaskara RM, Sharma J, Srinivasan N. Roles of residues in the interface of transient protein-protein complexes before complexation. Sci Rep. 2012;2:334.
2. Du X, Li Y, Xia Y-L, Ai S-M, Liang J, Sang P, et al. Insights into protein–ligand interactions: mechanisms, models, and methods. Int J Mol Sci. 2016;17. https://doi.org/10.3390/ijms17020144.
3. Perozzo R, Folkers G, Scapozza L. Thermodynamics of protein-ligand interactions: history, presence, and future aspects. J Recept Signal Transduct Res. 2004;24:1–52.
4. Jönsson U, Fägerstam L, Ivarsson B, Johnsson B, Karlsson R, Lundh K, et al. Real-time biospecific interaction analysis using surface plasmon resonance and a sensor chip technology. Biotechniques. 1991;11:620–7.
5. Weber G. Polarization of the fluorescence of macromolecules. 1. Theory and experimental method. Biochem J. 1952;51:145–55.
6. Ain QU, Aleksandrova A, Roessler FD, Ballester PJ. Machine-learning scoring functions to improve structure-based binding affinity prediction and virtual screening. Wiley Interdiscip Rev Comput Mol Sci. 2015;5:405–24. 7. Xavier MM, Heck GS, de Avila MB, Levin NMB, Pintro VO, Carvalho NL, et al.
SAnDReS a computational tool for statistical analysis of docking results and development of scoring functions. Comb Chem High Throughput Screen. 2016;19:801–12.
8. Moal IH, Agius R, Bates PA. Protein-protein binding affinity prediction on a diverse set of structures. Bioinformatics. 2011.https://doi.org/10.1093/ bioinformatics/btr513.
9. Tian F, Lv Y, Yang L. Structure-based prediction of protein-protein binding affinity with consideration of allosteric effect. Amino Acids. 2012;43:531–43. 10. Vangone A, Bonvin AM. Contacts-based prediction of binding affinity in
protein–protein complexes. elife. 2015;4:e07454.
11. Dias R, Kolaczkowski B. Improving the accuracy of high-throughput protein-protein affinity prediction may require better training data. BMC Bioinformatics. 2017;18(Suppl 5).https://doi.org/10.1186/s12859-017-1533-z. 12. Yugandhar K, Gromiha MM. Protein-protein binding affinity prediction from
amino acid sequence. Bioinformatics. 2014;30:3583–9.
13. Yugandhar K, Gromiha MM. Feature selection and classification of protein– protein complexes based on their binding affinities using machine learning approaches. Proteins Struct Funct Bioinforma. 2014;82:2088–96.
14. Srinivasulu YS, Wang J-R, Hsu K-T, Tsai M-J, Charoenkwan P, Huang W-L, et al. Characterizing informative sequence descriptors and predicting binding affinities of heterodimeric protein complexes. BMC Bioinformatics. 2015;16: 1–11.
15. Vangone A, Schaarschmidt J, Koukos P, Geng C, Citro N, Trellet ME, et al. Large-scale prediction of binding affinity in protein-small ligand complexes: the PRODIGY-LIG web server. Bioinformatics. 2016;32.https://doi.org/10. 1093/bioinformatics/bty816.
16. Stepniewska-Dziubinska MM, Zielenkiewicz P, Siedlecki P, Valencia A. Development and evaluation of a deep learning model for protein–ligand binding affinity prediction. Bioinformatics.https://doi.org/10.1093/ bioinformatics/bty374.
18. Yugandhar K, Gromiha MM. Response to the comment on‘ protein-protein binding affinity prediction from amino acid sequence’. Bioinformatics. 2015;31:978.
19. Kastritis PL, Moal IH, Hwang H, Weng Z, Bates PA, Bonvin AMJJ, et al. A structure-based benchmark for protein-protein binding affinity. Protein Sci Publ Protein Soc. 2011;20:482–91.
20. Štrumbelj E, Kononenko I. Explaining prediction models and individual predictions with feature contributions. Knowl Inf Syst. 2014;41:647–65. 21. Chakrabarti P, Janin J. Dissecting protein-protein recognition sites. Proteins.
2002;47:334–43.
22. Bogan AA, Thorn KS. Anatomy of hot spots in protein interfaces. J Mol Biol. 1998;280:1–9.
23. Kadam K, Sawant S, Kulkarni-Kale U, Valadi JK, Kadam K, Sawant S, et al. Prediction of protein function based on machine learning methods: an overview. In: genomics III: methods, techniques and applications. 24. Si J, Cui J, Cheng J, Wu R. Computational prediction of RNA-binding
proteins and binding sites. Int J Mol Sci. 2015;16:26303–17.
25. Huang Y-A, You Z-H, Chen X, Chan K, Luo X. Sequence-based prediction of protein-protein interactions using weighted sparse representation model combined with global encoding. BMC Bioinformatics. 2016;17.https://doi. org/10.1186/s12859-016-1035-4.
26. Cau Y, Valensin D, Mori M, Draghi S, Botta M. Structure, function, involvement in diseases and targeting of 14-3-3 proteins: an update. Curr Med Chem. 2018;25:5–21.
27. Filgueira de Azevedo W, dos Santos GC, dos Santos DM, Olivieri JR, Canduri F, Silva RG, et al. Docking and small angle X-ray scattering studies of purine nucleoside phosphorylase. Biochem Biophys Res Commun. 2003;309:923–8. 28. Hwang H, Vreven T, Janin J, Weng Z. Protein-protein docking benchmark
version 4.0. Proteins. 2010;78:3111–4.
29. Margarit SM, Sondermann H, Hall BE, Nagar B, Hoelz A, Pirruccello M, et al. Structural evidence for feedback activation by Ras.GTP of the Ras-specific nucleotide exchange factor SOS. Cell. 2003;112:685–95.
30. Chen J, Sawyer N, Regan L. Protein–protein interactions: general trends in the relationship between binding affinity and interfacial buried surface area. Protein Sci Publ Protein Soc. 2013;22:510–5.
31. Vapnik V, Izmailov R. Learning using privileged information: similarity control and knowledge transfer. J Mach Learn Res. 2015;16:2023–49.
32. Cortes C, Vapnik V. Support-vector networks. Mach Learn. 1995;20:273–97. 33. Breiman L. Random Forests. Mach Learn. 2001;45:5–32.
34. Friedman JH. Greedy function approximation: a gradient boosting machine. Ann Stat. 2001;29:1189–232.
35. Chen T, Guestrin C. XGBoost: a scalable tree boosting system. In: Proceedings of the 22Nd ACM SIGKDD international conference on knowledge discovery and data mining. New York: ACM; 2016. p. 785–94. https://doi.org/10.1145/2939672.2939785.
36. Pedregosa F, Varoquaux G, Gramfort A, Michel V, Thirion B, Grisel O, et al. Scikit-learn: machine learning in Python. J Mach Learn Res. 2011;12:2825–30. 37. Shalev-Shwartz S, Singer Y, Srebro N, Cotter A. Pegasos: primal estimated
sub-gradient solver for SVM. Math Program. 2011;127:3–30.
38. Ahmad S, Mizuguchi K. Partner-aware prediction of interacting residues in protein-protein complexes from sequence data. PLoS One. 2011;6:e29104. 39. Leslie C, Eskin E, Noble WS. The spectrum kernel: a string kernel for SVM
protein classification. Pac Symp Biocomput Pac Symp Biocomput. 2002;7: 564–75.
40. Eddy SR. Where did the BLOSUM62 alignment score matrix come from? Nat Biotechnol. 2004;22:1035–6.
41. Aumentado-Armstrong TT, Istrate B, Murgita RA. Algorithmic approaches to protein-protein interaction site prediction. Algorithms Mol Biol AMB. 2015; 10:1–21.
42. Zaki N, Lazarova-Molnar S, El-Hajj W, Campbell P. Protein-protein interaction based on pairwise similarity. BMC Bioinformatics. 2009;10:150.
43. Westen GJ, Swier RF, Wegner JK, IJzerman AP, van Vlijmen HW, Bender A. Benchmarking of protein descriptor sets in proteochemometric modeling (part 1): comparative study of 13 amino acid descriptor sets. J Cheminform. 2013;5:41.
44. Abbasi WA, Minhas FUAA. Issues in performance evaluation for host– pathogen protein interaction prediction. J Bioinforma Comput Biol. 2016;14: 1650011.
45. Zhu H, Sommer I, Lengauer T, Domingues FS. Alignment of non-covalent interactions at protein-protein interfaces. PLoS One. 2008;3.https://doi.org/ 10.1371/journal.pone.0001926.
46. Harris D, Harris S. Digital design and computer architecture. 2nd ed. Amsterdam: Morgan Kaufmann; 2012.
47. Abbasi WA, Asif A, Andleeb S, Minhas FUAA. CaMELS: in silico prediction of calmodulin binding proteins and their binding sites. Proteins. 2017;85:1724–40. 48. Davis J, Goadrich M. The relationship between precision-recall and ROC
curves. In: Proceedings of the 23rd international conference on machine learning. New York: ACM; 2006. p. 233–40.https://doi.org/10.1145/1143844. 1143874.