warwick.ac.uk/lib-publications
Original citation:Laureti, S., Sfarra, S., Malekmohammadi, H., Burrascano, P., Hutchins, David A., Senni, L., Silipigni, G., Maldague, X. P. V. and Ricci, M. (2018) The use of pulse-compression
thermography for detecting defects in paintings. NDT & E International, 98 . pp. 147-154. doi:10.1016/j.ndteint.2018.05.003
Permanent WRAP URL:
http://wrap.warwick.ac.uk/106572
Copyright and reuse:
The Warwick Research Archive Portal (WRAP) makes this work by researchers of the University of Warwick available open access under the following conditions. Copyright © and all moral rights to the version of the paper presented here belong to the individual author(s) and/or other copyright owners. To the extent reasonable and practicable the material made available in WRAP has been checked for eligibility before being made available.
Copies of full items can be used for personal research or study, educational, or not-for-profit purposes without prior permission or charge. Provided that the authors, title and full bibliographic details are credited, a hyperlink and/or URL is given for the original metadata page and the content is not changed in any way.
Publisher’s statement:
© 2018, Elsevier. Licensed under the Creative Commons Attribution-NonCommercial-NoDerivatives 4.0 International http://creativecommons.org/licenses/by-nc-nd/4.0/
A note on versions:
The version presented here may differ from the published version or, version of record, if you wish to cite this item you are advised to consult the publisher’s version. Please see the ‘permanent WRAP url’ above for details on accessing the published version and note that access may require a subscription.
The use of pulse-compression thermography for detecting
defects in paintings
S.Laureti1, S.Sfarra2, H.Malekmohammadi1, Pietro Burrascano1, David. A. Hutchins3, Luca Senni1, G. Silipigni1,
X.P.V. Maldague4, and Marco Ricci5
1Department of Engineering, Polo Scientifico Didattico di Terni, University of Perugia, Strada di Pentima 4, 05100 Terni, Italy
{stefano.laureti,hamed.malekmohammadi,pietro.burrascano,luca.senni}@unipg.it, [email protected] 2Department of Industrial and Information Engineering and Economics, University of L’Aquila, Piazzale E. Pontieri 1, 67100
Loc. Monteluco di Roio – L’Aquila (AQ), Italy [email protected]
3School of Engineering, University of Warwick Library Road, Coventry CV4 7AL, United Kingdom
4Department of Electrical and Computer Engineering, Laval University, 1065, av. de la Médecine, G1V 0A6 Québec city, Canada QC
e-mail: [email protected]
5Department of Informatics, Modeling, Electronics and Systems Engineering, University of Calabria, Via Pietro Bucci, 87036 Arcavacata, Rende CS, Italy
e-mail: [email protected]
Abstract—Interest in the conservation of paintings grows year by year. Their periodic inspection is essential for their conservation over the time. Thermographic non-destructive inspection is one technique useful for paintings, but it is essential to be able to detect buried defects while minimising the level of thermal stimulus. This paper describes a pulse-compression infrared thermography technique whereby defect detection is optimised while minimising the rise in temperature. To accomplish this task, LED lamps driven by a coded waveform based on a linear frequency modulated chirp signal have been used on paintings on both a wooden panel and a canvas layer. These specimens contained artificially fabricated defects. Although the physical condition of each painting was different, the experimental results show that the proposed signal processing procedure is able to detect defects using a low temperature contrast.
Keywords—Thermography; Coded Excitation; Pulse-compression; Paintings.
I. INTRODUCTION
Active Thermography (AT) is a Non-Destructive Evaluation (NDE) technique widely used in different fields of research and industrials applications, as in material characterization [1], food inspection [2] and in cultural heritage diagnostic [3]. AT always relies on exciting the sample with a heating stimulus to achieve the required thermal contrast, though many different measurement schemes and post-processing algorithms can be employed [4]. For cultural heritage objects, AT is commonly implemented using Pulsed Thermography (PT), where the sample e.g. a bookbinding [5], bronze statue [6] or painting [7] is excited by an impulse from a flash-lamp. Additional thermal stimuli that have been reported include hot air [8], cold air [9], quartz lamps linear systems [10], heating plates [11], halogen lamps [12] and laser heating [13]. Information about defects and other structural changes are retrieved by analysing both the heating and cooling response as a function of time and location.
where a particular pigment may react to long (or repetitive) exposures to high temperatures, leading to degradation of the perceived colour. In addition, an exposed area may drift to another shade of colour. Certain colours formed by pigments are more susceptible to this drift [16]. For example, in vivianite (Fe3(PO4)2·8H2O,
blue), heat-related damage can be observed at temperatures as low as 70 °C, causing colour changes in both pure vivianite [17] and oil paint layers containing it [18]. Thus, minimising the temperature variation is of primary importance. The use of low-power excitation is therefore desirable in such cases, but this leads to a significant reduction of the Signal to Noise Ratio (SNR) that could affect the effectiveness of the PT analysis. Fortunately, techniques have been developed capable of improving the SNR of AT measurements in case of low-power sources. One approach is Lock-in Thermography (LT), where the heating stimulus is modulated at a specific frequency [19]. The acquired thermograms are then processed in the frequency domain, thus obtaining phase and magnitude images of the investigated item at that frequency [20]. LT is widely adopted as it provides a significant gain of SNR. However, the depth of penetration is set by the modulation frequency, and the amount of information retrieved is lower than that from PT, which excites a greater measurement bandwidth [21]. Therefore, efforts have been made to combine the advantages of both schemes, leading for example to Pulse Phase Thermography [22], and the more complex Multi-Frequency Lock-in Thermography [23].
Another possible approach is to exploit the positive features of pulse-compression techniques
[24]. The application of coded excitation signals and pulse-compression for studying thermal phenomena was pioneered by several rearch groups led by Mandelis [25-27] and Mulaveesala [28-30]. Subsequently, various PuCT procedures have been proposed [31-33]. In fact, the Pulse Compression (PuC) algorithm outputs an accurate impulse response estimate that is very similar to that obtainable from PT, even when low-power sources are used. The modulated heating stimulus is in the form of a coded excitation, where the bandwidth B
and the duration T of the signal are uncorrelated. Hence, the frequency content of the coded signal can be tailored to suit the investigation of a given sample, while T can be increased almost arbitrarily to achieve the desired SNR [34–37]. These properties can be usefully applied to inspect paintings, using low-power heating sources to keep surface temperatures relatively low. Moreover, the use of coded excitations and PuC allows both frequency and time domain analyses to be performed. A frequency domain analysis can be carried out directly on the raw acquired data; the time domain analysis can be executed after the application of the PuC algorithm. It is worth noting that the use of pseudo-random modulated heating stimulus has been used in infrared thermography [25], and recently applied in AT for cultural heritage diagnostic by Candoré et al [38]. However, here the thermal impulse response was estimated using an Auto Regressive Moving Average algorithm (ARMA) to model the process. In PuCT, the thermal impulse response is estimated by applying a deterministic procedure based on application of a matched filter. In addition, in [38] the thermal source consisted of halogen lamps driven by a pseudo-random code while in the present paper the heating stimulus is realized with LEDs driven by a chirp signal.
linear chirp was able to damp any thermal shock to the paintings (especially when compared to PT), while minimising increases in the sample temperature.
II. DESCRIPTION OF THE SAMPLES
II. A Painting on canvas
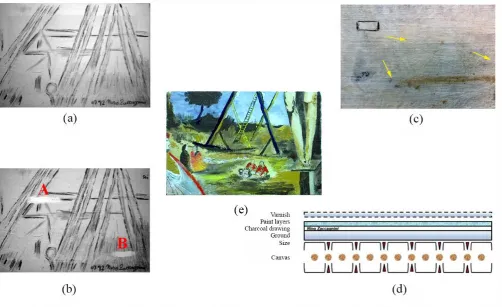
[image:4.595.49.552.225.532.2]Here, a linen canvas was used as support, and after a preliminary treatment (sizing), the canvas was fixed onto a wooden frame. An outline charcoal crayon sketch was drawn on the canvas (Fig. 1(a)). Two Mylar defects were then placed between the size and the ground layers, see Fig. 1(b) and (d). Defect A (4.5 x 1 cm) consisted of two superimposed Mylar layers, and defect B (4 x 1 cm) was formed from one layer. Acrylic paint and varnish layers were then applied over the defects and the canvas was both embroidered (see the arrows in Fig. 1(c)), and other repairs simulated using a crochet-hook. The final appearance of the painting is shown in Fig. 1(e).
Fig. 1 Painting on canvas: (a) the preparatory drawing, (b) defects A, B, (c) back view with embroideries, (d) the layers constituting the sample, and (e) front view of the final sample.
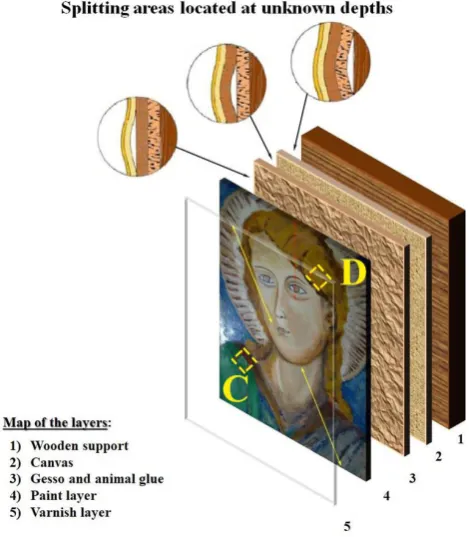
II. B wooden panel painting
Fig. 2 Panel painting: on-plane position of the fabricated defects and sequence of the layers.
III. THEORETICAL BACKGROUND
Heat transfer is a very complex phenomenon for which many references can be found in literature. The reader is referred to [48–50] for a detailed mathematical description of the heat transfer within a body when AT is performed, particularly for the case of PuCT [28-33]. The following subsections are aimed at showing the basic mathematical theory at the heart of PuCT, its pros and cons with respect to standard pulsed excitation, and how to correctly apply this technique for NDE. Moreover, the main features of the employed linear chirp signal are also shown.
III.A Pulse-Compression basic theory
PuC is a measurement technique employed to estimate the impulse response ℎ(𝑡) of Linear Time Invariant (LTI) systems in poor SNR conditions. In standard PT, flash lamps are usually exploited to heat the sample within a time significantly shorter than the typical cooling time of the sample itself. Thus, the heating stimulus exciting the LTI system can be modelled as a Dirac’s Delta function 𝛿(𝑡) so that the corresponding impulse response ℎ(𝑗𝑥, 𝑗𝑦, 𝑡) is directly retrieved as the pixel temperature/emissivity time trend (see Fig. 3(a)). Useful information about the sample are obtained by analysing both the heating and the cooling of the
{ℎ(𝑗𝑥, 𝑗𝑦, 𝑡)} within a chosen range of interest Th. PuCT requires further processing steps to be performed, as it relies on the existence of two signals {𝑠(𝑡), Ψ(𝑡)} such that their convolution 𝛿̃(𝑡) approximates the Dirac’s Delta Function δ(t):
𝑠(𝑡) ∗ Ψ(𝑡) = 𝛿̃(𝑡) ≈ 𝛿(𝑡) (1)
system with s(t) and then by convolving the acquired system output 𝑦(𝑗𝑥, 𝑗𝑦, 𝑡) with Ψ(t), see Fig.3(b). This is demonstrated in Eq. (2) for a single pixel of the acquired image, where also the presence of an Additive-White-Gaussian-Noise (AWGN) as the e t( )term, uncorrelated to Ψ(t)), is considered.
ℎ̃(𝑡) = 𝑦(𝑡) ∗ Ψ(𝑡) = ℎ(𝑡) ∗ 𝑠(𝑡) ∗ Ψ(𝑡)⏟ =𝛿̃(𝑡)
+ 𝑒(𝑡) ∗ Ψ(𝑡) = ℎ(𝑡) ∗ 𝛿̃(𝑡) + 𝑒̃(𝑡) ≈ ℎ(𝑡) + 𝑒̃(𝑡)
(2)
The use of PuC instead of pulsed excitation results in an estimate h t%( ) of the h(t) having an increased SNR. The SNR gain is proportional to the T B product, i.e. it can be enhanced almost arbitrarily by increasing either the time duration or the bandwidth of the coded waveform. Under the hypothesis of AWGN noise, the use of a matched filter defined as Ψ(𝑡) = 𝑠(−𝑡) maximizes the SNR for a given setup [51]. Drawbacks of the use of PuC arise from the practically-limited T and B values that lead to an approximated reconstruction of the real impulse response h(t) [52]. Only an approximation ℎ̃(𝑗𝑥, 𝑗𝑦, 𝑡) can be retrieved after PuC, the quality of this
Fig. 3 Comparison between (a) Pulsed Thermography (PT) and (b) Pulse-Compression Thermography (PuCT). In PT the excitation is considered instantaneous and the sample impulse thermal response is measured for a time Th, which is
the impulse response time duration, i.e. the time necessary for the diffusion of the heat. In PuCT, the sample is excited with a coded excitation of duration T and thermograms are collected for an overall time duration of T+Th. After the application of
approximation being dependent on the level of sidelobes associated with 𝛿̃(𝑡). Therefore, it is important to reduce the magnitude of the sidelobes, as they can reduce the defect detection capability. Many studies can be found showing different approaches for optimizing the design of both the coded waveform and the matched filter, either for decreasing their magnitude or for maximizing the SNR gain. Although an exhaustive investigation lies beyond the scope of the present work, it has been observed that replacing the standard matched filter with a Wiener filter helps on minimizing sidelobe amplitudes [51-54]. Finally, the quality of reconstructing 𝛿̃(𝑡) depends strictly on the correct implementation of the convolution procedure. The reader is referred to [31-37,55–61] for further details.
III.B. Linear Chirp Signal and Optimized Wiener Filter
A linear chirp signal is a frequency modulated signal whose instantaneous frequency varies linearly within a chosen range. A general mathematical definition of a chirp is given here:
𝑠(𝑡) = cos (𝜙(𝑡)) (3)
with 𝜙(𝑡) the instantaneous signal phase. The design of a chirp strictly depends from the definition of the instantaneous frequency fist( )t :
𝑓𝑖𝑠𝑡(𝑡) = 1
2𝜋 𝑑𝜙(𝑡)
𝑑𝑡 (4)
For a linear chirp signal, the phase is a quadratic function 𝜙(𝑡) = 𝑓0𝑡 +2𝑇𝐵 𝑡2, leading to an expression for
𝑓𝑖𝑠𝑡(𝑡) that is a linear function of time:
𝑓𝑖𝑠𝑡(𝑡) = 𝑓0+𝐵𝑇𝑡, (5)
where B is the bandwidth B f1 f0, being the difference between the initial and the final value of the instantaneous chirp frequency. Note that if f1 f0and 𝐵 > 0, fist( )t increases as time elapses and the chirp is called “up” linear chirp; otherwise if f1 f0, fist( )t decrease as time elapses and the chirp is a “down”
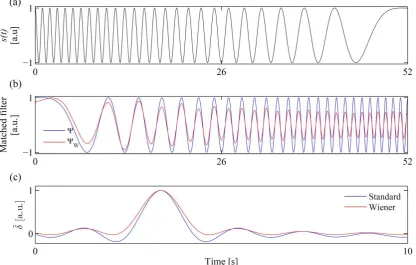
linear chirp. Although an “up” linear chirp could also be employed, hereinafter a “down” chirp signal is considered, spanning the frequency range within 𝑓1 = 0 Hz and 𝑓0 = 1 Hz for an overall duration of T 52 s, as depicted in Fig. 4(a). Please note that the selected frequency range has been chosen so as to guarantee sufficiently-large thermal diffusion lengths, thus allowing an increased penetration within the inspected sample; in addition the T B product is high enough to provide a sufficient SNR value [35,58,62,63]. Finally, the extended duration of the coded signal, together with its smooth instantaneous amplitude transition (Fig. 4(a)), helps to avoid any thermal shock.
As mentioned above, Wiener Filtering suppresses the magnitude of 𝛿̃(𝑡) sidelobes by up to 30dB with respect to what is achievable by employing a matched filter Ψ(𝑡) = 𝑠(−𝑡) [26]. Applying a Wiener filter simply consists of substituting Ψ(𝑡) with a new matched filter ΨW(t), defined as in Eq.(6):
ΨW(t) = IFFT(|Ψ(𝑓)|Ψ(𝑓)2+𝑎+𝑏∙|𝑓|) = IFFT
(
𝑠∗(𝑓)
|𝑠(𝑓)|2+𝑎+𝑏∙|𝑓|
)
,
(6)The values used for the regularization parameters were a = and b = 0.1. Eq. (6) shows that Ψ𝑊(𝑡) has the same phase profile of the Ψ(𝑡), but with a modified spectrum amplitude. Fig. 4(b) depicts both the standard
Ψ(𝑡) and the optimized Ψ𝑊(𝑡), whilst a comparison between the obtained 𝛿̃(𝑡) with the said matched filters is shown in Fig. 4(c). Fig. 4(c) shows that the use of Wiener filter Ψ𝑊(𝑡) leaves the main lobe amplitude
almost unaltered with respect to use the standard Ψ(𝑡), while providing a significant sidelobe reduction. Therefore, the resulting 𝛿̃(𝑡) quality is improved, leading to a better ℎ̃(𝑡) estimate.
IV. THE USE OF PULSE COMPRESSION IN ACTIVE THERMOGRAPHY
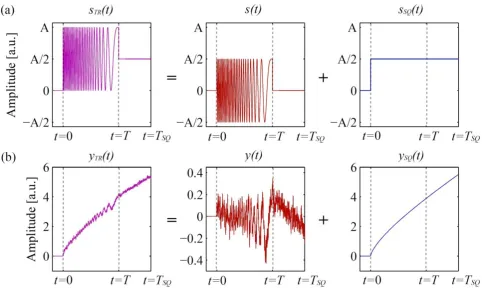
From the above, it will be apparent that the quality of the estimated ℎ̃(𝑡)of the real impulse response ℎ(𝑡) obtained by performing PuC depends not only on the correct choice of the coded signal parameters and the related matched filter (both discussed above), but also on the correct implementation of the convolution procedure, where issues will arise from the difficulty in realizing a bipolar heating source. Therefore, an offset must be applied to the chirp signal 𝑠(𝑡)so as to create the correct heating source (which must be monopolar). It thus follows that the real employed excitation signal sTR( )t s t( )sSQ( )t is the superposition of a chirp signal
𝑠(𝑡)and a square pulse 𝑠𝑆𝑄(𝑡) = 𝐶{𝜗(𝑡) − 𝜗(𝑡 − 𝑇)} where 𝜗(𝑡) is the Heaviside step function. Thus, the true acquired output signal (Eq. (7)) will be:
( ) ( ) ( ) ( ) ( ) ( ) ( ) ( )
TR SQ SQ
y t h t s t h t s t e t y t y t + e(t) (7)
Consequently, the contribution of 𝑦𝑆𝑄(𝑡) from y(t) must be removed before finalizing the PuC algorithm via convolution with the matched filter. For clarity, this requirement can be realized by comparing Eq. (7) with Eq. (2).
[image:8.595.101.518.129.394.2]Recently, Silipigni et al. [33] proposed a procedure for proper implementing PuC in AT based on extending the s𝑆𝑄(𝑡) contribution for some time after T. It has been shown that this helps to design an optimized non-linear fitting algorithm, capable of correctly removing the contribution y𝑆𝑄(𝑡) from y(𝑡).
In summary, the PuCT procedure should use the following steps:
1) Excite the sample with a chirped heating stimulus of time duration T and with an additional s𝑆𝑄(𝑡) contribution for 𝑇𝑆𝑄 = 𝑇 + 𝑇ℎ > 𝑇 . In the present work, 𝑇𝑆𝑄 = 82𝑠, 𝑇 = 52𝑠 and 𝑇ℎ = 30𝑠. Thus, the sample is kept heated for 30 seconds after the end of the coded stimulus.
2) Acquire thermograms for an overall time interval 𝑇𝑆𝑄.
3) Remove the y𝑆𝑄(𝑡) contribution from each pixel of the acquired thermographic sequence, thus obtaining y(t).
4) Perform a pixel-by-pixel convolution of each 𝑦(𝑡) with the optimized Ψ𝑊(𝑡), i.e. retrieving the
( x, y, )
h j% j t .
The true output signals are reported in Fig.5 where the role of the step-heating is also highlighted.
[image:9.595.67.550.263.551.2]V. EXPERIMENTALSETUP
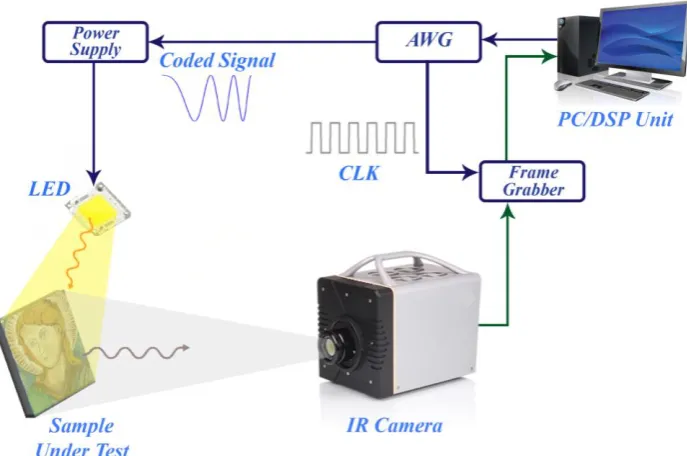
A sketch of the experimental setup is shown in Fig. 6.
[image:10.595.121.465.113.341.2]A National Instrument PCI-6711 Arbitrary Waveform Generator (AWG) board and a National Instrument 1433 Camera Link Frame Grabber were connected to a PC, and an ad hoc developed virtual instrument in LabVIEWTM managed the signal generation/acquisition. The AWG board provided both the wanted linear chirp excitation and a reference clock signal (CLK) for triggering the IR camera acquisition, which was a Xenics Onca-MWIR-InSb IR camera. The coded signal was input into a TDK Lambda GEN 750W power supply that fed eight LED chips placed at about 30 cm from the SUT. The LED chips are capable of providing a maximum overall power of 400W but the total employed power was reduced to 110W to avoid overheating of the sample. In addition, XenethTM software provided by the camera manufacturer was used for estimating the temperature increment at the sample caused by a particular chirp-modulated heating stimulus. The thermograms were acquired at 40 FPS.
Fig. 6 The experimental setup. The Arbitrary Waveform Generator (AWG) and Frame Grabber were connected to a PC. The AWG board provided both the wanted linear chirp excitation and a reference clock signal (CLK) for triggering the IR camera acquisition. The coded signal was input into a TDK Lambda GEN 750W power supply that fed eight LED chips placed at
VI. RESULTS
As already pointed out, it is important to keep the painting temperature increase as low as possible during the inspection. Preliminary results show that a temperature increment of ~1 °C occurred at the sample surface. This is illustrated in Fig. 7, where the temperature profile averaged over a line of pixels (1-2) crossing the panel painting surface is plotted as the time elapsed.
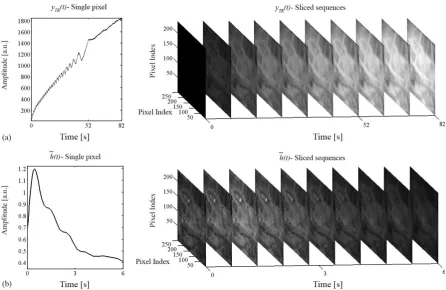
[image:11.595.64.513.147.386.2]Figs. 8 and 9 show the effect of the overall PuC procedure on defect detection and resolution by reporting a graphical comparison between thermograms collected during both the application of the chirp excitation (Figs. 8(a) and 9(a)) and after PuC (Figs. 8(b) and 9(b)). An improvement in the SNR of the image is clearly visible after PuC with respect to the acquired raw data. Also, areas containing defects appeared as bright pixels areas on the sliced thermogram sequences after PuC (Figs. 8(b) and 9(b)).
Fig. 7. Averaged temperature time handling of a line of pixels (1-2) crossing the panel painting surface while subject to the employed heating stimulus. Maximum (Tmax), minimum (Tmin) and standard deviation (TSTD) values are reported inside the
Fig. 8 (a) Comparison between thermograms collected at different times during the application of the chirp excitation; (b) thermograms retrieved after pulse compression, panel painting.
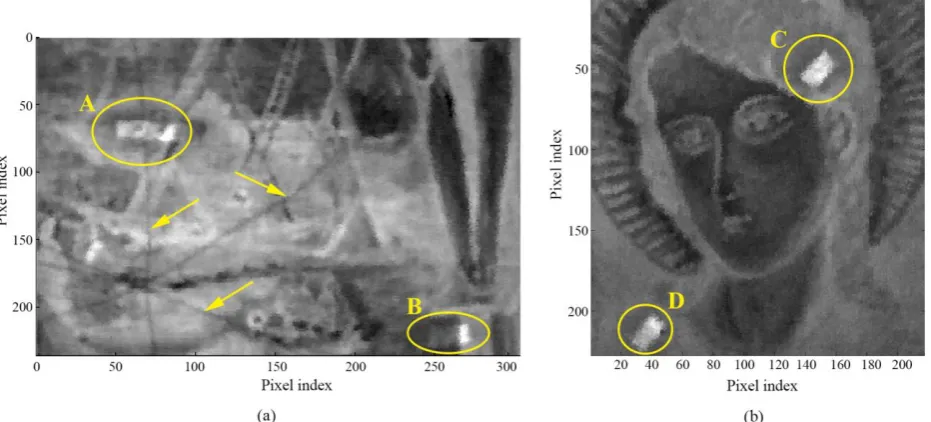
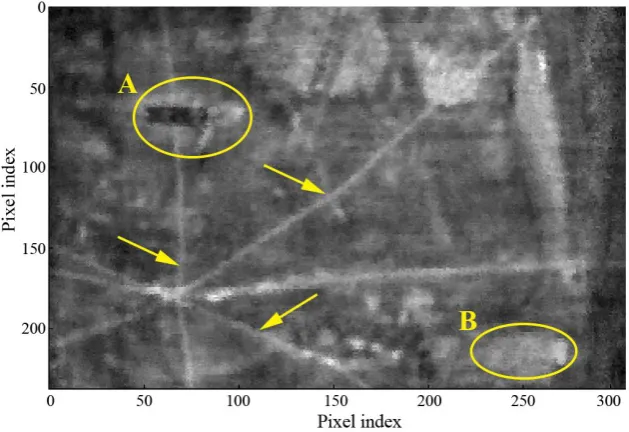
[image:12.595.79.522.79.353.2] [image:12.595.78.525.388.678.2]Fig.10 depicts two frames selected for both the canvas (Fig. 10(a)) and the panel sample (Fig. 10(b)) in which the defected areas detected are highlighted by yellow markers. These frames have been selected after a qualitative analysis of the recovered thermograms after PuC, i.e. by selecting the frames at which the defected areas appear to be clearly visible. The subsurface embroideries realized in the canvas layer of the painting on canvas are also detectable. They are indicated by arrows in Fig. 10(a).
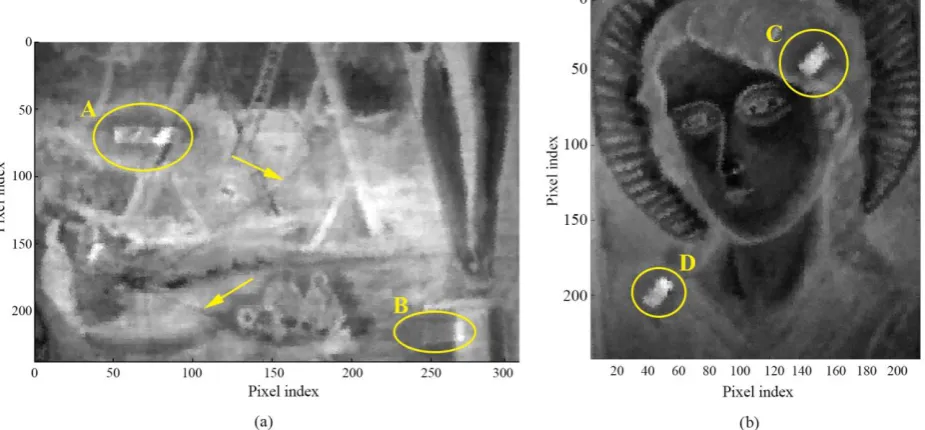
[image:13.595.59.525.166.377.2]The use of a coded heating stimulus provides the possibility of performing a simultaneous frequency and time analysis directly on the raw data (see Fig. 8(a)). In order to have a comparison of the results obtained with PuCT and another AT technique, a LT experiment was conducted. Since the selection of the optimal modulation frequency in LT is essential, a FFT analysis on the raw PuCT data was performed to qualitatively select the best frame and its corresponding frequency for each SUT. In particular, it has been found that the best frame is obtained at around 0.15 Hz for canvas and around 0.19 Hz for the panel. Therefore, LT was carried out using a sinusoid modulation at these frequencies using the same 110 W LED setup for 82 seconds, so as to be consistent with TSQ, see Section IV. Results obtained from FFT analysis (magnitude) on both the acquired raw PuCT data (Fig. 11) and LT results (Fig. 12) on both samples can be compared, where differences are apparent, which are discussed below.
Embroideries are the most difficult defects to be detected due to their tiny dimension and the similarity to the surrounding canvas texture. Fig.13 shows the LT phase image of the canvas sample.
Fig. 11 Selected best frames after FFT (magnitude) for the (a) canvas at 0.15 Hz and (b) panel painting at 0.19 Hz.
[image:14.595.74.537.320.535.2]VII.DISCUSSION
The results obtained using the proposed PuCT approach are qualitatively comparable to the ones obtained by LT technique. This can be seen if Fig.10(a) and Fig.10(b) are compared with Fig.12(a) and Fig.12(b) respectively. In addition, it should be noted that the modulation frequency value used for LT should have been known a priori for the best result, whilst it has been chosen here after an FFT analysis of the PuCT raw data. The quality of the phase image obtained with LT on the canvas (Fig.13) is qualitatively comparable with the one obtained with PuCT on the same sample in time domain (Fig.10(a)). Indeed, in both cases all the defects in the canvas are clearly visible. Finally, the thermograms obtained from PuCT in Fig.8(b) and Fig.9(b) shows that a time analysis of the sample investigated features can be performed, as is also possible in PT.
VIII.CONCLUSIONS
In this work, the PuCT technique was applied on paintings with the aim to detect subsurface defects. In addition, the well-known LT technique was used for comparative purposes. The PuCT technique was able to detect splitting areas located beneath two different paint layers that were applied on panel and canvas supports, respectively. Strategies adopted were able to improve the performance of the pulse-compression active thermography, and the experimental results demonstrated the gain provided by such procedures. The thermal impulse response of the inspected samples was reconstructed using an improved SNR and enhanced fidelity. A very low temperature difference causing a reasonable thermal stress on the upper layers was taken into account during thermographic inspections. Also, the type of penetration of the thermal waves appears sufficient to detect thin defects, such as crochet-work stitched areas created in the canvas. Future work intends to investigate coded excitations with an arbitrary power spectrum, intended to further increase the SNR of the deepest defects and reducing sidelobe levels.
ACKNOWLEDGMENTS
The authors would like to thank Mr. Nino Zaccagnini (University of L’Aquila, Italy) who constructed the samples used in this work. Dr. Stefano Sfarra collaborated to the achievement of the canvas painting.
[image:15.595.133.448.61.277.2]This research work has been partially supported from the European Union’s Horizon 2020 research and innovation programme under the Marie Skłodowska-Curie grant agreement No 722134 – NDTonAIR.
REFERENCES
[1] Meola C, Carlomagno GM, Giorleo L. The use of infrared thermography for materials characterization. J Mater Process Technol 2004, 155:1132–1137.
[2] Weschenfelder A V., Maldague X, Rocha LM, Schaefer AL, Saucier L, Faucitano L. The use of infra-red thermography for pork quality prediction. Meat Sci 2014, 96:120-125.
[3] Sfarra S, Ibarra-Castanedo C, Paoletti D, Maldague X. Infrared vision inspection of cultural heritage objects from the city of l’Aquila, Italy and its surroundings. Mater Eval 2013,71.5.
[4] Ibarra-Castanedo C, Bendada A, Maldague X. Image and signal processing techniques in pulsed thermography. GESTS Int Trans Comput Sci Eng 2005, 22.1:89–100.
[5] Mercuri F, Cicero C, Orazi N, Paoloni S, Marinelli M, Zammit U. Infrared Thermography Applied to the Study of Cultural Heritage. Int J Thermophys 2015, 36.5-6:1189–1194.
[6] Mercuri F, Paoloni S, Orazi N, Cicero C, Zammit U. Pulsed infrared thermography applied to quantitative
characterization of the structure and the casting faults of the Capitoline She Wolf. Appl Phys A Mater Sci Process 2017, 123.5:327.
[7] Gavrilov D, Maeva E, Grube O, Vodyanoy I, Maev R. Experimental comparative study of the applicability of infrared techniques for non-destructive evaluation of paintings. J Am Inst Conserv 2013, 52.1:48–60.
[8] Di Tuccio MC, Ludwig N, Gargano M, Bernardi A. Thermographic inspection of cracks in the mixed materials statue: Ratto delle Sabine. Herit Sci 2015, 3.1:10.
[9] Ibarra-Castanedo C, Sfarra S, Ambrosini D, Paoletti D, Bendada A, Maldague X. Diagnostics of panel paintings using holographic interferometry and pulsed thermography. Quant Infrared Thermogr J 2010, 7.1:85–114.
[10] Carlomagno GM, Meola C. Comparison between thermographic techniques for frescoes NDT. NDT&E Int 2002, 35.8: 559–565.
[11] Bendada A, Sfarra S, Ibarra-Castanedo C, Akhloufi M, Caumes JP, Pradere C, Batsale J, Maldague X. Subsurface imaging for panel paintings inspection: A comparative study of the ultraviolet, the visible, the Infrared and the terahertz spectra. Opto-Electronics Rev 2015, 23.1:90–101.
[12] Bodnar JL, Nicolas JL, Candoré JC, Detalle V. Non-destructive testing by infrared thermography under random excitation and ARMA analysis. Int. J. Thermophysics 2012, 33.10-11: 2011–2015.
[13] Mezghani S, Perrin E, Vrabie V, Bodnar JL, Marthe J, Cauwe B. Evaluation of paint coating thickness variations based on pulsed Infrared thermography laser technique. Infrared Phys Technol 2016, 76:393–401.
[14] Theodorakeas P, Avdelidis NP, Cheilakou E, Koui M. Quantitative analysis of plastered mosaics by means of active infrared thermography. Constr Build Mater 2014, 73:417–425.
[15] Sfarra S, Ibarra-Castanedo C, Theodorakeas P, Avdelidis NP, Perilli S, Zhang H, Nardi I, Koui M, Maldague X. Evaluation of the state of conservation of mosaics: Simulations and thermographic signal processing. Int J Therm Sci 2017, 117:287–315.
[16] Coccato A, Moens L, Vandenabeele P. On the stability of mediaeval inorganic pigments: A literature review of the effect of climate, material selection, biological activity, analysis and conservation treatments. Herit Sci 2017, 5.1:12.
[17] Frost RL, Weier ML, Martens W, Kloprogge JT, Ding Z. Dehydration of synthetic and natural vivianite. Thermochim Acta 2003, 401.2:121–130.
[18] Čermáková Z, Švarcová S, Hradilová J, Bezdička P, Lančok A, Vašutová V, Blažek J, Hradil D. Temperature-related degradation and colour changes of historic paintings containing vivianite. Spectrochim Acta - Part A Mol Biomol Spectrosc 2015, 140:101–110.
[19] Carlomagno GM, Berardi PG. Unsteady Thermotopography in Non-Destructive Testing. Proc 3rd Biannu Exch (IRIE ‘76) 1976, 24: 26.
[20] Kordatos EZ, Exarchos DA, Stavrakos C, Moropoulou A, Matikas TE. Infrared thermographic inspection of murals and characterization of degradation in historic monuments. Constr Build Mater 2013, 48:1261–1265.
[21] Maldague X. Theory and practice of infrared thermography for nondestructive testing. Wiley series in microwave and optical engineering. Wiley 2001.
[22] Maldague X, Marinetti S. Pulse phase infrared thermography. J Appl Phys 1996, 79.5:2694-2698.
[23] Beuve S, Qin Z, Roger JP, Holé S, Boué C. Open cracks depth sizing by multi-frequency laser stimulated lock-in thermography combined with image processing. Sensors Actuators A Phys 2016, 247:494–503.
[24] Klauder JR, Price AC, Darlington S, Albersheim WJ. The theory and design of chirp radars. Bell Labs Technical Journal 1960, 39.4:745-808.
[25] Mandelis A. Time-delay-domain and pseudorandom-noise photoacoustic and photothermal wave processes: a review of the state of the art. IEEE transactions on ultrasonics, ferroelectrics, and frequency control 1986, 33.5:590-614.
[27] Peralta SB, Chen ZH, Mandelis A. Simultaneous measurement of thermal diffusivity, thermal conductivity and specific heat by impulse-response photopyroelectric spectrometry. Applied Physics A 1991, 52.5:289-294.
[28] Tuli S, Mulaveesala R. Defect detection by pulse compression in frequency modulated thermal wave imaging. Quantitative InfraRed Thermography Journal 2005, 2.1:41-54.
[29] Mulaveesala R, Tuli S. Digitized frequency modulated thermal wave imaging for nondestructive testing. Materials Evaluation 2005, 63.10.
[30] Tabatabaei N, Mandelis A. Thermal-wave radar: A novel subsurface imaging modality with extended depth-resolution dynamic range. Review of Scientific Instruments 2009, 80.3:034902.
[31] Mulaveesala R, Ghali VS. Coded excitation for infrared non-destructive testing of carbon fiber reinforced plastics. Review of Scientific Instruments 2011, 82.5:054902.
[32] Gong J, Liu J, Qin L, Wang Y. Investigation of carbon fiber reinforced polymer (CFRP) sheet with subsurface defects inspection using thermal-wave radar imaging (TWRI) based on the multi-transform technique. Ndt & E International 2014, 62:130-136.
[33] Silipigni G, Burrascano P, Hutchins DA, Laureti S, Petrucci R, Senni L, Torre L, Ricci M. Optimization of the pulse compression technique applied to the infrared thermography nondestructive evaluation. NDT&E Int 2017, 87:100–110 [34] Ricci M, Callegari S, Caporale S, Monticelli M, Battaglini L, Eroli M, Senni L, Rovatti R, Setti G, Burrascano P.
Exploiting Non-Linear Chirp and sparse deconvolution to enhance the performance of pulse-compression ultrasonic NDT. IEEE Int Ultrason Symp IUS 2012, 1489–92.
[35] Hutchins D, Burrascano P, Davis L, Laureti S, Ricci M. Coded waveforms for optimised air-coupled ultrasonic nondestructive evaluation. Ultrasonics 2014, 54.7: 1745-1759.
[36] Mohamed I, Hutchins D, Davis L, Laureti S, Ricci M. Ultrasonic NDE of thick polyurethane flexible riser stiffener material. Nondestruct Test Eval 2017, 32.4:343–362.
[37] Laureti S, Ricci M, Mohamed MNIB, Senni L, Davis LAJ, Hutchins DA. Detection of rebars in concrete using advanced ultrasonic pulse compression techniques. Ultrasonics 2017, doi.org/10.1016/j.ultras.2017.12.010
[38] Candoré J. C, Bodnar J. L, Detalle V, Grossel P. Non-destructive testing of works of art by stimulated infrared thermography. The European Physical Journal Applied Physics 2012, 57.2: 21002.
[39] Yao Y, Sfarra S, Lagüela S, Ibarra-Castanedo C, Wu JY, Maldague XPV, Ambrosini D. Active thermography testing and data analysis for the state of conservation of panel paintings. Int J Therm Sci 2018, 126:143–151.
[40] Sfarra S, Theodorakeas P, Ibarra-Castanedo C, Avdelidis NP, Paoletti A, Paoletti D, Hrissagis K, Bendada A, Koui M, Maldague X. Evaluation of defects in panel paintings using infrared, optical and ultrasonic techniques. Insight Non-Destructive Test. Cond. Monit. 2012, 54.1: 21–27.
[41] Sfarra S, Ibarra-Castanedo C, Ambrosini D, Paoletti D, Bendada A, Maldague X. Discovering the defects in paintings using non-destructive testing (NDT) techniques and passing through measurements of deformation. J Nondestruct Eval 2014, 33.3:358–383.
[42] Zhang H, Sfarra S, Saluja K, Peeters J, Fleuret J, Duan Y, Fernandes H, Avdelidis N, Ibarra-Castanedo C, Maldague X. Non-destructive Investigation of Paintings on Canvas by Continuous Wave Terahertz Imaging and Flash Thermography. J Nondestruct Eval 2017, 36.2:34.
[43] Cennini C. The Craftsman’s Handbook “Il Libro dell'Arte". Dover, 1933. [44] Blake W. Acrylic Painting: A Complete Guide. Courier Corporation, 1997.
[45] Arora V, Mulaveesala R, Bison P. Effect of spectral reshaping on frequency modulated thermal wave imaging for non-destructive testing and evaluation of steel material. Journal of Nonnon-destructive Evaluation 2016, 35.1:1-7.
[46] Ghali VS, Jonnalagadda N, Mulaveesala R. Three-dimensional pulse compression for infrared nondestructive testing. IEEE Sensors Journal 2009, 9.7:832-833.
[47] Gettens RJ, Stout GL. Painting materials : a short encyclopaedia. Dover Publications; 1966. [48] Carslaw H, Jaeger J. Conduction of heat in solids. Oxford Clarendon Press 1959, 2nd edition 1959.
[49] Burgholzer P. Thermodynamic Limits of Spatial Resolution in Active Thermography. Int J Thermophys 2015, 36.9:2328– 2341.
[50] Lopez F, De Paulo Nicolau V, Ibarra-Castanedo C, Maldague X. Thermal-numerical model and computational simulation of pulsed thermography inspection of carbon fiber-reinforced composites. Int J Therm Sci 2014, 86:325–340.
[51] Oelze ML. Bandwidth and resolution enhancement through pulse compression. IEEE Trans Ultrason Ferroelectr Freq Control 2007, 54.4.
[52] Arora V, Rawat K, Mulaveesala R, Tuli S. Effects of varying bandwidth on frequency modulated thermal wave imaging. Journal of Non-Destructive Testing and Evaluation 2013, 12.2:31-35.
[53] Sekko E, Thomas G, Boukrouche A. A deconvolution technique using optimal Wiener filtering and regularization. Signal Processing 1999, 72.1:23–32.
[55] Gan TH, Pallav P, Hutchins D A. Non-contact ultrasonic quality measurements of food products. J Food Eng 2006, 77.2:239–247.
[56] Arora V, Mulaveesala R. Pulse compression with gaussian weighted chirp modulated excitation for infrared thermal wave imaging. Prog Electromagn Res Lett 2014, 44:133–137.
[57] Burrascano P, Laureti S, Ricci M, Senni L, Silipigni G, Tomasello R. Reactance transformation to improve range resolution in pulse-compression detection systems. 2017 40th Int. Conf. Telecommun. Signal Process., IEEE; 2017, p. 480–483.
[58] Pallav P, Gan TH, Hutchins DA. Elliptical-Tukey Chirp Signal for Ultrasonic Imaging. IEEE Trans Ultrason Ferroelectr Freq Control 2007, 54.8.
[59] Burrascano P, Callegari S, Montisci A, Ricci M, Versaci M. Ultrasonic Nondestructive Evaluation Systems: Industrial Application Issues. Springer, 2014.
[60] Burrascano P, Laureti S, Senni L, Ricci M. Range Sidelobes Reduction for Pulse-Compression NDT based on Reactance Transformation, IEEE International Symposium of Circuits & Systems 2018, Florence 27-30 May 2018, Italy (accepted) [61] Dua G, Mulaveesala R, Siddique JA. Effect of spectral shaping on defect detection in frequency modulated thermal wave
imaging. Journal of Optics 2015, 17.2:025604.
[62] Mulaveesala R, Tuli S. Theory of frequency modulated thermal wave imaging for nondestructive subsurface defect detection. Applied Physics Letters 2006, 89.19:191913.