The young low-mass star ISO-Oph-50: extreme variability induced by a
clumpy, evolving circumstellar disc
Alexander Scholz,
1‹Koraljka Muˇzi´c
2and Vincent Geers
31School of Physics and Astronomy, University of St. Andrews, The North Haugh, St. Andrews, Fife KY16 9SS, UK
2European Southern Observatory, Alonso de C´ordova 3107, Casilla 19, Santiago 19001, Chile
3UK Astronomy Technology Centre, Royal Observatory Edinburgh, Blackford Hill, Edinburgh EH9 3HJ, UK
Accepted 2015 April 13. Received 2015 March 19; in original form 2014 December 17
A B S T R A C T
ISO-Oph-50 is a young low-mass object in the∼1 Myr old Ophiuchus star-forming region undergoing dramatic changes in its optical/near/mid-infrared brightness by 2–4 mag. We present new multi-band photometry and near-infrared spectra, combined with a synopsis of the existing literature data. Based on the spectroscopy, the source is confirmed as a mid-M dwarf, with evidence for ongoing accretion. The near-infrared light curves show large-scale variations, with 2–4 mag amplitude in the bandsIJHK, with the object generally being bluer when faint. Near its brightest state, the object shows colour changes consistent with variable extinction ofAV∼7 mag. High-cadence monitoring at 3.6µm reveals quasi-periodic variations with
a typical time-scale of 1–2 weeks. The best explanation for these characteristics is a low-mass star seen through circumstellar matter, whose complex variability is caused by changing inhomogeneities in the inner parts of the disc. When faint, the direct stellar emission is blocked; the near-infrared radiation is dominated by scattered light. When bright, the emission is consistent with a photosphere strongly reddened by circumstellar dust. Based on the available constraints, the inhomogeneities have to be located at or beyond∼0.1 au distance from the star. If this scenario turns out to be correct, a major portion of the inner disc has to be clumpy, structured, and/or in turmoil. In its observational characteristics, this object resembles other types of young stellar objects with variability caused in the inner disc. Compared to other objects, however, ISO-Oph-50 is clearly an extreme case, given the large amplitude of the brightness and colour changes combined with the erratic behaviour. ISO-Oph-50 has been near its brightest state since 2013; further monitoring is highly encouraged.
Key words: accretion, accretion discs – stars: activity – brown dwarfs – stars: low-mass –
stars: pre-main-sequence.
1 I N T R O D U C T I O N
Variability has long been known as a characteristic observational signature of young stars. Most common are light curves with peri-ods of days to weeks due to spots on the stellar surface, a fact that has been used for almost three decades to infer the rotation peri-ods of young stars (Bouvier & Bertout1989; Herbst et al.2007). Apart from these regular changes, a fraction of young stellar ob-jects (YSOs) shows evidence for large-scale, partly irregular vari-ations (Herbst et al.1994). This was originally one of the criteria for the definition of the class of ‘T Tauri stars’ (Joy1945). Some of the irregular variability follows patterns that are well-explained by astrophysical phenomena, including hot accretion-induced spots (Vrba et al.1989; Bouvier et al.1995), magnetic flares (Rydgren
E-mail:[email protected]
& Vrba1983; Welty & Ramsey1995), accretion bursts (the FU Ori and EX Lupi events; Herbig1989; Hartmann & Kenyon1996), and obscurations by circumstellar material. The latter includes the UX Ori phenomena for Herbig Ae/Be stars (Grinin et al.1991), but also other types (Hamilton et al.2001; Rodr´ıguez-Ledesma et al. 2012). Variable extinction may be the reason for the extreme fluc-tuations observed in the prototype, T Tauri (Beck & Simon2001). Often young stars are affected by several of these processes. For a comprehensive discussion of the various factors that contribute to YSO variability and a discussion of possible models, see Carpenter, Hillenbrand & Skrutskie (2001), Scholz et al. (2009b), and Wolk, Rice & Aspin (2013).
Although extreme variables have been defining prototypes for young stellar objects, their overall fraction is low. In the near-infrared, only 2–3 per cent of an unbiased sample of YSOs show variations larger than 0.5 mag over time-scales up to several years (Scholz 2012). In the optical, that fraction rises to ∼10 per cent
2015 The Authors
at University of St Andrews on August 13, 2015
http://mnras.oxfordjournals.org/
(Rigon et al., in preparation). The subset of YSOs variable on time-scales of years is only 10–20 per cent in the mid-infrared (Rebull et al.2014). The fraction of extremely variable YSOs drops with age; only very few are known older than 5 Myr (Mamajek et al. 2012; Grinin, Potravnov & Musaev2010), in line with typical disc lifetimes. Despite their rarity, YSOs with strong variations present unique insights into specific processes and phases occurring during the first few million years in a star’s life (e.g. episodes of strong accretion). In particular, YSOs which are obscured by their discs can provide information about the structure and the evolution of circumstellar accretion discs, the properties of the dust grains in the vicinity of the star, as well as the initial conditions of planet for-mation (e.g. Mora et al.2002; Herbst et al.2008; Rodriguez et al. 2013).
So far, most of the detailed studies of extreme T Tauri variability have been carried out in the optical and for stars more massive or similar in mass to the Sun. Current studies are driven by large-scale optical variability surveys (e.g. Super-Wide Angle Search for Plan-ets (WASP), Kilodegree Extremely Little Telescope (KELT), Palo-mar Transient Factory (PTF), Kepler,Gaia). Many deeply embed-ded and very low mass YSOs are not covered by such surveys. On the other hand, given the fact that most stars have masses<0.5 M and that the occurrence of extreme variability declines with age, it is interesting to investigate the aforementioned phenomena for lower-mass objects and in the embedded phase, to probe how applicable the proposed explanations are to the youngest and more typical YSOs. As an example, it was recently found that an embedded very low mass star undergoes an FU Ori-like outburst, demonstrating that accretion bursts can occur over a wide range of stellar masses (Caratti o Garatti et al.2011).
Here we present new observations for the infrared source ISO-Oph-50, located in the∼1 Myrρ Oph star-forming region.1The
object was identified by Bontemps et al. (2001) from ISO observa-tions and tentatively classified as Class III (i.e. without disc) based on the infrared SED slope. More recent studies based onSpitzer data put it at an earlier evolutionary state of Class I or II (Alves de Oliveira et al.2012; G¨unther et al.2014). ISO-Oph-50 has been known to show extreme variability in the infrared (Alves de Oliveira & Casali2008; Scholz, Froebrich & Wood2013). So far, the only available spectrum shows that the object is an M-dwarf (Alves de Oliveira et al.2012). The source has excess emission in the mid-infrared indicating the presence of circumstellar dust, but so far there is no evidence for ongoing accretion. In this paper we analyse new multi-band photometry and near-infrared spectra and discuss possible explanations for the variability.
2 O B S E RVAT I O N S
2.1 SMARTS photometry
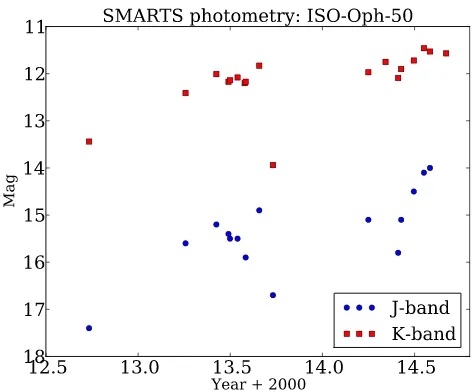
We used the 1.3-m telescope at the Cerro Tololo International Ob-servatory to obtain long-term photometry for ISO-Oph-50, in the framework of guaranteed observing time through the SMARTS col-laboration. In total we observed the source in 20 nights spread over 2 years. The telescope is equipped with Andicam, a dual-channel camera which takes optical and near-infrared images simultane-ously. Our observing scripts first take images inIandJband, then RandKband (with the exception of the very first epoch in which we observed inHinstead ofK). ISO-Oph-50 is not visible in the
[image:2.595.310.548.54.250.2]12MASS J16263682−2419002, J2000 coordinates: 16:26:36.8,−24:19:00.
Figure 1. SMARTSJ/K-band light curve for ISO-Oph-50 covering two years. Errors inJandKare±0.1 and±0.05 mag, respectively.
R-band frames, and only barely detected in mostI-band images. All observations were done at low airmass ranging from 1.0 to 1.5.
In the near-infrared bands, the object was observed in a five po-sition dither pattern with integration times of 5×30 s per band. A standard image reduction was carried out, including sky sub-traction, flat-fielding and aperture photometry. While theJ-band images show only our target, theH- andK-band images cover three more stars with 2MASS photometry. We calibrated the photometry in relation to the 2MASS values for these three stars. The offset between instrumentalK-band magnitudesKinstand 2MASSK-band
magnitudesK2Mremains stable atKinst−K2M=3.0±0.1 and does
not significantly depend on the colour of the comparison stars. This offset includes the constant zero-point and an extinction term, the variations of±0.1 are consistent with a combination of photometric errors and the varying airmass. Typical errors of theK-band mag-nitudes are±0.05 mag, combining the calibration uncertainties and the photometric error.
Since we do not have a calibration star in theJband, we have established the offset between instrumental magnitudes and 2MASS magnitudes from observations of other fields, published in Scholz et al. (2013). The offset in theJband isJinst−J2M ∼2.5±0.1
through seasons 2012 to 2014. Similarly to theKband, this value is stable within the quoted error bars and for the given airmass range. We adopt this offset for all our observations of ISO-Oph-50. Since we cannot measure the offset for the images themselves, the resulting uncertainties may be as large as±0.1 (comparable to the variations in the offset). The calibratedJ- andK-band light curves are plotted in Fig.1.
For the optical images, we obtained three images per band at the same position, each with an integration time of 110 s. To increase signal-to-noise ratio (S/N), theI-band images were co-added. As calibration star, we used the object2MASS J16264285−2420299 (or ISO-Oph-62), which has a DENISI-band magnitude of 14.355 and does not show signs of significant variability. The uncertainty in theI-band measurements is in the range of±0.3 mag. This estimate includes the photometric error (±0.1 mag) plus possible calibration systematics.
The full SMARTS photometry is listed in Table A1. This table also includes the first epoch of SMARTS photometry inJandH band which was already published in Scholz et al. (2013) for 2012 August 12.
at University of St Andrews on August 13, 2015
http://mnras.oxfordjournals.org/
2.2 NTT/SOFI spectroscopy
We took two spectra of ISO-Oph-50 using SOFI (Son of ISAAC; Moorwood et al.1998) at the ESO’s New Technology Telescope (NTT) during the nights of 2014 April 13 and 19, under the programme number 093.C-0050(A). We used two low-resolution grisms, covering the wavelength range 0.95–1.64µm (Blue Grism) and 1.5–2.5µm (Red Grism) with 1 arcsec slit, resulting in spectral resolutionR∼600.
Data reduction was performed by combining the SOFI pipeline recipes, our IDL routines, and theIRAFtaskAPALL. The data reduction steps include cross-talk, flat-field, and distortion corrections. Pairs of frames at different nodding positions were subtracted one from another, shifted, and combined into a final frame. We extracted the spectra using theIRAFtaskAPALLand wavelength calibrated using
the solution obtained by the pipeline. The spectra of telluric standard stars were reduced in the same way as the science frames. Telluric standards (spectral types B2V and B5V) show several prominent hydrogen lines in absorption, which we removed from the spectra by interpolation, prior to division with the blackbody spectrum at an appropriate effective temperature. This yields the response function of the spectrograph. Finally, we divided the science spectra by the corresponding response function.
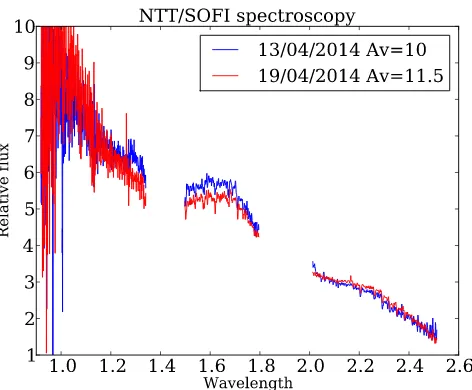
We also reduced theK-band acquisition images and measured magnitudes of 11.85 and 12.00 for April 13 and 19, respectively. These values were derived in comparison with several 2MASS stars in the same field of view. We scaled the spectra so that the ratio of the integratedK-band fluxes corresponds to the flux ratio as determined from the photometry. We also scaled each of the two blue spectra so that they match the corresponding red spectrum in the overlapping wavelength range in theHband. That way, although the two spectra are not calibrated in an absolute flux scale, they can be compared with each other across the entire wavelength regime. The full spectra are shown in Fig.2; theHandKband are plotted separately in Fig.3.
2.3 Mid-infrared photometry
[image:3.595.42.282.493.684.2]ISO-Oph-50 has been observed multiple times with the IRAC in-strument on-boardSpitzer, mostly in the framework of the project
Figure 2. NTT/SOFI spectra for ISO-Oph-50 taken on 2014 April 13 and 19. The two spectra are calibrated against each other using the K-band magnitudes obtained from the acquisition images. The accretion-related lines Paschenβand Bracketγare marked.
YSOVAR [PI: J. Stauffer, see Morales-Calder´on et al. (2011); Re-bull et al. (2014)]. The ρ Oph survey as part of YSOVAR has recently been published by G¨unther et al. (2014). In their paper, ISO-Oph-50 is found to be strongly variable with a reducedχ2of
821.89, second highest in their sample, confirming the exceptional nature of this source. We compiled all available images for ISO-Oph-50 taken in theSpitzerchannels 1 and 2 (3.6 and 4.5µm) and measured the flux of the source. In total, we obtained 104 epochs in IRAC1 and 20 epochs in IRAC2. Fluxes were converted to magni-tudes using appropriate aperture corrections and zero-points of 281 and 180 Jy for channels 1 and 2, respectively. The calibration was verified by comparing with the publicly available fluxes from the C2D Legacy project (Evans et al.2009). Typical uncertainties in theSpitzerfluxes are±0.05 mag. We note that the YSOVAR light curve (see fig. 13 in G¨unther et al.2014) shows exactly the same features as ours.
In addition, we collected 12 epochs ofWISEdata from theWISE All-Sky Single Epoch data base. This includes photometry in the filter W1 and W2 (3.4µm and 4.6µm), which are equivalent to the Spitzerchannels 1 and 2, but also W3 and W4 magnitudes at 12 and 22µm, a wavelength domain not covered anymore bySpitzer. ISO-Oph-50 is only detected at S/N>10 in eight out of 12 epochs in W3 and five out of 12 in W4; in the following we only use these robust detections. Typical uncertainties of theWISEphotometry are <0.05 for W1 and W2, and<0.1 for W3 and W4. Compared with these uncertainties, the object is significantly variable in all four WISEchannels, with amplitudes from maximum to minimum of 0.27, 0.17, 0.47, 0.7 mag in W1–W4. TheWISEcolour W1–W2 increases by 0.2 mag as the object gets fainter in W1.
The full mid-infrared light curve in the two short-wavelength bands is shown in Fig.4, which combinesSpitzerandWISEdata. We also list the photometry in Tables A2 to A4.
3 T H E C O M P L E X VA R I A B I L I T Y O F I S O - O P H - 5 0
ISO-Oph-50 has now been observed for more than 20 years. The observational record prior to this paper has been summarized by Alves de Oliveira et al. (2012) (see in particular their fig. 5), but a convincing interpretation of the data is still missing. Our continuous monitoring in the near-infrared, our spectroscopy, plus the new mid-infrared data, now adds significantly to the empirical constraints. In the following we will present the observational evidence in its entirety.
3.1 Near-infrared light curve
In Fig. 5 we plot the long-term light curve for ISO-Oph-50 in the near-infrared bands and colours, combining all literature data and our own new photometry. This is an updated version of fig. 5 in Alves de Oliveira et al. (2012), containing data points from 2MASS (Skrutskie et al.2006), UKIDSS (Lawrence et al. 2007) and a variety of other sources (Barsony et al.1997,2012; Alves de Oliveira & Casali2008; Geers et al.2011; Scholz et al. 2013).2The photometric records show that the object is strongly
2In addition, the object was not detected by DENIS in 1999 June, which roughly impliesJ>16 andK>14. We note that the object is not covered by the second release of the VISTA Hemisphere Survey; later releases of the survey are expected to add another epoch.
at University of St Andrews on August 13, 2015
http://mnras.oxfordjournals.org/
Figure 3. NTT/SOFI spectra for ISO-Oph-50 taken on 2014 April 13 and 19; close-up view of theHandKband. Several photospheric absorption features are marked.
Figure 4. Mid-infrared photometry fromSpitzerandWISEfor ISO-Oph-50. The left panel shows the full light curve, and the right panel a detailed view of the data from the year 2010 in the 3.4–3.6µm band.
Figure 5. Long-term light curve for ISO-Oph-50, including data from var-ious sources in the literature and our SMARTS photometry. See Section 3.1 for more details.
variable. Its magnitude changes roughly from 12 to 16 in the K band, from 13 to 16 in theHband, and from 14 to 17 in theJband. There is some evidence for a bimodal behaviour, in the sense that the object spends prolonged periods of time near its brightest and faintest state. Most of our own SMARTS data points from 2013–14 are near the brightest state aroundK∼12. The object was similarly bright in 2006 in the light curve presented by Alves de Oliveira & Casali (2008), withK∼12–13 andH∼14. An individual data point from 1993 is also atK∼12. On the other hand, the object was found to be significantly fainter in 2005 withK∼15 andH∼16. Data points from 1999 and 2007 are on a similar level. The near-infrared light curves show that the transition from faint to bright and vice versa has to occur on a time-scale significantly shorter than one year. The large drop at the end of 2013 may indicate that the transition is as short as one month. In addition, Fig.5may indicate a gradual brightening between 2009 and 2014. Considering the years with photometry, the object seems to spend about half of the time in bright state and the other half in faint state.
The large-scale variability evident in the long-term light curve is associated with an intriguing colour trend, first noted by Alves de
at University of St Andrews on August 13, 2015
http://mnras.oxfordjournals.org/
[image:4.595.48.283.510.687.2]Figure 6. Colour–magnitude plot for the new SMARTS near-infrared pho-tometry of ISO-Oph-50 covering the years 2012–2014. An extinction vector is overplotted, using the reddening law by Mathis (1990).
Oliveira & Casali (2008). The object is usually significantly redder when bright, or conversely, bluer when faint. For example, between 2005 and 2006 ISO-Oph-50 became brighter by several magnitudes and redder by 0.8 mag inH−K. Also, in 2013–14 the object was bright (K∼12) and red (J−K=3–4), while in 2005, 2007 and 2008 it was faint (K∼15) and significantly bluer (J−K∼2). This behaviour, however, does not hold for all data points (see e.g. the 2MASS data points in 1999 when the object was faint and red). The colour trend is further discussed in Section 5.
Near its maximum flux, ISO-Oph-50 shows some additional vari-ability on time-scales of weeks with amplitudes less than 1 mag in K band, as seen in the 2006 light curve from Alves de Oliveira & Casali (2008) and in our SMARTS photometry from 2012–14 (see Fig.1). Our colour–magnitude plot (Fig.6) demonstrates that during that period the object mostly becomes redder when fainter, i.e. a colour trend opposite the one seen in the long-term evolution. The colour variability is following roughly the extinction vector, which is overplotted in Fig.6. This implies that variable extinction is likely the main driver for the bright state fluctuations observed for ISO-Oph-50. In the 2013–14 data, theJ−Kcolour varies by 1.4 mag, which corresponds to opticalAVvariations by about 7 mag.
Again there are two interesting exceptions in 2012–14 which do not fit the reddening vector. Compared with the reddening trend in the remaining (J−K,J) data set, these two measurements are much too blue for theK-band brightness. This could be the same ‘blue when faint’ effect seen in the long-term light curve (see above).
3.2 Mid-infrared light curve
The mid-infrared photometry fromSpitzerandWISE(Fig.4) shows evidence for variations by up to 3 mag at 3.6µm and 2 mag at 4.5µm, and also for variability at 12 and 22µm (albeit with sparse sampling). This was already pointed out in Scholz et al. (2013). Overall, the object gradually became brighter from 2010 to 2013, which is similar to the trend seen in the near-infrared light curve over this time-span.
In the year 2010 the object was frequently visited byWISEand Spitzerat 3.6µm, resulting in the only high-cadence light curve for this object thus far (see Fig.4, right panel). TheSpitzerdata set shows up to one magnitude of variations with a typical time-scale
of 1–2 weeks. These changes can be called ’quasi-periodic’ in the sense that the brightness goes up and down with some regularity, but both the amplitude and the period change. This morphology could correspond to a series of eclipses of varying depths, with a decrease in flux by 0.2–0.8 mag followed by an increase, without flat bottom. The lack of colour information makes it difficult to constrain the nature of these variations any further. We note that G¨unther et al. (2014) find a ‘characteristic time-scale’ of 5.6 d from an autocorrelation analysis of the 3.6µm light curve of ISO-Oph-50, confirming that the dominant time-scale of this quasi-periodic behaviour is around one week.
3.3 Near-infrared spectroscopy
Our near-infrared spectra (Fig.2) show the typical spectral signature of a young mid-M dwarf, with the broad peaks inHandKband caused by water absorption as well as the CO absorption band heads at>2.3µm (e.g. Scholz et al.2009a). TheKband shows lines at 2.21, and 2.26µm (see Fig.3), which are most likely caused by NaI
and CaIabsorption (Cushing, Rayner & Vacca2005). Both lines
are typical for M3–M5 dwarfs. A few more possible photospheric lines are seen in theHband (Fe H at 1.62, AlIat 1.67, and MgIat 1.71µm); all three are again characteristic for the M1–M5 regime. Based on theK-band photometry in the acquisition images, the object was near its brightest state when the spectra were taken. As pointed out in Section 3.1, the near-infrared emission in bright state is subject to significant reddening. To deredden the spectrum, we adopt an extinction ofAv∼10, which was estimated from the K-band magnitude of∼12 in the acquisition image and the colour trend seen in Fig.6, assuming a photosphericJ−Kof 1.0, which is appropriate for such an M-type object. This was done following the typical extinction vector shown in Fig.6, using the reddening law by Mathis (1990). After dereddening the spectra, we estimate spectral types using two different indices and obtain M6 (H2O index; Allers et al.2007) and M4 (H2O-K2 index; Rojas-Ayala et al.2012). As shown recently by Dawson et al. (2014), these two indices yield consistent results within one subtype for young mid to late M-type objects, but while the H2O index is only calibrated for spectral types of M5 or later, the H2O-K2 index covers the full M-type regime. Thus, we put more credence into the result from H2O-K2 and conclude that the spectral type is M4 with an uncertainty of one subtype. For comparison, the only previous spectrum available was taken in the optical by Alves de Oliveira et al. (2012). They estimate an extinction ofAV=4.7 mag and a spectral type of M3.5,
consistent with our value.
Our spectra show some evidence for ongoing accretion, based on the presence of Paschen β and Bracket γ emission features (Natta et al.2004). This further confirms the youth of the object. Interestingly, the optical spectrum in faint state does not show any Hαemission or other evidence for accretion (Alves de Oliveira et al. 2012).
Our two spectra, taken 6 d apart near light-curve maximum (K=11.85 and 12.0), show significant spectral variability (Fig.2). The spectrum taken on 2014 April 13 is brighter and bluer than the one from April 19. This variation can approximately be accounted for by variable extinction. Assuming AV =10 for April 13 and
AV= 11.5 for April 19 would result in quite similar dereddened
spectra with remaining differences in the range of 10 per cent (see Fig.7). As pointed out in Section 3.1 such extinction variations are consistent with the photometric light curve in the bright state.
at University of St Andrews on August 13, 2015
http://mnras.oxfordjournals.org/
Figure 7. Dereddened spectra for ISO-Oph-50 taken on 2014 April 13 and 19.
4 T H E C E N T R A L O B J E C T: A N
U N D E R L U M I N O U S V E RY L OW M A S S S TA R
With the available spectroscopy and photometry we can place con-straints on the nature of the central object. The estimated spec-tral type of M4 would correspond to an effective temperature of about 3400±200 K (Muˇzi´c et al. 2014) and a mass of around 0.4 M, assuming an age of 1 Myr (BCAH isochrone; Baraffe et al. 1998). Given the uncertainty in spectral typing and con-version to temperature, the plausible range for the mass is 0.2– 0.6 M. Thus, the central object is a low-mass star. Given the evidence for variability, accretion, strong extinction and excess emission from the disc, plus the uncertainty in the age and the evo-lutionary tracks, a more precise estimate of the mass is difficult to obtain.
According to the 1 Myr BCAH isochrones, theK-band brightness for a 0.2–0.6 Mstar at the distance ofρOph (140 pc) and at an age of 1 Myr would be 8 to 9.5 mag. This is 5–7 mag brighter than the minimum light of ISO-Oph-50; as already pointed out by Alves de Oliveira et al. (2012) the object is significantly underluminous. Thus, during the faint state most of the light from the central source has to be blocked by optically thick material along the line of sight. A plausible explanation is that the plane of the disc is approximately in the line of sight, i.e. we see the object through an edge-on disc. The colours near minimum are only slightly redder than expected for a mid-M dwarf (according to BCAH,H−K∼0.2–0.3,J− K∼1.0), in line with the presence of an edge-on disc, as in this case the radiation near minimum is expected to be dominated by scattered light, which makes the object appear bluer (for reference, see the models by Kenyon et al.1993). This is not unlike the colour– magnitude trends seen in other young sources seen through an edge-on disc (Jayawardhana et al.2002; Scholz et al.2010).
Even near maximum the object appears underluminous by 2– 4 mag inKandJ, respectively. Extrapolating from the colour trend seen in Fig.6to a photosphericJ−K=1.0 results in a dereddened K-band brightness ofK∼10.5, much closer to the expected value but still underluminous. This could mean that the source is only partially visible in bright state or that is in fact at the low-mass end of the plausible range of masses.
5 T H E O R I G I N O F T H E VA R I A B I L I T Y
5.1 Summary of observational evidence
According to the analysis in the previous section, ISO-Oph-50 shows the following characteristics.
(i) The central source is a very low mass star affected by strong reddening and excess infrared emission.
(ii) The object is underluminous at all times, but particularly so when near light-curve minimum, by up to 5–7 mag in theKband. This is indicative of an object seen through an edge-on disc.
(iii) The near-infrared light curve shows large-scale variations over time-scales of months and years. During these variations the object mostly becomes bluer when fainter.
(iv) Furthermore, the object exhibits small-scale changes in the near-infrared fluxes on time-scales of weeks to months. Here the object becomes redder when fainter, consistent with changes in extinctionAVby several magnitudes.
(v) In the mid-infrared the object shows variability characteristics similar to the near-infrared. High-cadence monitoring reveals quasi-periodic changes on time-scales of 1–2 weeks.
(vi) There is evidence for accretion when the object is in maxi-mum light, but not in minimaxi-mum.
In the following we will investigate possible scenarios that may explain these properties. We emphasize that what we propose here is mostly a qualitative scenario for the main features of the source; detailed modelling is required to clarify details.
5.2 A clumpy disc seen at high inclination
The most conservative statement about the cause of the variability is that it arises in the inner parts of the disc. This is supported by three pieces of evidence: (a) near- and mid-infrared light curve shows the same trend. (b) Short-term colour variations are consistent with changes in extinction along the line of sight; the time-scales of weeks to months indicate that the material responsible for these changes has to be close, but not on the central object. (c) Over long time-scales the objects become redder when brighter; the opposite would be expected for any source of variability at the photospheric level (i.e. hot or cool spots). As pointed out in Section 4, the under-luminosity as well as the colour near minimum can be understood by a disc seen at high inclination (i.e. close to edge-on).
We suggest therefore that the most likely explanation for the com-plex variability of ISO-Oph-50 is a very low mass star surrounded by an inhomogenuous (’clumpy’) edge-on disc. Near its brightness maximum, the central source is directly visible, but seen through substantial and variable extinction ofAV=10–15 mag. The light
from the star may have to travel through optically thin parts of the disc, either the upper layers or a gap in the mid-plane. In addition, the inner disc is visible to the observer, i.e. the source also appears bright in the mid-infrared. In minimum, the direct light from the central object, the thermal emission from the inner disc, and the emission from the accretion flow as well are blocked by optically thick material along the line of sight. Instead, the object is seen in scattered light and thus appears bluer than in bright state. The change from bright to faint could be caused by a clump of material moving into the line of sight due to the disc rotation or due to pre-cession of the disc. This scenario can qualitatively explain all the features listed in Section 5.1.
If the inhomogeneities in the disc of ISO-Oph-50 are persistent features in Keplerian rotation, the time-scale of the variations gives
at University of St Andrews on August 13, 2015
http://mnras.oxfordjournals.org/
us some idea about the location of the features relative to the central source. The quasi-periodic changes seen at 3.6µm in 2010 occur with a typical cycle of 1–2 weeks. The small-scale variations seen in 2012–14, mostly consistent with variable extinction, also occur on time-scales of a few weeks. This would correspond to a feature at a distance of 0.05 to 0.15 au in Keplerian rotation. For a low-mass star, this distance is well beyond the radius of magnetospheric truncation and just beyond the dust sublimation radius, i.e. the features would be placed close to the inner edge of the dusty disc.
However, if the variability is caused by only one feature, we would expect to see a repeatable pattern, stable amplitudes or per-haps a flat portion of the light curve, and not the irregular variability discussed in Section 3. More likely, a multitude of evolving features in the inner disc of different size and density are responsible for the complex variability. Some of them may be optically thick and thus obscure the central source when passing through the line of sight. Others are optically thin and only affect the light through variable extinction. With multiple features, the distance from the central ob-ject could be significantly larger than the value derived above for the single-occulter scenario. The fact that ISO-Oph-50 is variable all the time tells us that the inhomogeneities are present in a major portion of the inner disc. Furthermore, the lack of pattern indicates that some of the clumps may be transient features that are formed on time-scales of weeks to years and decay on similar time-scales. The large amplitude of the variations, the lack of a clear long-term period, the seemingly erratic behaviour, the various irregularities, and the colour trend observed in the long-term variations distinguish this object from other young low-mass stars with evidence for ob-scuration by disc material, for example KH15D (Hamilton et al. 2001), AA Tau (Bouvier et al.2003,2013), or WL4 (Plavchan et al. 2008). Flaherty et al. (2013) find that a majority of stars with discs show mid-infrared variations, albeit with much smaller amplitudes than ISO-Oph-50, concluding that rapid changes in the inner disc are quite common. Based on near-infrared light curves, Carpenter et al. (2001) and, more recently, Wolk et al. (2013) also find objects with variability indicating changes in the inner disc. Some of the objects discussed by Wolk et al. (2013) show puzzling changes in the colour trend, similar to ISO-Oph-50 (see e.g. RWA 2 and RWA 7 in their paper).
The behaviour of ISO-Oph-50 is in some ways reminiscent of UX Ori-type Herbig Ae/Be stars (e.g. Grinin et al.1991; Natta & Whitney2000; Dullemond et al.2003). These objects are usually described as stars with nearly edge-on discs in which clumps of dust and gas are temporarily in the line of sight and cause irregular, long eclipses. Since the obscuration events in UX Ori stars occur on time-scales of weeks to months, the occulting clumps have to be located in the puffed-up inner rim of the disc, rather than the outer flaring disc (Dullemond et al.2003, see their fig. 1). ISO-Oph-50 could be a version of the same phenomenon, but with a central object that is by an order of magnitude less massive. For such low-luminosity objects, the scale of the disc is different. The inner edge of the dusty disc is closer to the central object (0.1 au). Flaring dominates the disc geometry between 0.1 and 1 au (see the modelling in Scholz et al.2007, 2009b). Thus, in contrast to its more massive counterparts, the occulters in the disc of ISO-Oph-50 are not necessarily located at the inner edge of the disc, they could be spread over a range of distances.
Thus, compared with the literature, ISO-Oph-50 is an extreme case of YSO variability, but following trends which have been ob-served on a smaller scale in other young sources. The physical origin of the inhomogeneities is difficult to constrain from the ex-isting data. The clumps could be density enhancements (e.g. spiral
structure or vortices) or geometrical anomalies (e.g. warps or walls), as found for other young stellar objects. It is possible that the ex-treme behaviour of ISO-Oph-50 is solely due to a high inclination of the disc. Other explanations include a recent perturbation of the disc, for example by an accretion burst or by an instability.
5.3 Alternative scenarios
Here, we briefly consider two possible alternative scenarios pro-posed in the literature for the behaviour of ISO-Oph-50. Based on the flux increase between the 2005 and 2006 light curve, Alves de Oliveira & Casali (2008) conclude that ISO-Oph-50 could be an object undergoing an accretion burst. Since it was observed to be bright before, this would be a recurrent phenomenon, perhaps comparable to the prototype EX Lupi. Including the more recent data, there are several arguments against this scenario. First, as al-ready pointed out in Scholz et al. (2013), EX Lupi is observed in outburst only about 10 per cent of the time (Herbig2007), whereas ISO-Oph-50 could be near maximum about half of the time (see Section 3.1). Secondly, the source is bluer when fainter, which is not what is observed in EX Lupi-type objects (Aspin & Reipurth 2009). Thirdly, ISO-Oph-50 is clearly too faint for its spectral type, even in its bright state (Section 4), which essentially excludes that the faint state represents the quiescent period between two accretion bursts. And fourthly, the object does not bear the typical spectro-scopic signatures of an FU Ori burst (high veiling, no photospheric absorption lines, excess CO absorption and emission; see Connelley & Greene2010). For all these reasons, accretion bursts alone do not provide a satisfactory explanation for the observed variability, but could contribute to some of the variations.
Alves de Oliveira et al. (2012) speculate that ISO-Oph-50 consists of ‘two objects with similar spectral type, one having strong IR excess and undergoing variable circumstellar extinction by the disc (i.e. close to edge-on), the other component either disc free or at least not obscured by its disc.’ At maximum brightness, both stars would be visible. In minimum, the primary would be obscured by its disc, the light thus be dominated by the secondary. Since the secondary is disc-less, the emission would become bluer. As outlined above, changes in circumstellar extinction do explain parts of the variability, but there is no independent evidence for ISO-Oph-50 being a binary. If it is a binary, we would expect the object to be overluminous near maximum when both components are visible, whereas in reality it may still be fainter than the intrinsic brightness of one star with the appropriate spectral type (see Section 4). The assumption that the system contains a disc-less companions adds complications to the proposed scenario, but cannot be excluded based on the available data.
5.4 Further observations
Continued and more detailed observations of ISO-Oph-50 could provide a wealth of information about the spatial distribution of dust in the inner disc. The structures discussed here are too small for imaging with high spatial resolution, and the object too faint for optical/infrared interferometry. The dominance of scattered light in faint state could be verified with polarimetric observations, but that as well will be challenging for this faint source. If the proposed scenario outlined above is correct, one might also expect significant changes in spectroscopic features in the mid-infrared (e.g. ice fea-ture; see Pontoppidan et al.2005). Apart from these specific tests, the best strategy to map the circumstellar environment of ISO-Oph-50 is prolonged multi-band (or spectrophotometric) monitoring in
at University of St Andrews on August 13, 2015
http://mnras.oxfordjournals.org/
the near/mid-infrared. To test the structure of the outer disc, com-plementary submm/mm interferometry would be beneficial. Since the object is currently near its brightest state, it currently presents us with a unique chance to obtain more detailed insights.
AC K N OW L E D G E M E N T S
We thank Catarina Alves de Oliveira and Ray Jayawardhana for useful comments on an early draft of this paper. This publication makes use of images obtained with SMARTS telescopes; AS is grateful for the support received through the collaboration. This work makes use of observations made with theSpitzerSpace Tele-scope, which is operated by the Jet Propulsion Laboratory, Califor-nia Institute of Technology under a contract with NASA. Part of this work was funded by the Science Foundation Ireland through grant no. 10/RFP/AST2780.
R E F E R E N C E S
Allers K. N. et al., 2007, ApJ, 657, 511
Alves de Oliveira C., Casali M., 2008, A&A, 485, 155
Alves de Oliveira C., Moraux E., Bouvier J., Bouy H., 2012, A&A, 539, A151
Aspin C., Reipurth B., 2009, AJ, 138, 1137
Baraffe I., Chabrier G., Allard F., Hauschildt P. H., 1998, A&A, 337, 403 Barsony M., Kenyon S. J., Lada E. A., Teuben P. J., 1997, ApJS, 112, 109 Barsony M., Haisch K. E., Marsh K. A., McCarthy C., 2012, ApJ, 751, 22 Beck T. L., Simon M., 2001, AJ, 122, 413
Bontemps S. et al., 2001, A&A, 372, 173 Bouvier J., Bertout C., 1989, A&A, 211, 99
Bouvier J., Covino E., Kovo O., Martin E. L., Matthews J. M., Terranegra L., Beck S. C., 1995, A&A, 299, 89
Bouvier J. et al., 2003, A&A, 409, 169
Bouvier J., Grankin K., Ellerbroek L. E., Bouy H., Barrado D., 2013, A&A, 557, A77
Carattio Garatti A. et al., 2011, A&A, 526, L1
Carpenter J. M., Hillenbrand L. A., Skrutskie M. F., 2001, AJ, 121, 3160 Connelley M. S., Greene T. P., 2010, AJ, 140, 1214
Cushing M. C., Rayner J. T., Vacca W. D., 2005, ApJ, 623, 1115
Dawson P., Scholz A., Ray T. P., Peterson D. E., Rodgers-Lee D., Geers V., 2014, MNRAS, 442, 1586
Dullemond C. P., van den Ancker M. E., Acke B., van Boekel R., 2003, ApJ, 594, L47
Evans N. J. et al., 2009, ApJS, 181, 321
Flaherty K. M., Muzerolle J., Rieke G., Gutermuth R., Balog Z., Herbst W., Megeath S. T., 2013, AJ, 145, 66
Geers V., Scholz A., Jayawardhana R., Lee E., Lafreni`ere D., Tamura M., 2011, ApJ, 726, 23
Grinin V. P., Kiselev N. N., Chernova G. P., Minikulov N. K., Voshchinnikov N. V., 1991, Ap&SS, 186, 283
Grinin V. P., Potravnov I. S., Musaev F. A., 2010, A&A, 524, A8 G¨unther H. M. et al., 2014, AJ, 148, 122
Hamilton C. M., Herbst W., Shih C., Ferro A. J., 2001, ApJ, 554, L201 Hartmann L., Kenyon S. J., 1996, ARA&A, 34, 207
Herbig G. H., 1989, in Reipurth B., ed., European Southern Observatory Conference and Workshop Proceedings, Vol. 33 FU Orionis Eruptions. European Southern Observatory, p. 233
Herbig G. H., 2007, AJ, 133, 2679
Herbst W., Herbst D. K., Grossman E. J., Weinstein D., 1994, AJ, 108, 1906 Herbst W., Eisl¨offel J., Mundt R., Scholz A., 2007, Protostars and Planets
V. University of Arizona Press, Tucson, p. 297
Herbst W., Hamilton C. M., Leduc K., Winn J. N., Johns-Krull C. M., Mundt R., Ibrahimov M., 2008, Nature, 452, 194
Jayawardhana R., Luhman K. L., D’Alessio P., Stauffer J. R., 2002, ApJ, 571, L51
Joy A. H., 1945, ApJ, 102, 168
Kenyon S. J., Whitney B. A., Gomez M., Hartmann L., 1993, ApJ, 414, 773
Lawrence A. et al., 2007, MNRAS, 379, 1599
Mamajek E. E., Quillen A. C., Pecaut M. J., Moolekamp F., Scott E. L., Kenworthy M. A., Collier Cameron A., Parley N. R., 2012, AJ, 143, 72 Mathis J. S., 1990, ARA&A, 28, 37
Moorwood A. et al., 1998, The Messenger, 94, 7 Mora A. et al., 2002, A&A, 393, 259
Morales-Calder´on M. et al., 2011, ApJ, 733, 50
Muˇzi´c K., Scholz A., Geers V. C., Jayawardhana R., L´opez Mart´ı B., 2014, ApJ, 785, 159
Natta A., Whitney B. A., 2000, A&A, 364, 633
Natta A., Testi L., Muzerolle J., Randich S., Comer´on F., Persi P., 2004, A&A, 424, 603
Plavchan P., Gee A. H., Stapelfeldt K., Becker A., 2008, ApJ, 684, L37 Pontoppidan K. M., Dullemond C. P., van Dishoeck E. F., Blake G. A.,
Boogert A. C. A., Evans N. J., II, Kessler-Silacci J. E., Lahuis F., 2005, ApJ, 622, 463
Rebull L. M. et al., 2014, AJ, 148, 92
Rodriguez J. E., Pepper J., Stassun K. G., Siverd R. J., Cargile P., Beatty T. G., Gaudi B. S., 2013, AJ, 146, 112
Rodr´ıguez-Ledesma M. V., Mundt R., Ibrahimov M., Messina S., Parihar P., Hessman F. V., Alves de Oliveira C., Herbst W., 2012, A&A, 544, A112 Rojas-Ayala B., Covey K. R., Muirhead P. S., Lloyd J. P., 2012, ApJ, 748,
93
Rydgren A. E., Vrba F. J., 1983, ApJ, 267, 191 Scholz A., 2012, MNRAS, 420, 1495
Scholz A., Jayawardhana R., Wood K., Meeus G., Stelzer B., Walker C., O’Sullivan M., 2007, ApJ, 660, 1517
Scholz A., Geers V., Jayawardhana R., Fissel L., Lee E., Lafreniere D., Tamura M., 2009a, ApJ, 702, 805
Scholz A., Xu X., Jayawardhana R., Wood K., Eisl¨offel J., Quinn C., 2009b, MNRAS, 398, 873
Scholz A. et al., 2010, MNRAS, 409, 1557
Scholz A., Froebrich D., Wood K., 2013, MNRAS, 430, 2910 Skrutskie M. F. et al., 2006, AJ, 131, 1163
Vrba F. J., Rydgren A. E., Chugainov P. F., Shakovskaia N. I., Weaver W. B., 1989, AJ, 97, 483
Welty A. D., Ramsey L. W., 1995, AJ, 110, 336 Wolk S. J., Rice T. S., Aspin C., 2013, ApJ, 773, 145
S U P P O RT I N G I N F O R M AT I O N
Additional Supporting Information may be found in the online ver-sion of this article:
Appendix A:Photometry Tables
(http://mnras.oxfordjournals.org/lookup/suppl/doi:10.1093/mnras/ stv838/-/DC1).
Please note: Oxford University Press are not responsible for the content or functionality of any supporting materials supplied by the authors. Any queries (other than missing material) should be directed to the corresponding author for the paper.
This paper has been typeset from a TEX/LATEX file prepared by the author.
at University of St Andrews on August 13, 2015
http://mnras.oxfordjournals.org/