Research Article
Xiaolin Meng*, Jian Wang, and Houzeng Han
Optimal GPS/accelerometer integration algorithm
for monitoring the vertical structural dynamics
Abstract:The vertical structural dynamics is a crucial fac-tor for structural health monifac-toring (SHM) of civil struc-tures such as high-rise buildings, suspension bridges and towers. This paper presents an optimal GPS/accelerome-ter integration algorithm for an automated multi-sensor monitoring system. The closed loop feedback algorithm for integrating the vertical GPS and accelerometer measure-ments is proposed based on a 5 state extended KALMAN filter (EKF) and then the narrow moving window Fast Fourier Transform (FFT) analysis is applied to extract structural dynamics. A civil structural vibration is simu-lated and the analysed result shows the proposed algo-rithm can effectively integrate the online vertical measure-ments produced by GPS and accelerometer. Furthermore, the accelerometer bias and scale factor can also be esti-mated which is impossible with traditional integration al-gorithms. Further analysis shows the vibration frequen-cies detected in GPS or accelerometer are all included in the integrated vertical deflection time series and the ac-celerometer can effectively compensate the short-term GPS outages with high quality. Finally, the data set collected with a time synchronised and integrated GPS/accelerome-ter monitoring system installed on the Nottingham Wilford Bridge when excited by 15 people jumping together at its mid-span are utilised to verify the effectiveness of this pro-posed algorithm. Its implementations are satisfactory and the detected vibration frequencies are 1.720 Hz, 1.870 Hz, 2.104 Hz, 2.905 Hz and also 10.050 Hz, which is not found in GPS or accelerometer only measurements.
*Corresponding Author: Xiaolin Meng:Nottingham Geospatial In-stitute, The University of Nottingham, Nottingham NG7 2TU, UK, E-mail: [email protected]; and Sino-UK Geospatial Engineering Centre, The University of Nottingham, Nottingham NG7 2RD, UK
Jian Wang, Houzeng Han:School of Environmental Science and Spatial Informatics, China University of Mining and Technology, Xuzhou 221116, China; and Sino-UK Geospatial Engineering Centre, The University of Nottingham, Nottingham NG7 2RD, UK
Keywords: Global Ppositioning System (GPS), accelerom-eter, integration, vibration, extended Kalman filter, dy-namic deflection monitoring
DOI 10.1515/jag-2014-0024
Received October 22, 2014; accepted October 28, 2014
1 Introduction
com-plement each other in monitoring the static, quasi-static and dynamic deflections of the structures [1]. In order to further explore the benefits of different systems, a more effective and reliable data fusion technique should be de-veloped. Chan [2] presented a GPS/accelerometer data in-tegration processing technique based on empirical mode decomposition (EMD) and an adaptive filter. The simula-tion tests demonstrated that the measurement accuracy of the deflection is significantly improved. For combining GPS/accelerometer data sampled at different data rates, a multi-rate Kalman filtering approach was proposed to im-prove the positioning accuracy [19]. A comparative analy-sis showed that frequency-based deflection extraction ap-proach is most appropriate for extracting precise structure displacement [9]. However, there are many unknowns in bridge monitoring that need to be further investigated as pointed out by Meng [12].
The basic methods used for GPS/ accelerometer inte-gration can be summarised as follows: (1) the collected measurements without strict time synchronisation are analysed separately to extract vibration parameters and validate each other; (2) the time synchronised measure-ments are fused by post-processing for extracting struc-tural dynamics; (3) the fully automated on-line integra-tion system and data processing algorithm are developed for structural dynamics and structural health monitoring. Due to the algorithm and implementation complexity, an ideal online GPS/accelerometer integration algorithm is still not available and a feasibility study work that was sponsored by the European Space Agency to the first au-thor’s team had been started in 2013 to address these is-sues [6].
As a part of this ESA work and sponsored by other sources, this paper focuses on developing an extended Kalman filter based integration algorithm for fusing the vertical deflection measurements of a suspension bridge with RTK GPS positioning and a triaxial accelerometer. The algorithm can calibrate the acceleration and velocity cor-rections online by a closed loop feedback without sensor calibration in advance. The Fast Fourier Transform (FFT) is also adopted for precisely extracting the vibration dynam-ics. The simulated test and field experiment on the Wilford suspension bridge demonstrate that the fusion algorithm is satisfactory.
2 Accelerometer error model
The error sources of a Micro Electromechanical System (MEMS) grade accelerometer include sensor noise, bias
drift and scale factor errors. The acceleration measure-ments can be modelled with Eq. 1 [20]:
˜
a= (1 +f)a+b+va (1)
where ˜ais a raw acceleration, ais the true acceleration
provided by the sensor.vais the sensor noise assumed to
be zero mean Gauss white noise (va ∼ N(0,σ2a)) that is
caused by the electronic interference. For an MEMS sen-sor, it is well known that acceleration suffers from high
frequency noise.f is the sensor’s scale factor usually
de-scribed with a first order Gauss-Markov model [4]:
f = −1
τf +
wf (2)
whereτf is correlation time,wf is Gaussian white noise.
The quantitybin Eq. (1) is the sensor bias which can also
be modelled as a Gauss-Markov process:
b= −1
τb
b+wb (3)
whereτbis correlation time,wbis Gaussian white noise.
3 Extended Kalman filter (EKF)
Considering a nonlinear discrete system, the statexkcan
be described as Eq. (4) [18]:
xk=fk−1(xk−1) +wk−1 (4)
and the noisy nonlinear combination of the system states
can be measured byykand expressed as:
y=hk(xk) +vk (5)
wherefk−1(•) is the state transition function from epoch
k− 1thtokth,w
kis the process noise at epochk− 1thwith
a covariance matrixQk−1, andhk(•) is the transition
func-tion between the state vectorxkand the observation vector
yk. Eq. (5) is the measurement model with the
measure-ment noisevkwhose covariance matrix isRk.wkandvk
are both white noise and uncorrelated. The solution of EKF is a recursive procedure which contains prediction step that is given by
(
ˆ
x−k=fk−1 ˆx+k−1
P−k=Φl,k−1P+k−1Φ
T
k,k−1+Qk−1 (6)
The update step is provided as
Kk=P−kHTk(HkP−kHTk+Rk)−1
ˆ
x+k= ˆx−k+Kk(yk−hk(ˆx−k))
P+k= (I−KkHk)P−k
(7)
whereKk is the Kalman gain matrix, ˆx+kis the posteriori
state vector at epochk, andP+kis the posteriori covariance matrix of ˆx+k.
The transition matrices of linear and observation ma-trixes is:
Φk,k−1∼
∂fk−1
∂x
x
=ˆx+
k−1
(8)
Hk∼
∂hk ∂x x
=ˆx−
k
(9)
4 GPS/accelerometer integration
algorithm
4.1 Description of the integration system
For a single axial accelerometer, the measured deflection
p(t) and deflection velocityv(t) varying with time can be
described as a differential equation [5]:
˙
p(t) =v(t) (10)
˙
v(t) =a(t) (11)
wherea(t) is the measured acceleration. The deflection
p(t) can be acquired with real-time kinematic (RTK) GPS
positioning or other sensors. The accelerometer measure-ments should be transformed to the vertical direction for integration with vertical GPS measurements.
The fusion model of GPS/accelerometer integration for the vertical dynamics of a civil structure can be consid-ered as a single channel equation similar to the GPS/INS integration. The error states areδp= ˜p−p,δv= ˜v−v,∇b
and∇f. Considering the center discrepancy between the
GPS antenna and the accelerometer, one more error state
δLis included and the dynamic equation for the
integra-tion system can be expressed as Eq. 12:
˙ x= 0 1
0 1 1
−τ1
b
−τ1
f 0
| {z }
F x+ 0 va wb wf wL
| {z } w
(12)
Fig. 1.Schematic for a Closed Loop Feedback EKF Filter.
andxis the error state vector given by:
x=h δp δv ∇b ∇f δL
iT
(13)
whereδLis modelled as a random walk process andwL
as Gauss white noise. At time epocht, the corresponding
error observation equation can be described as Eq. 14:
y(t) =rGPS(t) −rAcc(t)
=h 1 0 0 0 1 ix+vp(t)
(14)
where rGPS(t) is the observed vertical GPS deflection,
rAcc(t) is the double integral deflection of the acceleration
and is the Gaussian white noise of the measurements.
4.2 Closed loop feedback algorithm
The closed loop feedback algorithm is usually applied to GPS/INS integration system [7]. In this paper, the GPS/ac-celerometer integration algorithm is realised with a closed loop feedback algorithm based on an extended Kalman fil-ter (Figure 1). The acceleromefil-ter sensor errors are mod-elled by biases and scale factor errors, which are estimated by the online Kalman filter and fed back to calibrate the raw accelerometer measurements according to Eq. (15) to limit the error growth.
a= ˜a−b
1 +f (15)
5 Simulation trial
The authors simulated a vertical deflection of a bridge with frequency of 0.8 Hz, 2 Hz and 5 Hz and the corresponding amplitudes are 0.005 m, 0.01 m and 0.008 m, respectively. Then the simulated deflection signal is formed as:
x(t) =A1· sin(2πf1)
+A2· sin
2πf2+π
4
+A3· sin
2πf3+π
3
Table 1.Detailed process parameters used for the simulated ac-celerometer [CROSSBOW, 2002].
Simulated parameters Values Units
Range ±10 g
Bias 12 mg
Scale factor error 4000 ppm Velocity random Walk 0.5 m/s/hr1/2 Correlation time,τb 200 s
Correlation time,τf 1000 s
whereA1is 0.01 m andf1is 2 Hz,A2is 0.008 m andf2is
5 Hz,A3is 0.005 m andf3is 0.8 Hz. That is, the simulated
acceleration is
a(t) = −A1(2πf1)2sin(2πf1) −A2(2πf2)2sin2πf2+π
4
−A3(2πf3)3sin
2πf3+π
3
An integrated GPS/accelerometer bridge vertical monitor-ing system is simulated with above settmonitor-ings. The GPS ver-tical measurements are simulated with the deflection sig-nal added with white measurement noise (vpN˜(0, 0.012))
and the sampling rate is 5 Hz, a total of 60 s data is simulated. The acceleration is assumed to be collected with an accelerometer sampled at the rate of 100 Hz, the high sampling rate can offer some benefits for extracting high-frequency vibration in bridge monitoring. The sim-ulated accelerometer specifications in the measurements are the same as Crossbow IMU400CC [3] given by Table 1. These parameters are used to form the stochastic model described in Section 2.
It is apparent that only the vibrations of 0.8Hz and 2Hz (the Nyquist frequency of 5 Hz GPS data) could be ex-tracted from the GPS measurements with the peak-picking approach (Figure 2). The vibration signatures between 2 Hz and 5 Hz can be easily extracted with FFT from the acceler-ation measurements whilst the 0.8 Hz vibracceler-ation is hardly to be identified for its low power (Figure 3).
To assess the effectiveness of the proposed method, the deflection results derived from the integration algo-rithm and corresponding frequency domain analysis are shown in Figure 4, and the estimation errors compared to the true signal are plotted in Figure 5. The estimated amplitude of the deflection is consistent with the simu-lated signal and the RMS error of the estimated deflec-tion is 4.1 mm. This is to say that the integradeflec-tion algo-rithm can provide better performance than GPS-only or accelerometer-only deflection monitoring strategy. Excel-lent velocity estimates can also be obtained even without
0 10 20 30 40 50 60
−0.04 −0.02 0 0.02 0.04 0.06
Measured deflections (m)
Time(sec)
0.010 0.1 1 2.5
0.5 1 1.5 2
Power
[image:4.595.63.276.96.193.2]Frequency(Hz)
Fig. 2.The Simulated GPS Measurements and FFT Analysis.
0 10 20 30 40 50 60
−15 −10 −5 0 5 10 15
Acceleration (m/s
2)
Time(sec)
0.010 0.1 1 10 50
0.5 1 1.5 2 2.5x 10
4
Power
Frequency(Hz)
Fig. 3.The Simulated Accelerations and FFT Analysis.
0 10 20 30 40 50 60
−0.04 −0.02 0 0.02 0.04 0.06
Time(sec)
Deflection(m)
10−2 10−1 100 101 102
0 10 20 30 40
Power
Frequency(Hz)
simulated signal measured deflection integration result
[image:4.595.312.541.292.447.2] [image:4.595.314.538.511.676.2]0 10 20 30 40 50 60 −0.02
−0.01 0 0.01 0.02
Deflection error(m)
Time(sec)
0 10 20 30 40 50 60
−0.02 −0.01 0 0.01 0.02
Velocity error(m)
[image:5.595.52.283.66.232.2]Time(sec)
Fig. 5.The Estimated Deflection and Velocity Errors.
0 10 20 30 40 50 60
−0.005 0 0.005 0.01 0.015
Time (sec)
Bias (m/s
2)
0 10 20 30 40 50 60
−0.01 0 0.01 0.02
Time (sec)
Scale Factor
Estimated Simulated
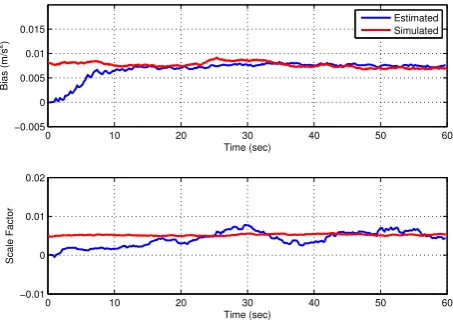
Fig. 6.The Estimated Accelerometer Sensor Errors (Bias and Scale Factor).
GPS velocity observations, which is also important for real-time monitoring and warning.
The integration approach has the benefit to iden-tify all vibration frequency compared to GPS-only or accelerometer-only data. It is shown in Figure 4 that three simulated vibration frequencies can be accurately extracted from the estimated deflection series. The esti-mated accelerometer errors are shown in Figure 6, from this graph it is evident that the estimated sensor errors, including bias and scale factor errors, are compatible with the simulated errors and the estimated error states are fed back to correct the raw measurements.
The integrated system can also improve the system in-tegrity for real-time monitoring. During the GPS blockages only the accelerometer measurements can be used for the vertical deflection of the bridge and the accumulated sys-tematic errors will be corrected once the GPS is available again. A 3s (30s-33s) GPS blockage that is equivalent to 15
30 30.5 31 31.5 32 32.5 33 33.5 34 34.5 35
−0.01 −0.005 0 0.005 0.01
Deflection error(m)
Time(sec)
30 30.5 31 31.5 32 32.5 33 33.5 34 34.5 35
−0.01 −0.005 0 0.005 0.01
Velocity error(m)
Time(sec)
[image:5.595.296.529.68.230.2]Acc−only GPS/Acc
Fig. 7.The Performance of GPS/accelerometer Integration during GPS blockage.
epochs is simulated and the estimation errors during the period are given in Figure 7. It shows that the accelerom-eter can provide satisfactory result in a short GPS outage, and the performance recovers at 33th second immediately when GPS is available.
6 The Wilford suspension bridge
trial
The Wilford suspension bridge is 69m long and 3.7m wide with a steel deck covered by a floor of wooden slats [10]. The bridge is possibly 100 years old and was extensively utilised as a test bed by staff of the University of Notting-ham during their past research (Figure 9). The data set utilised in this paper was collected with GPS and a triax-ial accelerometer from a trtriax-ial carried out on 15th of May in 2003. In this paper, the vertical deflection measurements are used for testing the integration algorithm and extract-ing the vertical vibrations. The GPS samplextract-ing rate was set to 10 Hz, and the accelerometer recorded the data at the frequency of 80Hz. For more details about the trial see [11].
6.1 Multipath isolation based on a
Chebyshev filter
[image:5.595.55.282.273.433.2]Fig. 8.Wilford bridge over the River Trent in Nottingham, UK.
387800 388000 388200 388400 388600 388800 389000 389200 389400 389600 30.02
30.04 30.06 30.08 30.1
GPS Time(sec,week 1218)
Height(m)
10−4 10−3 10−2 10−1 100 101
0 20 40 60 80
Power
[image:6.595.320.540.75.233.2]Frequency(Hz)
Fig. 9.GPS Vertical Deflections and Vibration.
389704.0 in the GPS week 1218, with a total of 20000 ob-servations.
During the experiment, several forced excitation tests had been carried out. The resolved vertical deflection time
series and its spectra are shown in Figure??. The whole
data set shows a clear low frequency character, which is the effect of multipath. It is hardly to identify structural dy-namics from the original time series without removing this multipath signature. It was found that the dominant sig-nals of low frequency nature between 0.001 Hz to 0.2 Hz are multipath and flicker noise effects [15]. Their effects could be removed with a Chebyshev type 3-order digital filter designed to extract long-period component and then the dynamic deflections were extracted from the frequen-cies from 0.2 Hz above (Figure 10).
387800 388000 388200 388400 388600 388800 389000 389200 389400 389600 −0.02
−0.01 0 0.01 0.02
GPS Time (sec)
Multipath (m)
387800 388000 388200 388400 388600 388800 389000 389200 389400 389600 −0.03
−0.02 −0.01 0 0.01 0.02
GPS Time (sec)
Dynamic Deflection (m) Event 15
Fig. 10.Extracted Long-period Component and Dynamic Deflections.
6.2 Integrated algorithm for detecting the
vertical dynamics
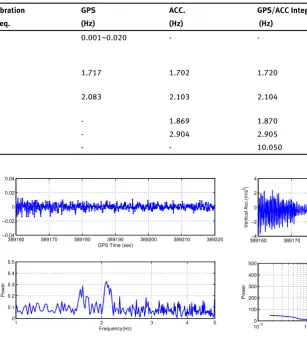
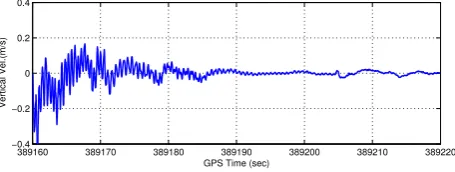
In this paper, the excitation test event 15 as shown in Fig-ure 10 when 15 people jumped together at the mid-span of the Wilford Bridge was used for analysis. Considering the relatively low precision of GPS measurements in the ver-tical direction and the main excitations occur in the verti-cal direction, the vertiverti-cal component of the data set was selected to test the proposed integration algorithm. The vertical deflections measured with GPS and the extracted frequencies are shown in Figure 11. The extracted verti-cal structural vibrations have two dominant frequencies of 1.717 Hz and 2.083 Hz. The un-calibrated accelerome-ter measurements and their corresponding frequencies are shown in Figure 12. It is obvious that raw acceleration con-tains a clear bias component, which will have an adverse impact on the state estimate without correction. From the spectra of accelerometer records, the detected frequencies are 1.702 Hz, 1.869 Hz, 2.103 Hz, and 2.904 Hz respectively. The proposed integration algorithm is adopted for this real-life monitoring data fusion and the integrated verti-cal deflection time series is shown in Figure 13. Figure 14 shows the estimated velocity and it is evident that the starting epoch is affected by the bias and scale factor of the accelerometer. The estimated sensor calibration pa-rameters are shown in Figure 15. By fitting the line, it is
obtained that the accelerometer bias is 0.37 m/s2and the
[image:6.595.65.293.262.428.2]in-Table 2.Vibration Frequencies Detected by GPS and Accelerometer Measurements.
Vibration GPS ACC. GPS/ACC Integration comments
Freq. (Hz) (Hz) (Hz)
1 0.001~0.020 - - Multipath effects
earsed by a bandpass filter
2 1.717 1.702 1.720 Detected by both GPS
and ACC
3 2.083 2.103 2.104 Detected by both GPS
and ACC
4 - 1.869 1.870 Detected by ACC. only
5 - 2.904 2.905 Detected by ACC only
6 - - 10.050 Detected by GPS/ACC.
389160 389170 389180 389190 389200 389210 389220
−0.04 −0.02 0 0.02 0.04
GPS Time (sec)
Deflection(m)
1 2 3 4 5
0 0.1 0.2 0.3 0.4 0.5
Power
Frequency(Hz)
Fig. 11.Vertical Deflections Measured with GPS and the Vibration Frequencies.
tegration process is listed in Table 2. The spectra of the integrated deflection time series match well with that of GPS measurements and acceleration time series except the vibration of 10.050 Hz that is not detected in GPS-only or accelerometer-only monitoring, which may be another high frequency structural dynamics. The integration ap-proach can extract more vibration frequencies than sep-arately extracted from GPS-only and accelerometer-only measurements.
7 Conclusions
This paper introduces an online integration algorithm to integrate GPS and MEMS grade accelerometer measure-ments and thereafter the peak-picking approach is used to extract vibration frequencies. It has verified that the inte-grated vertical deflection time series contains not only all the vibration frequencies detected by GPS or
accelerome-389160−4 389170 389180 389190 389200 389210 389220
−2 0 2 4
GPS Time (sec)
Vertical Acc.(m/s
2)
10−2 10−1 100 101 102
0 100 200 300 400 500
Power
Frequency(Hz)
Fig. 12.Raw Accelerations and Identified Frequencies.
389160 389170 389180 389190 389200 389210 389220
−0.04 −0.02 0 0.02
GPS Time (sec)
Deflection(m)
Integration result GPS measurements
389160 389170 389180 389190 389200 389210 389220
−0.1 0 0.1
GPS Time (sec)
Deflection Diff.(m)
10−2 10−1 100 101 102
0 1 2 3
Power
[image:7.595.58.366.83.421.2]Frequency(Hz)
[image:7.595.300.529.499.664.2]389160 389170 389180 389190 389200 389210 389220 −0.4
−0.2 0 0.2 0.4
GPS Time (sec)
[image:8.595.65.293.68.154.2]Vertical Vel.(m/s)
Fig. 14.Estimated Velocity Time Series.
389160 389170 389180 389190 389200 389210 389220
−0.5 −0.4 −0.3 −0.2 −0.1 0
Bias (m/s
2)
3891600 389170 389180 389190 389200 389210 389220
0.5 1 1.5x 10
−3
GPS Time (sec)
[image:8.595.64.295.190.332.2]Scale Factor
Fig. 15.Estimated Calibration Parameters: Bias and Scale Factor.
ter only measurements but also extra frequencies that can-not be obtained easily with observations from a sole sensor system. The algorithm suits for online application which can be applied to establish structural health monitoring system. Further research should focus on more reliable in-tegration algorithm (e.g. robust inin-tegration algorithm) and more precise acceleration integral algorithm.
Acknowledgement: This study is supported by the Pro-gram for New Century Excellent Talents in University with a grant number as NCET-13-1019 and partially sponsored by the Fundamental Research Funds for the Central Uni-versities with a grant number as 2013RC16.
References
[1] Brownjohn J. M. W., Ambient vibration studies for system iden-tification of tall buildings,Earthquake Engineering &
Struc-tural Dynamics32(1) (2003), 71-95. ISSN 0098-8847. DOI
10.1002/eqe.215.
[2] Chan W. S., Xu Y. L., Ding X. L. et al., An integrated
GPS–accelerometer data processing technique for structural deformation monitoring,Journal of Geodesy80(12) (2006),
705-719.
[3] Crossbow. DMU user’s manual, Crossbow technology Inc., San
Jose, CA, 2002.
[4] El-Diasty M. and Pagiatakis S., Calibration and stochastic mod-elling of inertial navigation sensor errors,Journal of Global
Positioning Systems7(2) (2008), 170-182.
[5] Farrell J. A.,Aided Navigation: GPS with High Rate Sensors, New
York: McGraw-Hill Professional, 2008.
[6] GeoSHM, (Accessed 15 February 2014, at http://artes-apps.esa. int/projects/geoshm).
[7] Godha S. and Cannon M. E., GPS/MEMS INS integrated system for navigation in urban areas,GPS Solutions11(3) (2007),
193-203.
[8] Hide C., Blake S., Meng X, et al., An Investigation in the use of GPS and INS Sensors for Structural Health Monitoring, in
Proceedings of the 18th International Technical Meeting of the Satellite Division of The Institute of Navigation (ION GNSS 2005)
2001, 2029-2038.
[9] Hwang J., Yun H., Park S. K. et al., Optimal methods of RTK-GPS/accelerometer integration to monitor the displacement of structures,Sensors12(1) (2012), 1014-1034.
[10] Meng X.,Real-time deformation monitoring of bridges using
GPS/Accelerometers, Ph.D. dissertation, Nottingham, The
Uni-versity of Nottingham, 2002.
[11] Meng X., Dodson, A. H. and Roberts G. W., Detecting bridge dynamics with GPS and triaxial accelerometers,Engineering
Structures29(11) (2007), 3178-3184.
[12] Meng X., GeoSHM: GNSS and EO for Structural Health Moni-toring, in:Proceedings of 2nd Joint International Symposium of
Deformation Monitoring, Nottingham, UK, 2013.
[13] Meo M., Zumpano G., Meng X. et al., Measurements of dynamic properties of a medium span suspension bridge by using the wavelet transforms,Mechanical systems and signal processing
20(5) (2006), 1112-1133.
[14] Moschas F. and Stiros S., Measurement of the dynamic dis-placements and of the modal frequencies of a short-span pedestrian bridge using GPS and an accelerometer,Engineering
Structures33(1) (2008), 10-17.
[15] Ogaja C. and Satirapod C., Analysis of high-frequency mul-tipath in 1-Hz GPS kinematic solutions,GPS Solutions11(4)
(2007), 269-280.
[16] Psimoulis P., Pytharouli S., Karambalis D. et al., Potential of Global Positioning System (GPS) to measure frequencies of oscillations of engineering structures,Journal of Sound and
Vibration318(3) (2008), 606-623.
[17] Roberts G. W., Meng X. and Dodson A. H., Integrating a global positioning system and accelerometers to monitor the deflec-tion of bridges,Journal of Surveying Engineering130(2) (2004),
65-72.
[18] Simon D., Optimal State Estimation: Kalman H.,Infinity and
Nonlinear Approaches, Hoboken: Jonh Wiley & Sons,2006.
[19] Smyth A. and Wu M., Multi-rate Kalman filtering for the data fu-sion of displacement and acceleration response measurements in dynamic system monitoring,Mechanical Systems and Signal
Processing21(2) (2007), 706-723.
[20] Titterton D. H. and Weston J. L.,Strapdown Inertial Navigation
Technology, 2nd edition. London: The Institution of Engineering
![Table 1. Detailed process parameters used for the simulated ac-celerometer [CROSSB OW, 2002].](https://thumb-us.123doks.com/thumbv2/123dok_us/8693864.380346/4.595.314.538.511.676/table-detailed-process-parameters-used-simulated-celerometer-crossb.webp)