Research Article
Proteomic analysis of conditioned media
from glucose responsive and glucose
non-responsive phenotypes reveals a panel of
secreted proteins associated with beta cell
dysfunction
Media conditioned by dysfunctioning pancreatic beta cells offer an excellent source of potential protein markers associated with this phenotype. Proteins identified from cell culture model systems are often found to be of importance clinically. Previous work by us and others have shown that low-passage MIN-6 cells (MIN-6(L)) respond to changes in glucose concentrations, producing an approximately 5.5-fold glucose-stimulated insulin secretion (GSIS) in response to 26.7 mmol/L, compared with 3.3 mmol/L, glucose. After continuous culture or high-passage (MIN-(H)), this GSIS was no longer present and thus represents an excellent model system for investigating beta cell dysfunction. Employing 2-D difference gel electrophoresis and mass spectrometry a panel of protein markers were identified in conditioned media (CM) from MIN-6(L) and MIN-6(H) beta cells. These proteins, including secretogranin II, secretogranin III and transthyretin, are associated with secretory granule biogenesis and were found to have substantially increased levels in the CM from the non-responsive high-passage MIN-6 beta cells. A panel of protein markers found to have increased abundance levels in CM from MIN-6(H) compared with MIN-6(L) beta cells may have the potential to be used clinically for assessing beta cell function and to monitor the effects of specific therapeutics.
Keywords:
Beta cell / Biomarkers / Diabetes / Difference gel electrophoresis / MIN-6 DOI 10.1002/elps.200800152
1
Introduction
Worldwide there are an estimated 150 million people suffering from diabetes mellitus [1]. Each of these indivi-duals is at a greater risk of developing a number of complications, each of which is associated with a reduction in quality of life and an increase in individual morbidity and mortality. Two major concerns are that much of this increase in diabetes will occur in developing countries, due to population growth, ageing, unhealthy diets, obesity and sedentary lifestyles, and that there is a growing incidence of type II diabetes – which accounts for about 90% of all cases – at a younger age [2].
Type I diabetes is characterized by autoimmune destruction of the insulin-producing beta cells in the islet of Langerhans of the pancreas, whereas type II diabetes is associated with reduced beta cell mass and function, as well as insulin resistance [2]. To date, no reported panel of circulating biomarkers indicative of beta cell function exists. A panel of diabetes-specific biomarkers would be of great benefit clinically and may aid in early detection and thera-peutic monitoring of this disease.
MIN-6, a murine pancreatic beta cell line, that was established from an insulinoma obtained by targeted expression of the simian virus 40T antigen gene in trans-genic mice has been widely used to investigate insulin secretion [3, 4]. As a typical beta cell line, MIN-6 cells express insulin and islet amyloid polypeptide. Previous work by us and others have shown that low-passage MIN-6 cells respond to changes in glucose concentrations, produ-cing an approximately 5.5-fold glucose-stimulated insulin secretion (GSIS) in response to 26.7 mmol/L, compared with 3.3 mmol/L, glucose. After continuous culture, this GSIS was no longer present and thus represents an excellent model system for investigating beta cell dysfunction [5, 6].
Paul Dowling1 William Shields1 Sweta Rani1 Paula Meleady1 Michael Henry1
Per Jeppesen2
Lorraine O’Driscoll1
Martin Clynes1
1National Institute for Cellular Biotechnology, Dublin City University, Dublin, Ireland 2
Department of Endocrinology and Metabolism C, Aarhus University Hospital, Aarhus Denmark
Received March 4, 2008 Revised May 7, 2008 Accepted May 11, 2008
Abbreviations: CM, conditioned media; GSIS, glucose-stimulated insulin secretion; SG, secretory granule; TTR, transthyretin
Correspondence:Dr. Paul Dowling, National Institute for Cellular Biotechnology, Dublin City University, Glasnevin, Dublin 9, Ireland
Beta cells are specialized for the secretion of insulin, but they also secrete other hormones/factors and it is likely that many of these proteins or their fragments may eventually enter the circulation where they can be detected [7, 8]. A number of studies have used a cell culture model system where the cells were grown in serum-free media to perform proteomic analysis [9]. The majority of work on biomarker discovery using proteins identified from conditioned media (CM) has focused on cancer research. Many of these identified proteins have proven to be very important as circulating serum biomarkers [10]. To date, very little information exists on CM involving pancreatic beta cells and thus remains an untapped resource. We report here the discovery of proteins associated with beta cell failure in CM from glucose-responsive (low passage: L) and glucose-non-glucose-responsive (high passage: H) cells using 2-D DIGE and mass spectrometry.
2
Materials and methods
2.1 MIN-6 culture
MIN-6 cells (generously donated by Dr. Yamamoto, Kumamoto University school of Medicine, Japan) were grown in DMEM containing 20% heat-inactivated fetal calf serum (FCS) and were cultured at 371C with 5% CO2. Routine sterility checks, including screening for Mycoplas-ma, indicated that the cells were clear of contamination. MIN-6 (high passage/H) at passage 47 cells was established by sub-culturing MIN-6 (low passage/L) cells from passage 37, as described previously [6].
2.2 Phase contrast light microscopy
MIN-6(L) and MIN-6(H) cells were cultured at 371C, 5% CO2for 5 days prior to analysis using phase contrast light microscopy. This contrast-enhancing optical technique used to produce high-contrast images of transparent specimens was performed at 20magnification by imagining the living, unfixed, cells using a Nikon Optiphot microscope with phase contrast rings.
2.3 Preparation of serum-free CM
Cells were grown to 60–70% confluency in DMEM contain-ing 20% heat-inactivated FCS and then washed three times in serum-free medium. Cells were subsequently incubated in serum-free medium for 1 h, washed two more times in serum-free medium in order to remove any contaminating bovine proteins from the FCS, and incubated in serum-free media for 72 h. CM was collected, centrifuged at 1000 rpm for 15 min to remove cellular debris, decanted into clean tubes, and stored at 801C.
2.4 GSIS analysis of MIN-6 cells
MIN-6 cells were seeded at 2105cells/well in a 24-well plate and were allowed to grow for 72 h prior to the GSIS assay. Following this, 1KRB was prepared from an aliquot of frozen 10tock (36.525 g NaCl, 2.2 g KCl, 0.941 g CaCl22H2O, 1.22 g MgCl26H2O, 29.8 g HEPES dissolved in 500 mL of H2O), BSA was added to a final concentration of 0.1%, and the KRB-BSA was pH-adjusted to 7.36 at 191C with 1 mol/L of NaOH. This solution was incubated for 30 min at 371C and 5% CO2. Glucose concentrations of 0, 3.3, 10, 16.7, and 26.7 mmol/L were prepared in the conditioned 1KRB and were subsequently placed at 371C and 5% CO2 for 30 min. MIN-6 cells to be analyzed were rinsed (twice) in 1KRB and were equilibrated at 3.3 mmol/L glucose for 30 min at 371C. After equilibration, the glucose-containing stimulation media were added (1 mL/well), incubated at 371C and 5% CO2 for 60 min. The GSIS assay was then terminated by placing the plate on ice. CM (500mL) was removed from each well, placed in an ice-cold Eppendorf tube, centrifuged at 2500 rpm for 5 min and 200mL of the supernatant was removed for analysis by (pro)insulin ELISA (Mercodia, 10-1124-10;), following the manufacturer’s instructions.
2.5 Sample preparation and protein labeling
CM from MIN-6(L) and (H) was concentrated using 3000 MW cut-off centricons (Millipore). The resulting concentrate was processed using a 2-D Clean-Up kit (Bio-Rad) to precipitate the proteins and remove any contaminating elements. The precipitated protein pellet was resuspended in lysis buffer containing (4% w/v CHAPS, 7 M urea, 2 M thiourea, 10 mM Tris-HCl, 5 mM magnesium acetate of pH 8.5) and then placed in a sonicating water bath for 15 min. Insoluble material was removed by centrifugation at 14 000 rpm for 10 min at room temperature. Protein concentration was deter-mined using the Quick Start Bradford Protein Assay Kit (Bio-Rad).
2.6 Protein separation by 2-D gel electrophoresis and gel imaging
Immobilized 24 cm non-linear pH gradient (IPG) strips (GE Healthcare), pH 3–11, were rehydrated in rehydration buffer (7 M urea, 2 M thiourea, 4% CHAPS, 0.5% IPG buffer, 50 mM DTT) overnight, according to the manufacturers’ guidelines (GE Healthcare). Isoelectric focusing was performed using an IPGphor apparatus (GE Healthcare) for a total of 40 kVh at 201C with resistance set at 50 mA. Strips were equilibrated for 20 min in 50 mM Tris-HCl, pH 8.8, 6 M urea, 30% v/v glycerol, 1% w/v SDS containing 65 mM DTT and then for 20 min in the same buffer containing 240 mM iodoacetamide. Equilibrated IPG strips were transferred onto 1820-cm 12.5% uniform polyacry-lamide gels poured between low fluorescence glass plates. Strips were overlaid with 0.5% w/v low melting point agarose in running buffer containing bromphenol blue. Gels were run using the Ettan Dalt 12 apparatus (GE Healthcare) at 2.5 W/gel for 30 min and then 100 W total at 101C until the dye front had run off the bottom of the gels. All the images were collected on a Typhoon 9400 Variable Mode Imager (GE Healthcare). Statistics and quantitation of protein expression were carried out in DeCyder software (GE Healthcare).
2.7 Spot digestion and MALDI-TOF analysis
Excision of protein spots, trypsin digestion, and protein identification by mass spectrometric analysis using an Ettan MALDI-TOF Pro instrument from Amersham Biosciences was performed according to an established methodology [5]. Preparative gels containing 300mg of protein were fixed in 7.5% v/v acetic acid, 10% v/v methanol overnight. Gels were washed with 410 min changes of DI water before total protein was detected by post-staining with Deep Purple (GE Healthcare) for 2 h at room temperature. To develop the stain, 310 min washed in 0.1% ammonia was performed and subsequently the gels were washed in signal stabiliza-tion solustabiliza-tion (0.75% acetic acid) for a minimum of 10 min
before imaging. Gels were imaged using a Typhoon 9400 Variable Mode Imager (GE Healthcare) at the appropriate excitation and emission wavelengths for the stain. The subsequent gel image was imported into the BVA module of DeCyder software and was matched to images generated from DIGE analysis. Spots of interest were selected and confirmed using this software for subsequent picking using an Ettan Spot Picker. Gel plugs were subsequently destained and washed using the Ettan Digester. The gel plugs were rehydrated in digestion buffer (12.5 ng trypsin per mL of 10% acetronitrile, 40 mM ammonium bicarbonate) to cover the gel pieces. More digestion buffer was added if all the initial volumes had been absorbed by the gel pieces. Exhaustive digestion was carried out overnight at 371C. The supernatant was removed from each sample using the Ettan Digester and the gel plug was washed a further two times in 50% acetronitrile, 0.1% TFA and added to the initial removed supernatant. Samples were then spotted onto MALDI targets using an Ettan Spotter and mixed 1:1 with matrix solution (5 mg/mL a-cyano-4-hydroxycinnamic acid in 50% acetonitrile/0.1% TFA v/v). Mass spectra were recorded using the MALDI-TOF instrument operating in the positive reflector mode at the following parameters: accelerating voltage 20 kV; pulsed extraction: on (focus mass 2500). Internal and external calibration was performed using trypsin autolysis peaks atm/z842.50, m/z2211.104 and Pep4 mix, respectively. The mass spectra were analyzed using MALDI evaluation software (GE Healthcare), and protein identification was achieved with the PMF Pro-Found search engine for peptide mass fingerprints. Protein identities were performed in triplicate from three indepen-dent preparative gels. Search parameters for PMF included a mass range of 0–300 kDa, enzyme used: trypsin, missed cleavages: 1, modifications: 1C2H3ON@C(complete);
1O@M(partial), a charge state of MH1and a tolerance (monoisotopic) of 0.10 Da.
2.8 Western blot analysis
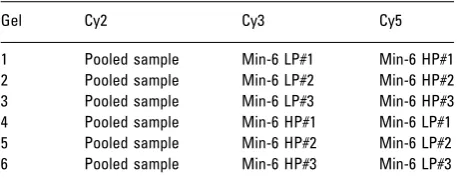
[image:3.595.62.291.107.199.2]An aliquot of 15mg of protein was loaded onto a 12% NuPAGE Bis-Tris Gels (Invitrogen) and electrophoretically separated using a MOS/SDS buffer (Invitrogen). The samples were run according to the manufacturer’s instruc-tions (Invitrogen). Electrophoretic transfer of proteins to Hybond-ECL nitrocellulose membranes (GE Healthcare) was carried out using a Bio-Rad Transblot SD cell (BioRad). Proteins were transferred for 50 min at 0.34 mA. The efficiency of transfer was evaluated using Ponceau-S-Red staining of nitrocellulose membranes, followed by destain-ing in PBS (50 mM sodium phosphate, 0.9% w/v NaCl, pH 7.4). Membranes were blocked for 1 h in 5% w/v fat-free milk powder in PBS containing 0.5% Tween-20. Membranes were then incubated overnight at 41C with the primary antibodies, secretogranin III; sc-1492 (Santa Cruz Biotechnology) and transthyretin (TTR); Ab-9015 (Abcam) at 1:1000. Nitrocellulose replicas were subsequently washed Table 1. Experimental design incorporating three independent
biological samples, technical replicates, and reverse labelinga)
Gel Cy2 Cy3 Cy5
1 Pooled sample Min-6 LP#1 Min-6 HP#1
2 Pooled sample Min-6 LP#2 Min-6 HP#2
3 Pooled sample Min-6 LP#3 Min-6 HP#3
4 Pooled sample Min-6 HP#1 Min-6 LP#1
5 Pooled sample Min-6 HP#2 Min-6 LP#2
6 Pooled sample Min-6 HP#3 Min-6 LP#3
twice for 10 min in blocking solution and then incubated with corresponding peroxidase-conjugated secondary anti-body (1:1000) for 1 h at room temperature. Nitrocellulose membranes were washed twice for 10 min in blocking solution and twice rinsed for 10 min in PBS. Visualization of immuno-decorated 1-D bands was carried out using an ECL kit (GE Healthcare). Blots with bound probes to primary targets and associated secondary antibodies labeled with horse radish peroxidase were placed in the ECL substrate immediately after stringent washes. After the 2 min incubation period, the blots were exposed to X-ray film for 30 s.
2.9 Statistical analysis
Student’s t-test was used to analyze differences in protein levels from the CM of MIN-6(L) and MIN-6(H). A t-test score ofo0.01 was considered statistically significant.
3
Results
3.1 Morphology of MIN-6(L) and (H)
Phase contrast light microscopy indicates that MIN-6(L) cells that are glucose-responsive tend to grow closely together, forming discrete colonies (Fig. 1A), whereas MIN-6(H) cells, shown in (Fig. 1B), which have lost their glucose-responsiveness with culturing, appear to be more disperse, stretched cells.
3.2 GSIS from MIN-6 low passage and high passage cells
As shown in Fig. 2, MIN-6(L) cells secrete insulin in a glucose-regulated manner, with an approximate. 5.5-fold increase in secreted product between 3.3 and 26.7 mM glucose. In contrast to this, MIN-6(H) cells do not show a functional GSIS responsei.e.the basal secretion of insulin from these cells is not influenced by the glucose content of their environment.
3.3 Proteomics analysis of media conditioned by glucose-responsive and glucose-non-responsive MIN-6 beta cells
Fifty micrograms of protein from each sample were labeled with Cy2, Cy3, or Cy5. Samples each from MIN-6(L) and MIN-6(H) medium and high cell densities (experimental design included three independent biological samples/ technical replicates/reverse labeling) were labeled with Cy3 and Cy5, respectively (Table 1). All samples employed in the experiment were used in the Cy2 labeled internal pooled standard. Samples were combined and separated by 2-D gel electrophoresis. For DeCyder image analysis, the differential in-gel analysis mode of DeCyder was first used to merge the Cy2, Cy3, and Cy5 images for each gel and to detect spot boundaries for the calculation of normalized spot volumes/ protein abundance. At this stage, features resulting from non-protein sources, namely dust particles and scratches,
A
Low passage (P- 37) High passage (P- 47)
[image:4.595.62.405.71.203.2]B
Figure 1.Phase contrast light micro-scopy indicates that MIN-6(L) cells (MIN-6 low passage cells), which are glucose-responsive, tend to grow closely together, forming discrete colonies (A), whereas MIN-6(H) cells (MIN-6 high passage cells), shown in (B), which have lost their glucose-responsiveness with cultur-ing, appear to be more disperse, stretched cells. Scale bar 200mm.
MIN-6 (L) & (H) GSIS
0 10 20 30 40 50 60
0
Glucose concentration (mM)
(Pro)insulin secreted (pmol/ml/mg protein)
L H
3.3 10 16.7 26.7
[image:4.595.315.540.239.396.2]were filtered out. The analysis was used to rapidly calculate abundance differences between samples run on the same gel. The biological variation analysis mode of DeCyder was then used to match all pairwise image comparisons from difference in-gel analysis for a comparative cross-gel statistical analysis. Operator intervention was required at this point to set landmarks on gels for more accurate cross-gel image superimposition. Comparison of normalized Cy3 and Cy5 spot volumes with the corresponding Cy2 standard spot volumes within each gel gave a standardized abun-dance. This value was compared across all gels for each matched spot and a statistical analysis was performed.
The differentially expressed proteins passed certain criteria for inclusion in the list, including appearing in all gels and ap-value ofo0.01 (Table 2). Hemoglobin alpha chain (spot 1) was found to be 8.45-fold increased, respec-tively, in the media conditioned by the glucose non-responsive MIN-6 beta cells compared to the non-responsive phenotype (Fig. 3 and Table 2). Secretogranin II and secretogranin III were identified in the CM from the MIN-6 cells. Secretogranin II (spots 2–4) and Secretogranin III (spots 5–7) were both found to exist as clusters of isoforms on the 2D gel. All isoforms for both proteins were found to be significantly increased in the media conditioned by the glucose-non-responsive MIN-6 beta cells compared with the responsive phenotype (Fig. 3 and Table 2). The isoforms of secretogranin III was found to have a greater average ratio (12.85, 19.62, 15.63) respectively, compared with those of secretogranin II (10.31, 10.88, 11.73), respectively, in the CM.
The trend was similar in all three isoforms of TTR reported in this paper, with an approximate 30-fold increase in all isoforms, 32.93-fold increase in isoforms 1 (spot 8), 34.93-fold increase in isoforms 2 (spot 9), and a 27.11-fold increase in isoforms 3 (spot 10) in the CM from the glucose-non-responsive cells compared with the glucose-responsive cells (Fig. 3 and Table 2).
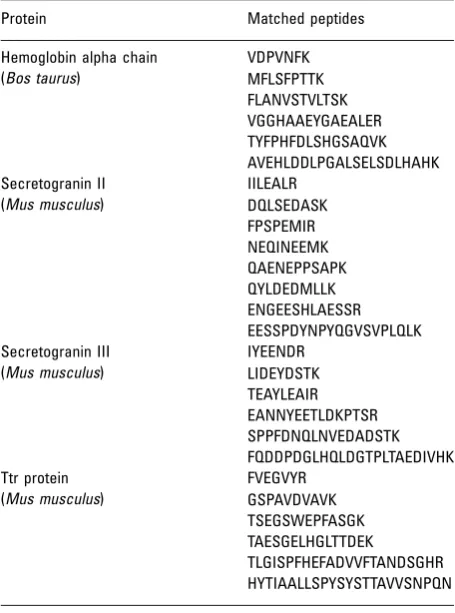
Details on protein identifications are included in Table 3. In total, hemoglobin was identified with 49% (six
[image:5.595.65.543.96.231.2]matched peptides) coverage, secretogranin II 17% (eight matched peptides), TTR 47% (six matched peptides), and secretogranin III 15% (six matched peptides). All protein identifications were confirmed from three separate preparative gels. Careful visual inspection of the MALDI-TOF-MS data showed peaks corresponding to peptides from addition proteins. The relative intensities measured from the MALDI-TOF-MS data were consistent with the claim that the protein identified is the most abundant protein within the spot. The minor protein components contributed less than 5% of the total abundance of the mixture and will have minimal effects on the quantification of the major component (Fig. 4).
Table 2. Identification, average ratio, andt-test scores for proteins found to have different abundance levels in MIN-6(H) CM compared with MIN-6(L) CMa)
Spot no. Protein ID Gene index no. t-test Av. ratio pI Mw (Da)
1 Hemoglobin alpha chain (Bos taurus) gi|6006423| 6.30E 11 8.45 8.1 15 140
2 Secretogranin II (Mus musculus) gi|29387070| 2.60E 07 10.31 4.6 66 350
3 Secretogranin II (Mus musculus) gi|29387070| 1.60E 11 10.88 4.6 66 350
4 Secretogranin II (Mus musculus) gi|29387070| 2.10E 07 11.73 4.6 66 350
5 Secretogranin III (Mus musculus) gi|74226380| 3.60E 10 12.85 4.8 53 310
6 Secretogranin III (Mus musculus) gi|74226380| 6.50E 11 19.62 4.8 53 310
7 Secretogranin III (Mus musculus) gi|74226380| 1.50E 10 15.63 4.8 53 310
8 Ttr protein (Mus musculus) gi|19354093| 6.20E 11 32.93 5.8 15 870
9 Ttr protein (Mus musculus) gi|19354093| 1.50E 11 34.93 5.8 15 870
10 Ttr protein (Mus musculus) gi|19354093| 1.40E 10 27.11 5.8 15 870
a) All proteins abundance levels were found to be substantially increased in the CM from MIN-6(H)/glucose-non-responsive cells compared with MIN-6(L)/glucose responsive cells.
1 2 3 4
5 6 7
8 9 10
MW
[image:5.595.315.540.278.471.2]pH 3-11
3.4 Western blot analysis of secretogranin III and TTR
Western blot analysis of secretogranin III and TTR confirmed the results from the 2-D DIGE experiment (Fig. 5). Results indicate a substantial increase in the abundance levels of secretogranin III and TTR in the CM from glucose-non-responsive MIN-6 beta cells compared to the responsive phenotype.
4
Discussion
In this study, a 2-D DIGE and mass spectrometry approach was utilized to analyze the CM from glucose-responsive and glucose-non-responsive MIN-6 cells, a model for studying beta cell dysfunction. Potential markers of beta cell dysfunction secreted or shed into the circulatory system are very likely to be at an extremely low concentration making detection and analysis difficult. Secreted and shed proteins accumulate in CM making their analysis by various proteomics techniques and identification through mass spectrometry more achievable. Irregular and abnormal secretion or shedding of proteins is commonly associated with disease, including diabetes [12]. Many of the proteins highlighted in this study are potentially useful to investigate as circulating serum biomarkers for beta cell dysfunction. In this study we examined the secretome from glucose-responsive MIN-6 beta cells compared with glucose-non-responsive MIN-6 beta cells in order to identify proteins indicative of beta cell dysfunction and defects in the secretory machinery.
[image:6.595.62.290.98.405.2]Granins (chromogranins or secretogranins) are a family of acidic proteins present in the secretory granules Table 3. Details on protein identifications are included in this
tablea)
Protein Matched peptides
Hemoglobin alpha chain (Bos taurus)
VDPVNFK MFLSFPTTK FLANVSTVLTSK VGGHAAEYGAEALER TYFPHFDLSHGSAQVK AVEHLDDLPGALSELSDLHAHK Secretogranin II
(Mus musculus)
IILEALR DQLSEDASK FPSPEMIR NEQINEEMK QAENEPPSAPK QYLDEDMLLK ENGEESHLAESSR EESSPDYNPYQGVSVPLQLK Secretogranin III
(Mus musculus)
IYEENDR LIDEYDSTK TEAYLEAIR EANNYEETLDKPTSR SPPFDNQLNVEDADSTK FQDDPDGLHQLDGTPLTAEDIVHK Ttr protein
(Mus musculus)
FVEGVYR GSPAVDVAVK TSEGSWEPFASGK TAESGELHGLTTDEK
TLGISPFHEFADVVFTANDSGHR HYTIAALLSPYSYSTTAVVSNPQN
a) The details include protein name, species and matched peptides associated with the protein. All protein identifi-cations were confirmed from three separate preparative gels.
[image:6.595.65.397.499.725.2](SG) of a wide variety of endocrine and neuro-endocrine cells. Secretogranin II (SgII), together with chromo-granins A (CgA) and B (CgB), makes up the major members of this group of proteins. Secretogranins III–VII are also members of the granin family but less is known about these [13, 14]. Secretogranins are the precursors of several bioactive peptides, including secretoneurin, a peptide
[image:7.595.62.541.67.546.2]observation. There is also evidence to suggest that SgIII and CgB are closely associated with the SG membrane and that this membrane association might contribute to gathering and anchoring of other soluble constituents to the SG membrane [16–18].
Our results show a substantial increase in the abun-dance levels for clusters of isoforms from both SgII and SgIII in media conditioned by glucose-responsive and glucose-non-responsive MIN-6 cells. These results indicate a large release of the SG proteins SgII and SgIII from MIN-6 beta cells that are dysfunctioning and not secreting insulin in response to glucose stimulation. SgII and SgIII are very much part of SG biogenesis and the massive release of these proteins indicates that the granules are no longer func-tioning normally.
TTR, formerly called prealbumin, was first identified in 1942 by Kabat in serum and cerebrospinal fluid and belongs to a group of proteins including thyroxine-binding globulin and albumin, which bind to and transport thyroid hormones in the blood, usually occurring at a concentration of 200–400 mg/L in serum [19]. TTR is synthesized in the liver, the choroid plexus of the brain, and the endocrine pancreas [20]. Serum levels of TTR, however, are also affected by acute and chronic diseases associated with an acute-phase response [20]. Sundsten and co-workers repor-ted that TTR was up-regularepor-ted in serum from type II diabetes individuals compared with normal glucose toler-ance individuals using protein profiling by SELDI-TOF MS [21]. Refai and co-workers recently demonstrated that the TTR tetramer has a positive role in pancreatic beta-cell stimulus-secretion coupling. TTR promoted glucose-induced increases in cytoplasmic free calcium concentration and insulin release [22]. Also reported was that the concentration of the TTR tetramer was decreased, whereas that of a monomeric form was increased in sera from patients with type I diabetes. The monomer was without effect on glucose-induced insulin release and apoptosis. Thus, TTR tetramer constitutes a component in normal beta-cell function. Conversion of TTR tetramer to monomer may be involved in the development of beta-cell failure/ destruction in type I diabetes.
These results published by Refai and co-workers are supported by results presented in this paper [22]. The levels of TTR monomer was found to be substantially increased in the CM from the high-density glucose-non-responsive cells compared with the glucose-glucose-non-responsive cells. We also describe values for three isoforms of TTR found on the 2-D gel. The trend was similar in all three isoforms reported in this paper, with an approximate 30-fold increase in all isoforms.
Hemoglobin alpha chain was also found to be signifi-cantly increased in the CM from the glucose-non-responsive MIN-6 beta cells. Hemoglobin alpha chain together with the beta chain has already been proposed as biomarkers for ovarian cancer [23]. Interestingly in this case, hemoglobin alpha chain was found to be the bovine form indicating that the glucose-non-responsive cells were absorbing more of
this protein when grown in standard conditions with FCS in the media.
It is also interesting to note that some groups are developing biomarkers based on protein isoforms and also the ratios of protein isoforms detected in particular diseases. However, with up to 30 000 or more protein variants in a single cell, protein isoform differentiation and measure-ment has been a major challenge in the developmeasure-ment of clinical diagnostic assays [24–26].
We also examined CM from glucose-responsive and glucose-non-responsive MIN-6 cells at both a medium and high cell density in order to elucidate if cell density is a big factor into the type and/or concentration of proteins detected (results not shown). The abundance levels for all the proteins highlighted in this study substantially increased in the CM from the high density cells compared with the medium density. These data show a direct corre-lation with numbers of cells conditioning the medium and the concentration of potential markers of beta cell dysfunction. Cell-to-cell communication occurs in normal functioning pancreatic beta-cells and it is worth considering if different signals are transmitted in dysfunctioning beta cells.
Novel biomarkers would have the potential to be used for predicting beta cell function. A panel of biomarkers, rather than individual markers, may be able to supply the specificity and sensitivity required. The ultimate goal would be the development of an assay, for example, an immu-noassay (ELISA) that would detect each of the individual proteins in the panel and allow for detection of beta cell dysfunction and monitoring of specific therapies used in the treatment of diabetes.
This work was supported by the PRTLI Cycle 3, programme of the Irish Higher Education Authority.
The authors have declared no conflict of interest.
5 References
[1] King, H., Aubert, R. E., Herman, W. H., Diabetes care
1998,21, 1414–1431.
[2] Zimmet, P., Alberti, K. G., Shaw, J.,Nature2001,414, 782–787.
[3] Miyazaki, J., Araki, K., Yamato, E., Ikegami, H. et al.,
Endocrinology1990,127, 126–132.
[4] Kanatsuka, A., Makino, H., Yamaguchi, T., Ohsawa, H.
et al.,Diabetes1992,41, 1409–1414.
[5] Dowling, P., O’Driscoll, L., O’Sullivan, F., Dowd, A.et al.,
Proteomics2006,6, 6578–6587.
[6] O’Driscoll, L., Gammell, P., Clynes, M.,Transplant. Proc.
2004,4, 1159–1162.
[7] Faradji, V., Sotelo, J., Acta Neurol. Scand. 1990, 5, 402–406.
[8] Frigerio, S., Junt, T., Lu, B., Gerard, C.et al.,Nat. Med.
[9] Kulasingam, V., Diamandis, E. P.,Mol. Cell. Proteomics
2007,6, 1997–2011.
[10] Bogdahn, U., Apfel, R., Hahn, M., Gerlach, M. et al.,
Cancer Res.1989,49, 5358–5363.
[11] Alban, A., David, S. O., Bjorkesten, L., Andersson, C.
et al.,Proteomics2003,1, 36–44.
[12] Kim, S. W., Cheon, K., Kim, C. H., Yoon, J. H.et al.,
Cancer Res.2007,14, 6565–6573.
[13] Helle, K. B., Biol. Rev. Camb. Philos. Soc. 2004, 79, 769–794.
[14] Huttner, W. B., Gerdes, H. H., Rosa, P.,Trends Biochem. Sci.1991,1, 27–30.
[15] Kirchmair, R., Hogue Angeletti, R., Gutierrez, J., Fischer Colbrie, R., Winkler, H.,Neuroscience, 1993,53, 359–365. [16] Hosaka, M., Suda, M., Sakai, Y., Izumi, T.et al.,J. Biol.
Chem.2004,5, 3627–3634.
[17] Sakai, Y., Hosaka, M., Hira, Y., Harumi, T. et al.,
J. Histochem. Cytochem.2003,2, 227–238.
[18] Takeuchi, T., Hosaka, M., Curr. Diabetes Rev.2008,1, 31–38.
[19] Kabat, E. A., Moore, D., Landow, H.,J. Clin. Invest.1942,
21, 571–577.
[20] Jacobsson, B., Carlstrom, A., Platz, A., Collins, V. P.,
J. Clin. Endocrinol. Metab.1990,71, 875–880.
[21] Sundsten, T., Eberhardson, M., Go¨ransson, M., Bergsten, P.,Proteome Sci.2006,4, 22.
[22] Refai, E., Dekki, N., Yang, S. N., Imreh, G.et al.,Proc. Natl. Acad. Sci. USA2005,102, 17020–17025.
[23] Woong-Shick, A., Sung-Pil, P., Su-Mi, B., Joon-Mo, L.
et al.,Cancer Sci.2005,96, 197–201.
[24] Anderson, T. J., Tchernyshyov, I., Diez, R., Cole, R. N.
et al.,Proteomics2007,8, 1197–1207.
[25] Ahmed, N., Oliva, K. T., Barker, G., Hoffmann, P.et al.,
Proteomics2005,13, 3343–3352.
[26] Naya, Y., Fritsche, H. A., Bhadkamkar, V. A., Mikolajczyk, S. D.et al.,Urol. Oncol.2005,1, 16–21.