Error Return Plots
Ron Artstein
Institute for Creative Technologies, University of Southern California 12015 Waterfront Drive, Playa Vista, CA 90094-2536, USA
<lastname>@ict.usc.edu
Abstract
Error-return plots show the rate of error (misunderstanding) against the rate of non-return (non-understanding) for Natural Lan-guage Processing systems. They are a use-ful visual tool for judging system performance when other measures such as recall/precision and detection-error tradeoff are less informa-tive, specifically when a system is judged on the correctness of its responses, but may elect to not return a response.
1 Introduction
Many Natural Language Processing systems make a distinction between misunderstanding, where the system interprets an input incorrectly, and non-understanding, where the system is aware that it is not able to interpret an input (Bohus and Rudnicky, 2005). This distinction is common in dialogue sys-tems, where it pertains to Natural Language Under-standing components which pass their output to a dialogue manager: a dialogue manager will act on the contents of misunderstood input, but if it knows that the input is not understood then it can engage in a variety of recovery techniques, such as asking for clarification, moving on, or changing the topic. For this reason non-understanding is usually preferred to misunderstanding. While common to dialogue sys-tems, the concept of non-understanding is useful for other tasks as well, whenever a system can bene-fit from the knowledge that its best interpretation is likely to be incorrect (see below for an example in question answering).
Detecting non-understanding is a tradeoff: a sys-tem that is prone to non-understanding will
in-evitably miss some inputs that it would have under-stood correctly under a forced interpretation. This is similar but not identical to the familiar trade-offs between recall and precision (van Rijsbergen, 1979) and between detection and error (Martin et al., 1997). Recall and precision are measures taken from information retrieval, where there are typically mul-tiple documents relevant to a query, and ideal per-formance is defined as retrieving all and only the relevant documents: recall measures the “all” part while precision measures the “only” part, and tun-ing a system to increase one measure typically im-plies decreasing its counterpart. Detection and er-ror apply to forced choice tasks: each input must be classified as either positive or negative, and decreas-ing false positives typically implies increasdecreas-ing false negatives and vice versa. The tradeoff between mis-understanding and non-mis-understanding is similar to recall-precision in that a response need not be given to each input, and is similar to detection-error in that when a response is given, we only care about its cor-rectness and not about its exhaustiveness.
There is presently no accepted measure for the tradeoff between misunderstanding and non-understanding. A recent example illustrating the confusion, and need for a standard measure, comes from the QALD-1 Open Challenge (Question An-swering over Linked Data).1 The task is defined as giving a complete and correct answer to a nat-ural language question, but systems are allowed to not return an answer. The evaluation metric uses recall and precision, but they are defined in a non-standard way. Precision is defined as the number
1http://www.sc.cit-ec.uni-bielefeld.de/sites/www.sc.cit-ec.
uni-bielefeld.de/files/sharedtask.pdf (dated 2011-03-28)
of correctly answered questions divided by the to-tal number of answered questions; given that each question receives at most one answer, this is equiv-alent to the standard definition of correct answers divided by the total number of answers provided by the system – it penalizes misunderstanding and gives credit to non-understanding. Recall is also defined in a non-standard way.
number of correctly answered questions number of questions
This would normally be considered the definition of accuracy, and it penalizes misunderstanding and non-understanding equally; the standard definition of recall is the number of correct answers divided by the number of available correct answers, and it does not normally penalize incorrect answers. The reason for the confusion between recall and accuracy is that in a task where each question has a unique correct answer, failure to provide a correct answer to a ques-tion implies that an available answer has not been retrieved. What the QALD-1 evaluation does, in effect, is penalize non-understanding through accu-racy, and penalize misunderstanding more, through both accuracy and precision.
To properly evaluate the tradeoff between mis-understanding and non-mis-understanding we need to look at each type of error separately. If each in-put receives a response, then accuracy is the com-plement of error; if some responses are not re-turned, then accuracy is the complement of the sum of errors (misunderstandings) and non-returns (non-understandings). The relative severity of misunder-standing and non-undermisunder-standing will vary based on the application: a question-answering system that is required to provide accurate information might have a low tolerance for misunderstanding, while a story-driven dialogue system might have a low tol-erance for asking clarification questions as a result of non-understanding. The relation between misun-derstanding and non-unmisun-derstanding is not fixed – a system with lower error rates under a forced inter-pretation may turn out to have higher error rates than a competitor after allowing for non-understanding. It is therefore useful to look at the entire range of return rates when evaluating systems. The remain-der of this paper introduces the error-return plot as a graphical representation for comparing error rates
across different return rates, and presents examples for its use from recent experiments.
2 Characteristics of the tradeoff
against the returned (ROC) or missed (DET) correct responses as a proportion of all correct responses. Consequently, ROC and DET curves say nothing about the actual error rate. A system with an er-ror rate of 10%, where erer-rors are uniformly spread among correct responses when ranked by the sys-tem’s confidence, will have identical ROC and DET curves to a system with an error rate of 40%, 50% or 90% with the errors spread uniformly.
For investigating the tradeoff between misunder-standing and non-undermisunder-standing, we want to look not only at the system’s decision about whether or not to return an interpretation, but also at the correct-ness of the chosen interpretation. We therefore need a plot that reflects the actual error rate as a function of the return rate.
3 Definition
An error-return plot is a graphical representation of the tradeoff between errors (misunderstandings) and failures to return a response (non-understandings). It applies to systems that react to each input in one of three possible ways – a correct response, an in-correct response, or a failure to respond to the input. The error rate and non-return rate are defined as fol-lows.
Error rate = incorrect responses
number of inputs
Non-return rate = failures to respond
number of inputs
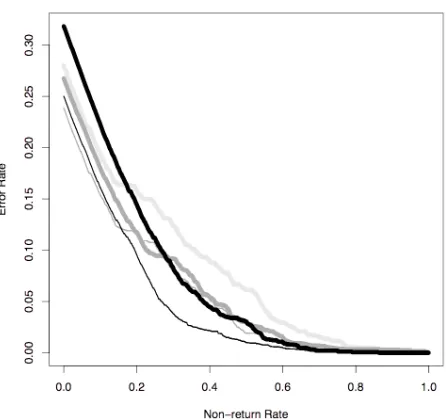
[image:3.612.316.539.61.271.2]In order to plot the entire range of the tradeoff, the system is set to make a forced-choice response to each input. The responses are then ranked according to the system’s confidence (or whatever other mea-sure is used to decide when to issue a non-return), and at each possible cutoff, the non-return rate is plotted on the horizontal axis against the error rate on the vertical axis. As the number of non-returns grows, the number of errors can only go down, so the plot is monotonically decreasing; at the extreme right, where no responses are returned, error rates are necessarily zero, while at the extreme left, the error rate is equivalent to accuracy under a forced choice. Lower curves indicate better performance.
Figure 1: Comparing tokenizers, SGT Star data (Wang et al., 2011, black = baseline)
4 Examples
An example error-return plot is shown in Figure 1. The plot is taken from Wang et al. (2011), an experi-ment which tested the effect of using phonetic infor-mation in a Natural Language Understanding com-ponent in order to recover from speech recognition errors. The base system is NPCEditor (Leuski and Traum, 2010), trained for SGT Star, a virtual charac-ter who provides information about the U.S. Army to potential recruits (Artstein et al., 2009). For each in-put utterance, NPCEditor selects one outin-put out of a fixed set, based on a learned mapping between input and output training examples; it also has the capabil-ity of not returning a response if the classifier’s con-fidence in the appropriateness of the best choice falls below a certain threshold. The specific experiment in Figure 1 tested alternative methods to tokenize the input: the base tokenizer is represented by the thick black curve, and uses words as tokens; alternative tokenizers are shown in thinner lines or in shades of gray, and they use tokens with various mixtures of phonetic and word information (phone unigrams, bi-grams etc.). The test data consisted of utterances for which the correct interpretation is known, but which NPCEditor would occasionally fail to classify due to speech recognition errors.
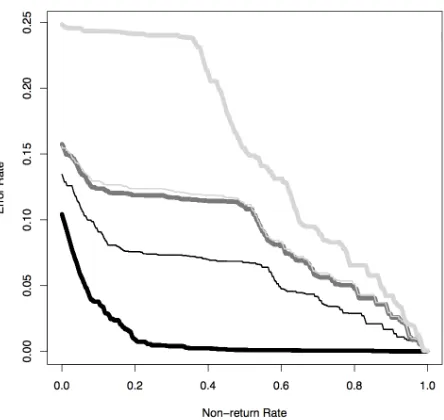
Figure 2: Comparing tokenizers, Twins data (Wang et al., 2011, black = baseline)
under forced choice, but the error rate decreases rapidly when non-understanding is allowed (on the left-hand side of the plot the slope is close to −1, which is the steepest possible decline). When tol-erance for non-understanding is low, all the alter-native tokenizers produce lower error rates than the baseline; however, increasing the non-understanding does not affect all tokenizers equally, and the er-ror rate of the baseline tokenizer improves more rapidly than others, so that at 30% non-return rate it is better than most of the alternative tokenizers. Fi-nally, one alternative tokenizer – the thin black line – shows best or almost-best performance at all return rates, supporting the hypothesis of the original ex-periment, that adding phonetic information to a Nat-ural Language Understanding component can help in recovery from speech recognition errors.
Figure 2 is from the same experiment but using a different data set – the one developed for the the twins Ada and Grace, two virtual guides at the Mu-seum of Science in Boston who answer questions about their neighboring exhibits and about science in general (Swartout et al., 2010). The overall error rate is much lower than in Figure 1. Otherwise, the pattern is similar, though we see that the thin gray to-kenizer has shifted from a close second-best to being the worst performer. Once again, the thin black tok-enizer beats all the others across most return rates.
Figure 3: Augmented classifiers (black = baseline)
[image:4.612.76.299.63.269.2]5 Discussion
The error-return plot is a graphical representation for looking at the tradeoff between misunderstand-ing and non-understandmisunderstand-ing. Evaluatmisunderstand-ing systems ca-pable of indicating non-understanding is somewhat tricky, and error-return plots can show information that is useful when comparing such systems. If the curve of one system completely dominates the other, then we can say with confidence that the first system has better performance. If the curves in-tersect, then we need to compare the parts of the curve where we expect actual system performance to fall, and this will vary by application. The sys-tems described above all use the same strategy for dealing with non-understanding: they issue an “off-topic” response which asks for clarification, stalls, or changes the conversation topic. The systems are intended for fairly short question-answer dialogues, for which an off-topic response rate of about 1 in 5 is usually acceptable, so the critical region is around 20% non-understanding. In applications where it is possible to judge the relative severity of misunder-standing and non-undermisunder-standing, a weighted aver-age could identify the optimal setting for the non-understanding threshold. Such an average should give non-understanding a lower weight than misun-derstanding, since treating them as equal would ob-viate the need for identifying non-understanding.
A counterpart to the error rate would be the “missed chance rate” – the proportion of responses that would have been correct under forced choice but were not returned. Curves for missed chances start at zero (when all responses are returned) and in-crease with the non-return rate to a maximum of one minus the absolute error rate. The relation between the missed chance curve and the error return plot is straightforward: wherever the error return curve goes down, the missed chance curve stays level, and wherever the error return plot stays level, the missed chance curve goes up. The curves intersect at the point where the number of misunderstandings is identical to the number of non-understandings that would have been correct under forced choice; it is not clear, however, whether this point has any prac-tical significance.
Error-return plots suffer from the usual problem of evaluating single components in a dialogue
sys-tem: since subsequent input is to a certain extent contingent on system actions, it is conceivable that a system prone to misunderstanding would trigger different user utterances than a system prone to non-understanding. Determining the full consequences of non-understanding would require running a full dialogue system with real users under varying set-tings; error-return plots show the performance of Natural Language Understanding under the assump-tion of fixed input.
Overall, error return plots provide useful in-formation about the tradeoff between misunder-standing and non-undermisunder-standing in cases where re-call/precision, ROC and DET curves are less infor-mative. They have been used in several recent ex-periments, and hopefully may gain acceptance as a standard tool for system evaluation.
Acknowledgments
The project or effort described here has been spon-sored by the U.S. Army Research, Development, and Engineering Command (RDECOM). State-ments and opinions expressed do not necessarily re-flect the position or the policy of the United States Government, and no official endorsement should be inferred.
References
Ron Artstein, Sudeep Gandhe, Jillian Gerten, Anton Leuski, and David Traum. 2009. Semi-formal evalu-ation of conversevalu-ational characters. In Orna Grumberg, Michael Kaminski, Shmuel Katz, and Shuly Wintner, editors, Languages: From Formal to Natural. Essays Dedicated to Nissim Francez on the Occasion of His 65th Birthday, volume 5533 ofLNCS, pages 22–35. Springer, May.
Dan Bohus and Alexander I. Rudnicky. 2005. Sorry, I didn’t catch that! – An investigation of non-under-standing errors and recovery strategies. In Proceed-ings of the 6th SIGdial Workshop on Discourse and Dialogue, pages 128–143, Lisbon, Portugal, Septem-ber.
Anton Leuski and David Traum. 2010. Practical lan-guage processing for virtual humans. InProceedings of the Twenty-Second Innovative Applications of Arti-ficial Intelligence Conference (IAAI-10), pages 1740– 1747, Atlanta, Georgia, July.
Alvin Martin, George Doddington, Terri Kamm, Mark Ordowski, and Mark Przybocki. 1997. The DET curve in assessment of detection task performance. In
Eurospeech 1997, pages 1895–1898, Rhodes, Greece, September.
Ronakkumar Patel, Anton Leuski, and David Traum. 2006. Dealing with out of domain questions in vir-tual characters. In Jonathan Gratch, Michael Young, Ruth Aylett, Daniel Ballin, and Patrick Olivier, editors,
Intelligent Virtual Agents: 6th International Confer-ence, IVA 2006, Marina Del Rey, CA, USA, August 21– 23, 2006 Proceedings, volume 4133 ofLecture Notes in Artificial Intelligence, pages 121–131, Heidelberg, August. Springer.
William Swartout, David Traum, Ron Artstein, Dan Noren, et al. 2010. Ada and Grace: Toward realis-tic and engaging virtual museum guides. In Jan All-beck, Norman Badler, Timothy Bickmore, and Alla Pelachaud, Catherine Safonova, editors, Intelligent Virtual Agents, volume 6356 ofLNAI, pages 286–300. Springer, September.
John A. Swets. 1973. The relative operating characteris-tic in psychology.Science, 182(4116):990–1000. C. J. van Rijsbergen. 1979. Information Retrieval.
But-terworths, London, 2nd edition.