<http://orcid.org/0000-0002-2931-8077>
Available from Sheffield Hallam University Research Archive (SHURA) at:
http://shura.shu.ac.uk/8313/
This document is the author deposited version. You are advised to consult the
publisher's version if you wish to cite from it.
Published version
DELVES, Peter, MANNING, Warren and SHENFIELD, Alex (2012). A torque
vectoring approach to post incident control. In: AVEC 2012 : 11th International
Symposium on Advanced Vehicle Control, Seoul, Korea, 9-12 September 2012.
Copyright and re-use policy
See
http://shura.shu.ac.uk/information.html
Sheffield Hallam University Research Archive
A Torque Vectoring Approach to Post Incident Control
Peter Delves, Warren Manning and Alex Shenfield, Manchester Metropolitan University
Manchester Metropolitan University, Room 313, John Dalton University Manchester, M15 6BH, England
E-mail: [email protected]
An investigation into the use of drive torque vectoring for post-impact control aimed at reducing lateral displacement and bringing the vehicle back to its original heading position. Comparison has been carried out to compare the drive torque vectoring’s performance with a steering controller. A non-linear 7 D.O.F model using a Pacejka tyre model is developed and used for simulation. Simple PID control is implemented for both torque and steering controllers. They both use negative feedback control to reduce lateral global position. The torque vectoring controller uses a differential controller distributing a maximum 300N/m between front left and right wheels. The results show that torque vectoring control is superior to steering control which was not able to regain control of the vehicle.
Topics: Crash Mitigation, Modelling and Simulation, Vehicle Dynamics
1. INTRODUCTION
Incident analysis shows that a staggering 42% of all serious injuries that occurred on US roads between 1998 and 2000 were in multiple impact crashes [1]. Initially this value does not seem too serious but considering that multiple impact crashes account for 24% of all crashes this is a severe problem.
There have been several approaches to reduce the occurrence of impacts and severity of an incident, such as occupant protection systems, structural developments and active control systems.
Active occupant protection systems within the vehicle have been explored extensively with the use of air-bags and smart belt pre-tensioning systems. These are easy to optimise for single impact impulses but are harder to optimize in multiple impact scenarios as the timing of these systems firing is critical in the level of mitigation they provide. Pre-tensioning seatbelts appear to be more beneficial in these scenarios as they fix occupants in position [2] but there are difficulties in identifying the appropriate tensioning loads for multiple impacts and they are less effective in lateral impacts.
Another approach is in structural reinforcement and smart crumple zones. These are effective at stopping objects intruding into the passenger cell but can potentially increase harmful levels of acceleration on vehicle occupants. Crumple zones can be tailored to reduce impact forces in certain orientation but is difficult in multiple impact incidents as the positions of secondary impacts are incredibly difficult to predict. Smart materials have incredible potential as they can adapt their properties to environmental factors but are often costly and complex to manufacture so are not appropriate for main stream production.
An alternative option is the use of dynamic control.
There are several different ways to approach this form of mitigation. There are active systems which improve the vehicle stability (for example, Electronic Stability Control (ESC), Anti-lock Braking Systems (ABS) and Traction Control Systems (TCS)) by controlling the vehicles dynamic state to keep the driver in control for longer. These systems are well proven at preventing incidents [3] in normal to moderate driving conditions. They do require many actuators and sensors to interface with each other and frequently result in complex control strategies. It is important to note that systems like these act as day to day driver aids rather than subsuming driver decision making into the controller scheme. There are more active systems known as Advanced Driver Assistants Systems (ADAS) which take more authority over the vehicle control. ADAS systems consist of technologies like Active Cruise Control (ACC), Collision Warning (CW), and Collision Avoidance (CA). These systems require an even higher degree of sensors, cameras and image processing techniques to identify potential hazards and then take action through actuators. These systems have a lot of potential to reduce accident occurrence and severity as they can react fast, intervening those crucial few seconds before a driver.
As can been seen a wealth of pre-impact and Advanced Driver Assistance Systems (ADAS) research has been carried out in the past 20 years. This does make sense when considering the best way to reduce injury is through the prevention or evasion of accidents but these systems do not guarantee that an accident will not occur.
vehicles and reduce their lateral deviation [4].
Drive vectoring has been studied to improve limit handling and steady state driving behavior for a while but an area where its use seems to of been overlooked is in post-crash control despite the fact that this is a dynamic and responsive system. This is strange as the potential of torque vectoring is large as it deals with longitudinal forces which intern can be used to manipulate yaw behavior when lateral forces can easily become saturated in high dynamic intensity scenarios (such as in a collision).
The key research questions are 1) Can existing vehicle control systems mitigate against danger in post impact incidents? 2) What effect does drive torque vectoring have in post-impact control?
The research presented in this paper examines the benefits of using a torque vectoring approach to post incident control.
The paper is structured as follows. Section 2 introduces the collision scenarios, Section 3 outlines the methodologies used in the modeling of the vehicle. Section 4 discusses the controller layout and implementation section 5 presents the results and discussion. Section 6 concludes the paper and examines further work.
2. COLLISION SCENARIOS
Two accident scenarios have been selected for this paper to test the control systems.
The two scenarios selected are an offset rear collision and a sideswipe collision.
The two scenarios cause a yaw moment which sends both vehicles off course from their desired heading increasing the chance of further collisions.
These scenarios have been selected as to represent real life crash situations which are cause by driver misjudgment and large speed differences. Both impacts are implemented on the model by introducing a signal generator which produces an impulse signal for 0.1s (typical length of a collision) [5]. The magnitude of this impulse represents the acceleration caused by the impact and is multiplied by the distance the impact occurs from the vehicles center of gravity. This produces a yaw moment which is input into the vehicle models yaw component.
2.2.1 Rear impact scenario
The rear impact scenario is as follows:
[image:3.595.307.544.84.161.2]A leading vehicle is traveling at 50mph and the trailing vehicle is traveling at 60mph that is a closing speed of 10mph ≈ 4.5m/s. The trailing vehicle misjudges its position whilst attempting to overtake and impacts the leading vehicle on the rear right track. This imparts a large impulse force but at smaller distance from the center of gravity then the sideswipe scenario. See Fig. 1 for graphical representation.
Fig 1 Rear impact scenario
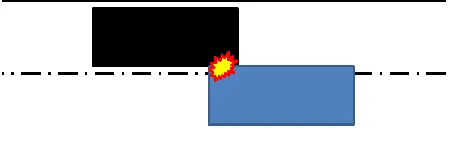
2.2.1 Side swipe impact scenario
The sideswipe impact scenario is as follows: A leading vehicle is traveling at 60mph as it is overtaking and the trailing vehicle is traveling at 50mph. The lead vehicle strikes the trailing vehicle at its front wheel plane as it move back into lane to early before it has cleared the trailing vehicle. As it’s a sideswipe impact the collision speed is lower as the speed difference is is caused by the lateral velocity of the leading vehicle moving back into lane. But the moment being produced actually ends up being larger as the distance to the wheel plane from the center of gravity of the two vehicles is larger than the track width. See Fig. 2 for graphical representation
Fig 2 Sideswipe impact scenario
3. VEHICLE MODELLING
This paper is studying the use of drive torque vectoring for post-impact stabilization of a vehicle. This includes the comparison of this drive vectoring system with a steering control system. In light of this the vehicle model requires a level of complexity that allows both steering and torque control to be implemented.
It is also important to consider the dynamics involved in crashes are highly intensive and non-linear in the extreme because of the forces and speeds usually involved.
It has been justified that a 3 D.O.F bicycle model with cornering forces is adequate [4,5]. However when assessing the forces generated in crash scenarios and tyre dynamics this is an inadequate way of representing the vehicle and the way forces are generated in tyres. Taking this into consideration the problem requires a higher fidelity model to give a better representation of what is actually happening. It is also important to have a tyre model which accurately represent the way forces are generated. This is because the likelihood is that the forces in a crash will saturate the tyres reducing the possibility of control.
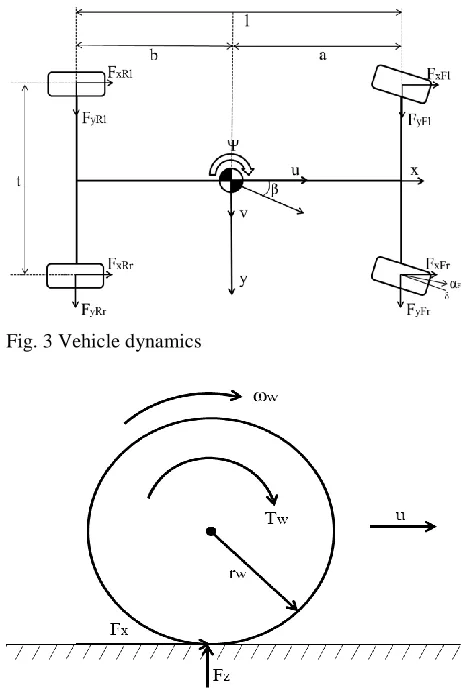
[image:3.595.311.536.357.428.2]velocity (u) and yaw rate (Ψ) of the vehicle body, with the other 4 D.O.F coming from the rotational spin component of each wheel ω (As the paper is investigating the use of drive torque vectoring it is important that these 4 wheel D.O.F are included so the torque can be controlled at each wheel independently).
This is a handling model as comfort is not of consideration during an accident. Therefor no modeling of the suspension system has been done.
[image:4.595.54.285.250.596.2]This model is controlled through manipulation of the wheel plane angle δ in to the steering system and the torque at each wheel. Free body diagrams of the vehicle and wheel are shown in fig.3 and fig.4 respectively.
[image:4.595.311.542.469.601.2]Fig. 3 Vehicle dynamics
Fig.4 Wheel rotational dynamics
The model uses Pacejka’s ‘Magic Formula’ combined slip tyre model [6] to represent longitudinal and lateral forces developed by the tyres. The combined tyre model has been used rather than two separate (pure) lateral and longitudinal slip models as the interaction between them is important to this study when:
The scenarios develop complex non-linear dynamic behavior both laterally and longitudinally
Control of both lateral and longitudinal forces is being carried out so modeling of how combined tyre forces interact is important.4. CONTROL SYSTEMS
There are two control systems being tested in this study with an uncontrolled response where the steering is locked as a control. The controllers are reasonably simple in there design as this paper is an investigation into the feasibility of torque vectoring and to compare their performance. The control objective is to reduce maximum lateral displacement of both vehicles and bring them back to 0 global lateral displacement in the shortest time possible.
4.1 Steering controller
The steering controller utilizes negative feedback PID control to bring the vehicle back into lane after the impact. This is done by setting the desired global lateral position to 0 then subtracting the actual global position through the feedback loop. The PID controller then operates the steering angle at the wheels which in turn generates lateral slip in the tyre and thus lateral force. The controller has bounds set to limit the angles at the wheel to ±10o to stop the model applying unrealistic steer angles. The model was tuned manually to get the best response.
4.1 Drive Torque Controller
The drive torque controller provides differential control between the two front wheels. Negative feedback PID controller is used to distribute the available torque from left to right on the front axle. The PID controller has limits set to ±1 with +1 representing full drive to the right hand wheel 0 equal distribution and -1 for torque to the left. The controller structure is shown in fig.5
Fig. 5 Block diagram of torque controller.
The reference input represents the desired global lateral position which was set to 0.
5. SIMULATION RESULTS
To evaluated and compare the torque and steering controllers numerical simulation has been carried out. They have been tested on the two crash scenarios outlined in section 2.
5.1 Rear Impact Results and Analysis
Both the leading and trailing vehicles were analyzed to see how they both react to the scenario. The lateral deviation in respect to time is plotted in fig.6 and 7.
Fig. 6 Lead vehicle lateral displacement after a rear impact traveling at 50mph ≈ 22.5 m/s
Fig. 7 Trailing vehicle lateral displacement after rear impact traveling at 60mph ≈ 27 m/s
The trailing vehicle is traveling faster so there is a larger displacement to deal with and takes longer to bring under control. The torque controller is a lot more effective as it brings the vehicle back to a stable state whereas the steering controller has a detrimental effect resulting in larger displacements than the uncontrolled vehicle.
As expected the uncontrolled vehicle yaws and the locked steering allows the vehicle to counter the forces
developed and as there is no control it continues to travel at the angle its yawed to.
The steering controller never regains control of the vehicle and makes the resulting displacement worse. This is because the impulse has caused large side forces to be developed and as it attempts to correct the deviation the desired tyre forces can not be generated as they have become saturated.
Torque vectoring has been effective with the reason for this is that it effects the tyres longitudinal forces which although are dependent on lateral forces are not totally saturated allowing the lateral slip to decrease as the vehicle stops sliding sideways. As the lateral slip angles reduce the available longitudinal force increases increasing the effectiveness of the torque vectoring.
5.2 Sideswipe Impact Results and Analysis
Again both leading and trailing vehicles are observed to gain a better understanding of the whole crash and what happens to both vehicles and are shown in fig. 8 and 9.
Fig. 8 Lead vehicle lateral displacement after a sideswipe impact traveling at 60mph ≈ 27 m/s
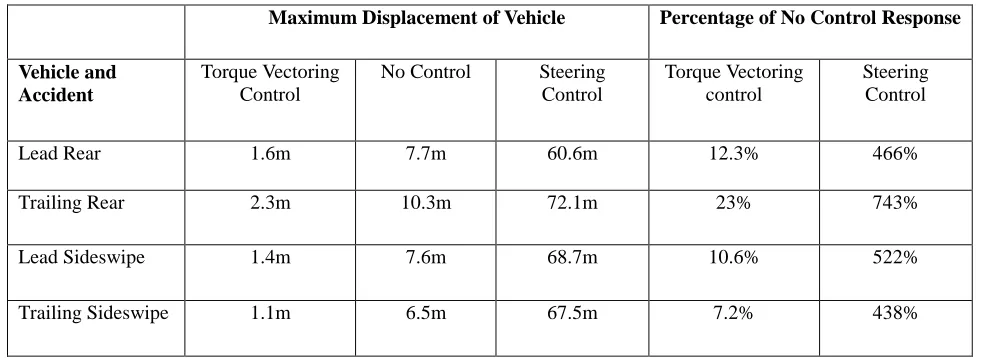
[image:5.595.58.284.221.401.2] [image:5.595.311.538.339.524.2] [image:5.595.58.284.438.618.2] [image:5.595.312.537.555.735.2]Table 1 Maximum displacements of vehicle center of gravity and comparison of percentage difference of torque vectoring and steering control against no control
In this simulation the trailing vehicle is travelling slower as it is being overtaken and is being struck on the front wheel plane by the overtake vehicle.
As in the rear impact scenario the steering controller can not produce the desired tyre forces as the lateral forces have been saturated resulting in a detrimental effect.
The torque vectoring controller has again performed well bring the vehicle back into position within 4 seconds with little oscillation.
Table 1 shows the maximum displacement each vehicle undergoes after the impact, and analyzes the percentage difference of each of the controlled responses against no control. These results show the extent to which the steering controller has been detrimental to the vehicles responses, with maximum displacements ranging between 438%-743% of the uncontrolled vehicles. Whereas the effectiveness of the torque controller can clearly be seen when the largest displacement produced is 23% of the uncontrolled vehicle.
From these results it appears that the rear impact scenario is the more severe incident of the two. This is to be expected as the forces and moments imparted are the largest.
6. CONCLUSIONS
This paper set out to investigate the feasibility of using drive torque vectoring control in post-impact situations and to compare this with a steering control system. The implementation of a torque vectoring system using PID control was outlined with the control objective to reduce the vehicles lateral displacement to 0 after a disturbance impulse.
The impulses cause large yaw rates and thus lateral deviation. This produces large lateral forces in the tyres which can easily be saturated when steer angles are applied. This means that countering the yaw moment trying to bring the vehicle back to 0 lateral displacement
is difficult when trying to use lateral tyre forces as the force needed is not available. Whereas torque vectoring has been effective as its main source of force is from the longitudinal tyre force component which has force available.
The results clearly show that torque vectoring control is effective in this situation as it is able to restabilize the vehicle and bring it back to its initial position without much oscillation or error after the impulse disturbance.
Previous papers have used linearized bicycle models in with simple tyres to run stabilization analysis which has brought about decent results but this is a questionable approach because of the complexity and dynamic intensity of such scenarios.
This paper has shown that drive torque vectoring is a viable system for use in post-crash control and mitigation.
Things to consider for further work are:
This system did encounter some oscillation about the settling point which is not ideal. Further work will look to integrating a settling controller which is more tuned to deal with this second phase of stabilization.
Upon analysis of the results, available tyre force is an important aspect for control under these circumstances. With this in mind the effects of weight transfer will be integrated into further experimentation to investigate the effect it has to these scenarios.
The steering control was not very effective at controlling lateral position but in other papers [4, 5] combining this with yaw angle control seems to be effective. Further development of a multi input controller to investigate if adding yaw angle control improves steering controls effectiveness.
Maximum Displacement of Vehicle Percentage of No Control Response
Vehicle and Accident
Torque Vectoring Control
No Control Steering Control
Torque Vectoring control
Steering Control
Lead Rear 1.6m 7.7m 60.6m 12.3% 466%
Trailing Rear 2.3m 10.3m 72.1m 23% 743%
Lead Sideswipe 1.4m 7.6m 68.7m 10.6% 522%
APPENDICES
A. Nomenclature
αf Front tyre slip angle (rad) β Vehicle body slip angle (rad) δ Steer angle (rad)
Ψ Vehicle yaw rate (rad/s) ωw Wheel rotational speed (rad/s)
a Distance from Center of gravity to front
wheel plane (m) b Distance from center of gravity to rear wheel
plane (m)
Fx Longitudinal tyre force (N) Fy Lateral tyre force (N) Fz Normal tyre force (N)
l Distance from front to rear axle of the
vehicle (a+b) (m) rw Wheel radius (m)
t Distance between left and right wheels (m) Tw Torque on the wheel (N/m)
Tmax Maximum torque available to distribute between front left and front right wheel (N/m)
u Longitudinal velocity (m/s) v Lateral velocity (m/s) x Longitudinal axes y Lateral axes
REFERENCES
[1] K. Digges and G. Bahouth: Frequency Of Injuries In Multiple Impact Crashes, Proceedings of the 47th Association For The Advancement Of Automotive Medicine,2003.
[2] U.Sander, K. Mroz, O. Boström and R. Fredriksson: The Effect Of Pre-Pretensioning In Multiple Impact Crashes, Proceedings of the of the 21st International Technical Conference On The Enhanced Safety of Vehicles, 2009.
[3] M. Aga and A. Okada: Analysis Of Vehicle Stability Control (Vsc)'S Effectiveness From accident Data, 18th ESV Conference, Paper No. 541, 2003.
[4] C.Y. Chan, H.S. Tan: Lane Tracking Control in Vehicle-Following Collision Situations, American Control Conference, Vol. 5, 1999.
[5] H. Tan and C. Chan: Design Of Steering Controller And Analysis Of Vehicle Lateral Dynamics Under Impulse Disturbances, Proceedings of the American Control Conference, 2000