E
YEM
OVEMENTS ANDR
EWARD,
S
EQUENTIAL STATES,
AND
C
ONTEXT-D
EPENDENTT
ARGETS
ELECTIONThesis by Michael Campos
In Partial Fulfillment of the Requirements for the Degree of
Doctor of Philosophy
California Institute of Technology Pasadena, California
2007
© 2007
ACKNOWLEDGEMENTS
I am thankful for my scientific lineage, from the earliest progenitors of inquiry and discovery, to the pioneers of neuroscience, to my thesis advisor, Richard Andersen. Under Richard’s guidance I matured into a committed neurophysiologist and was continually inspired to refine and clarify my projects, papers, and analysis. I am grateful for the guidance and feedback provided by my thesis committee: Shin Shimojo, Christof Koch, Wolfram Schultz, and John O’Doherty. Throughout my graduate work I received additional encouragement, assistance and support from many other professors. Thank you: Joel Burdick, Erik Winfree, Kenji Doya, Masamichi Sakagami, Larry Pinto, and Mark Segraves. I spent my formative years as a scientist in the company of brilliant and dedicated mentors.
The Andersen Lab always felt like a nurturing family, and I am indebted to all of my colleagues over the last five years. Thanks to Alex Gail, Brian Corneil, Zoltan Nadasdy, Rodrigo Quian-Quiroga, Marina Brozovich, Dan Rizzuto, Sam Musallam, Bradley Gregor, Kelsie Pejsa, Nicole Sammons, Viktor Shcherbatyuk, Tessa Yao, and my grad student crew, Rajan Bhattacharyya, Grant Mulliken, Brian Lee, Eddie Branchaud, Hilary Glidden, Matt Nelson, and Asha Iyer. Extra special thanks must go to Boris Breznen. Our relationship began as an apprenticeship and, over the last three years, transitioned gracefully into a collaborative partnership.
Alan Hampton, Alex Holub, Kerstin Preuschoff, Sidney Cox, Tosin Otitoju, Ulrik Beierholm, and Vivek Jayaraman.
My family has supported me unconditionally along my journey. My father, George, has become one of my best friends, and my mother, Virginia, has been a patient and loving teacher who inspired me to approach problems creatively. My siblings Sara, Katie, and Christian, have always added sparkle and joy to my world. I welcome Julie to the family and acknowledge my grandparents, Alice Couturier, Aba (mi jovencita), and Abo, who I will always miss. Also, I thank my uncle, Vincent Takas, who welcomed me into his home when I first moved to California. The monks and nuns of Deer Park monastery, teachers in the tradition of Zen Master Thich Nhat Hahn, have given me support and guidance on all levels from their mountaintop sanctuary. And thank you to my new family, Virginia and David Tobias, my in-laws, who have shown great pride and caring, and to my aunts, uncles, cousins, niece, nephew, and goddaughter.
ABSTRACT
TABLE OF CONTENTS
Acknowledgements………...……….iii
Abstract………...………...…..v
Table of Contents………..……….….vi
List of Illustrations and Tables……..……….…...…vii
Introduction………..…………..…..1
Chapter 1: Supplementary Motor Area Encodes Reward Expectancy in Eye-Movement Tasks………..…..5
Chapter 2: Neural Representation of Sequential States within an Instructed Task………….………..………...…..40
Chapter 3: Selection of Targets and Disregard of Irrelevant Stimuli in monkey LIP and SEF………...………82
Chapter 4: Individual LIP Neurons Remap Directional Tuning Preferences in Different Task Contexts………...………104
Conclusion…..………..……….………….….133
LIST OF ILLUSTRATIONS AND TABLES
Figure 1.1. Time course of oculomotor tasks………...…….10
Figure 1.2. Sites of neural recording……….17
Figure 1.3. Shift in burst onset times………...……….20
Figure 1.4. Histograms of burst onset times……….21
Figure 1.5. Example response to control trials………..24
Table 1.1. Total number of recorded neurons for both monkeys………..………15
Table 1.2. Cell counts for spatial tuning properties of recorded neurons………...16
. Figure 2.1. Time course of oculomotor tasks………49
Figure 2.2. Example SEF neurons………56
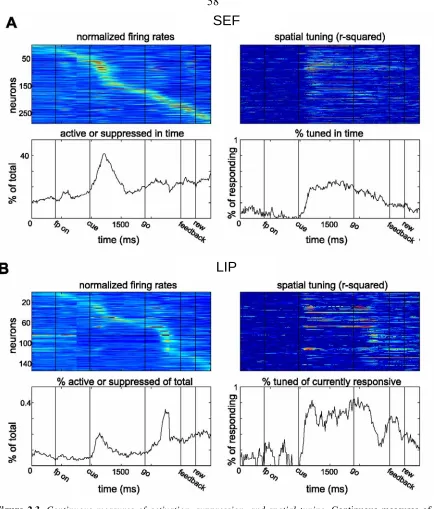
Figure 2.3. Continuous measures of activation, suppression, and spatial tuning……...58
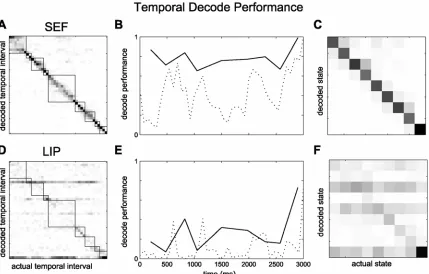
Figure 2.4. Temporal decode performance………..…….60
Figure 2.5. Summary temporal and spatial decode results……….……..63
Table 2.1. Cell counts for the neuronal database………..………54
Supplementary Figure 2.S1. Example LIP neurons………...….76
Supplementary Figure 2.S2. Activity types exhibited by individual neurons…………77
Supplementary Figure 2.S3. Variety of event detection activity in SEF…...………….78
Supplementary Figure 2.S4. Variety of anticipation activity in SEF……….….80
Supplementary Figure 2.S5. Variety of state encoders in SEF………..….81
Figure 3.1. Time course of oculomotor tasks………...………….88
Figure 3.2. Responses to a distractor………92
Figure 3.3. Continuous measures of activation, suppression, and spatial tuning…....….94
Figure 3.4. Variety of state encoding neurons in SEF……….…….96
Figure 3.5. Spatial decode performance for cue and distractor positions……….97
Table 3.1. Cell counts for the neuronal database………...………..……….91
.
Figure 4.1. Behavioral tasks used in the experiment………...………...109
Figure 4.2. Sample cell recorded form monkey R……….……….115
Figure 4.3. Cells’ spatial tuning compared across the two tasks………...…….118 Figure 4.4. Population vector decode of the direction of saccades………...…….…….119 Figure 4.5. ROC analysis of object-centered location of the cue discriminability…..120
INTRODUCTION
Eye movements can be made reflexively or voluntarily, and because they can be made voluntarily, the study of eye movements offers a window into the mechanisms of many high-level brain functions. With the development of awake-behaving neurophysiology techniques, the field of neuroscience became equipped to probe the working brain. Mainly in the last half-century, neurophysiologists have detailed the brain structures involved in eye movement control. At this stage it remains a challenge to understand how the different parts complement each together, and how they interface with other functional circuits in the brain, to support an organism in successfully completing the variety of tasks involved in normal behavior. In this dissertation we characterize some of the properties of two cortical nodes of the eye movement network, the supplementary eye fields (SEF) and the lateral intraparietal area (LIP), as well as a brain area that is just adjacent to SEF, the supplementary motor area (SMA), as they interface with (and participate in) other functional networks, particularly those supporting reward processing, the temporal organization of behavior, target selection, and object perception.
The first study describes the confluence of eye movement and reward circuitry in supplementary motor cortex. We found signals related to the expectation of reward in the SMA, which complement similar findings in SEF. These results suggest a reinforcement mechanism to learn new, coordinated behavior between different body parts.
found that the neural expectation of events is not limited to the arrival of rewards, but also precedes all perceptual and motor events within the task. Furthermore, there was a representation of temporal states, meaning neurons activate for the duration between events. These results suggest that SEF, much more so than LIP, is likely to participate in the temporal organization of perception and behavior.
In the third study we compared LIP and SEF neurons during the performance of a target selection paradigm. We found a clear qualitative distinction, with individual LIP neurons representing the location of both cue and distractor stimuli and SEF neurons tending to respond to only one, suggesting complementary roles in target selection.
In the final study we compare the representation of eye movements made in different contexts, putting object perception and movement planning together to investigate how neurons respond when the monkey is instructed to look to a portion of an object. This study revealed that LIP encodes the same eye movements in very different ways based on the context in which the movement was instructed, suggesting that the influences of other networks can have dramatic effects on how eye movements are represented in LIP.
detailing the effects of task context, which is dependent on object recognition, on the representation of eye movements in LIP.
Establishing the author’s major contribution
The observation that the SMA encodes reward expectancy, the subject of Chapter 1, was made in a conversation with senior staff scientist, Dr. Boris Breznen, with whom I apprenticed in monkey neurophysiology. Boris was happy to let me follow up on the observation, which became a Society for Neuroscience meeting abstract, and eventually a paper in the Journal of Neurophysiology with me as the first author. Boris and I worked
closely together to devise new control experiments to assess our interpretation, and with his oversight I collected the majority of a complete dataset from two monkeys. I also performed the analysis and writing for this paper. Before publication we also enlisted the help of M.D.-Ph.D. student Kyle Bernheim to perform MRI scans.
Chapters 2 and 3 grew out of my official thesis project, and these results are more fully my own work. I trained both of the monkeys, mapped the chambers (with assistance from MRI scans), implemented the task paradigms, executed the neural recording experiments, performed the analysis, prepared the figures, and did all of the writing. I still enjoyed occasional experimental assistance from Boris, as well as conversations about the results. In addition, I benefited tremendously from my relationship with the post-doctoral scholar, Dr. Alex Gail, with whom I shared experimental space, in particular because of his instruction in multiple electrode recording.
committee. As the results came to light, however, it appeared that the questions that we were as asking did not logically precede the answers the neural recordings were giving. For example, whereas we wanted to know how SEF neurons were representing eye movement vectors made to portions of objects, it turned out that the majority of SEF neurons were not representing eye movement vectors at all. Instead they were representing temporal states within the task and the transitions from one state to the next. The stories presented in Chapters 2 and 3, therefore, did not make use of the extensive planning that went into the task designs, but were instead discovered through data analysis and visualization and refined in conversations with Richard, Boris, and other members of the Andersen Lab, where all of the work was carried out.
CHAPTER I
SUPPLEMENTARY MOTOR AREA ENCODES
REWARD EXPECTANCY IN EYE-MOVEMENT TASKS1
AB S T R A C T
Neural activity signifying the expectation of reward has been found in many parts of the brain, including midbrain and cortical structures. These signals can facilitate goal-directed behavior or the learning of new skills based on reinforcements. Here we show that neurons in the supplementary motor area (SMA), an area concerned with movements of the body and limbs, also carry a reward expectancy signal in the post-saccadic period of oculomotor tasks. While the monkeys performed blocks of memory-guided and object-based saccades, the neurons discharged a burst after a ~200 ms delay following the target acquiring saccade in the memory task, but often fired concurrently with the target acquiring saccade in the object task. The hypothesis that this post-saccadic bursting activity reflects the expectation of a reward was tested with a series of manipulations to the memory-guided saccade task. It was found that, while the timing of the bursting activity corresponds to a visual feedback stimulus, the visual feedback is not required for the neurons to discharge a burst. Second, blocks of no-reward trials reveal an extinction
1 Published in the Journal of Neurophysiology, April 20, 2005. Campos M, Breznen B,
Bernheim K, Andersen RA (2005) Supplementary Motor Area Encodes Reward Expectancy in Eye-Movement Tasks. J Neurophysiol94:1325-1335. Used with
of the bursting activity as the monkeys come to understand that they would not be rewarded for properly generated saccades. Finally, the delivery of unexpected rewards confirmed that, in many of the neurons, the activity is not related to a motor plan to acquire the reward (e.g., licking). Thus, we conclude that reward expectancy is represented by the activity of SMA neurons, even in the context of an oculomotor task. These results suggest that the reward expectancy signal is broadcast over a large extent of motor cortex and may facilitate the learning of new, coordinated behavior between different body parts.
IN T R O D U C T I O N
an anatomical region that includes our current area of interest, the supplementary motor area (SMA).
low at 10 µA) will elicit saccades in SEF (Chen and Wise 1995; Fujii et al. 1995; Mann et al. 1988; Russo and Bruce 1993; Tehovnik and Sommer 1996).
Three recent studies have explicitly connected the SEF to reward variables. Amador et al. discovered reward-predicting and reward-detecting neuronal activity in SEF (Amador et al. 2000). Schall and colleagues used the countermanding task to characterize three different types of neurons in the SEF – error, conflict, and reinforcement neurons – and suggested that these could serve a performance-monitoring function (Stuphorn et al. 2000). Roesch and Olson found modulations of neural activity in response to both reward and punishment (Roesch and Olson 2003, 2004) and concluded that these modulations during the early stages of the trials correlate with motivation and not reward expectation. In this study we present neural activity reflecting reward expectation during a later stage of the trials, specifically after the monkey performs the instructed behavior. Our findings are similar to the reports of Amador and colleagues and Stuphorn and colleagues. The reward expectancy signal we describe, however, is found in the SMA, while these other studies were recording from nearby SEF. Taken together, these results suggest that a reward expectancy signal may be present throughout the DMFC.
uncovered a post-saccadic bursting activity that we hypothesized might be related to the expectation of reward, and experiments devised during the course of the project confirmed this hypothesis. While future studies of reward expectancy in SMA might use tasks that are specifically designed to investigate reward variables, with the two oculomotor tasks employed here we are able to establish two novel findings. First, we show that a reward expectancy signal is present in the SMA, an area that has been thought to be concerned only with movements of the body and limbs, during an oculomotor task. Second, we show the coupling of the signal’s onset time with a conditioned stimulus. These findings suggest a general learning mechanism that would reinforce all motor representations in DMFC that are active just before the animal can expect to receive a reward. A preliminary account of this study has appeared previously (Campos et al. 2003).
ME T H O D S
Studies were performed on two behaving, male rhesus monkeys (Macaca mulatta). Each was chronically fitted with a stainless steel head post for head immobilization, and a recording chamber over a craniotomy for electrode insertions. All procedures were approved by the Caltech Institutional Animal Care and Use Committee.
Stimuli and tasks
built software display client with OpenGL. Task logic was controlled by National Instruments real time LabView software.
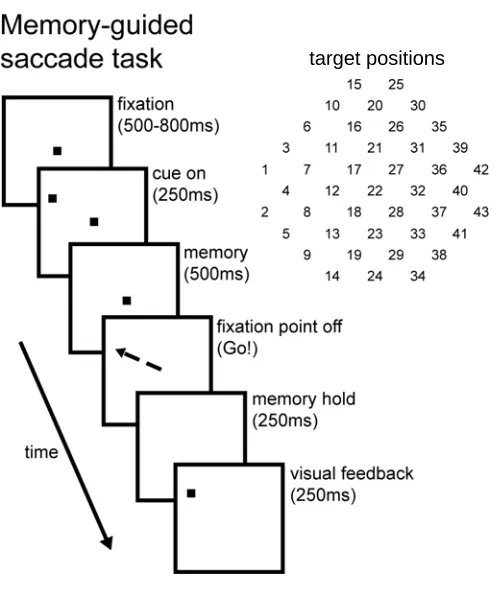
[image:19.612.110.534.265.564.2]Two eye movement tasks were used; a memory-guided saccade task and an object-based saccade task. In both tasks the monkey was instructed to perform a saccade from a central fixation point to one of 43 targets placed at regular intervals to cover the entire visual field out to 17 deg of visual angle in every direction from central fixation.
Figure 1.1 Time course of oculomotor tasks. Progression of tasks are shown in successive panels from
the top left to bottom right. In the memory-guided saccade task (a), the monkey is required to acquire a
central fixation point at the start of the trial. After a variable delay, a cue is briefly flashed at one of 43 targets in the periphery. The possible targets cover the entire visual field out to 17 degrees. Following a hold interval, the fixation point is extinguished, and the monkey is required to saccade to the remembered target location and fixate there. After 250 ms the target reappears, and then following an additional 250 ms fixation, the animal is rewarded with a drop of juice. In the object-based saccade task (b), the monkey
In the memory-guided saccade task (Figure 1.1a), monkeys were required to maintain central fixation while a peripheral target was briefly flashed, wait until the central fixation point extinguished, and then saccade to the remembered location. After successfully holding fixation at the target location, the target re-appeared to provide visual feedback of the correct eye position. The monkey then had to maintain fixation on the visible target for an additional interval of 250 ms before receiving a juice reward of about 0.2 ml.
In the object-based saccade task (Figure 1.1b), an object (isosceles triangle) was presented behind the central fixation point while the monkey fixated there. The object was cued for one of two possible locations on the object, and then, after a delay period, the object extinguished and reappeared at a peripheral location and new orientation. The monkeys were required to saccade to the previously-cued part of the object in the new location and orientation. The cued locations of the object were chosen so that the correct saccade ended in the same screen location as the targets in the memory-guided task. After maintaining fixation on the cued part of the object for 250 ms, the monkeys were rewarded with a drop (about 0.2 ml) of juice.
In a recording session a block of memory-guided saccades preceded a block of object based saccades. The memory-guided saccade block consisted of 3 correct saccades to each location. The object-based saccade block consisted of 12 correct saccades to each location. Control trials were performed during the memory-guided saccade block at the discretion of the experimenter.
Recording Procedure
Neurons were accessed on vertical penetrations with glass coated platinum-iridium electrodes (Fred Haer Co.). The electrodes were advanced with a Fred Haer or Narashige microdrive system through a blunt stainless steel guide tube pressed against the dura. Neurons were generally found 1-3mm beneath the exterior of the dura.
Waveforms were amplified and isolated online with a commercial hardware and software package (Plexon Inc.). Cell activity was monitored with custom built online data visualization software written in Matlab.
Data Analysis
distribution was calculated as the number of spikes in the trial divided by the duration of the trial. Since the mean can change from trial to trial, the algorithm assumes stationarity only over the duration of a single trial, and the threshold will adapt to changes in the baseline firing rate of the neuron over time. After the initial threshold crossing, the beginning and end of the burst were precisely identified, and multiple bursts could be identified in a single spike train (Thompson et al. 1996).
For ANOVA of firing activity in task intervals, the intervals were defined as follows. The baseline period was the interval between the acquisition of the fixation point and the cue appearance. The cue period was the interval that the cue was visible, and the memory period was the interval between the cue disappearance and the fixation point disappearance (the signal for the monkey to make the saccade). The saccade period was the 200 ms interval preceding the acquisition of the target, and the post-saccadic period was the interval from the target acquisition until the delivery of reward. All intervals were defined by these same events in both the memory and object-based tasks. The duration of the post-saccadic interval was 500 ms in the memory task and 250 ms in the object-based saccade task.
Electrical Stimulation
Electromyography
Electromyography (EMG) recordings were performed in one monkey with a World Precision Instruments (DAM 80) AC/DC amplifier and paired hook-wire electrodes (44 ga x 100 mm) from Viasys healthcare.
MR Imaging
Magnetic resonance (MR) imaging was performed at the Caltech Brain Imaging Center on a 3 T Siemens Trio. Anatomical images were acquired sagittally with 0.7 mm slice thickness using an in plane field of view of 168 x 168 mm on a 256 x 256 base matrix, yielding a final native voxel resolution of 0.656 x 0.656 x 0.7 mm. These images were realigned via multi-planar reformat to recording chamber landmarks using Siemens Syngo software (version MR 2003T DHHS). This rotated volume was resliced at 0.7 mm spacing along the z-axis of the chamber and visualized using the AFNI software package (Cox 1996).
RE S U L T S
Anatomic localization of the recording sites
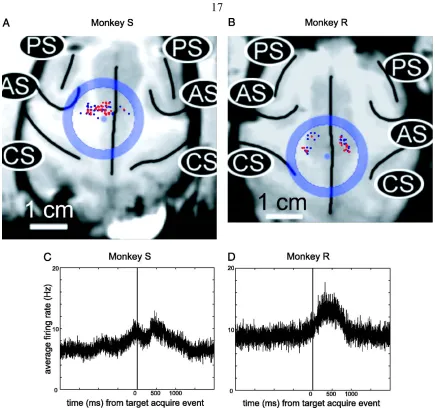
The sites of all of the electrode penetrations included in this study are superimposed on axial MRI scans in Figure 1.2 (a,b). While recordings were taken on the surface of cortex, MRI sections for anatomical localization were chosen at a depth appropriate to clearly show the locations of the penetrations relative to surrounding sulci.
The sites which yielded the 50 neurons with significant (ANOVA, p<10^-5, see above) post-saccadic modulations are shown in red, and the remaining sites are shown in blue. Not all neurons recorded at the sites marked in red were modulated in the post-saccadic period. The red marker only indicates that at least one of these 50 neurons of interest was recorded at that site.
report, indicated in red on the axial slices in Figure 1.2, mostly cluster within this distance to the left (monkey’s right) of the midline for monkey S, and to the right (monkey’s left) of the midline for monkey R. No recordings were performed in SEF. In both monkeys some of the recordings were in area F2, lateral to SMA-proper (Luppino et al. 1991). In monkey S, the majority of the recordings were directly medial to the genu of the arcuate sulcus, while in monkey R the recordings were medial and somewhat
Figure 1.2. Sites of neural recording. Projections of chamber walls are indicated with a blue circle
superimposed on axial MRI scans of Monkey S (a) and R (b). Anatomical landmarks are of the arcuate
sulci (AS), principle sulci (PS), and central sulcus (CS). Recording sites that yielded reward interval activity are shown as red dots, and the remaining recording sites are blue. Averaged output of all recorded neurons (c, d) shows the average firing rate for all recorded neurons for each monkey aligned on the target
posterior. The SEF is medial to the arcuate sulcus and somewhat anterior, though there is some variability in the precise location of SEF as described in previous studies. See Sommer and Tehovnik (1999) for review.
Microstimulation
Electrical stimulation experiments show the progression of body movement responses typical of the SMA (Mitz and Wise 1987). Since eye movements were not observed to be elicited in either of the monkeys by stimulation of 50 µA, which is the upper limit of the low threshold criterion for eliciting eye movements in the SEF (Russo and Bruce 1993), or even currents as high as 200 µA, the recordings were not in the oculomotor area SEF.
Population characteristics
The average spike activity recorded during memory saccades from all sites for each monkey is summarized in Figure 1.2 (c,d). The average firing rate aligned to the target acquire event (end of saccade) is shown. The activity from monkey R (Figure 1.2d) is exclusively post-saccadic. In monkey S, saccadic and memory period activity was also observed (Figure 1.2c), which could be due to the more anterior placement of the chamber. In monkey S, the dominant peak of activity still occurs after a delay following the target acquire event.
locations of the targets was used to confirm this observation. A very small number of neurons passed the significance test (p < 10^-3) for dependence of firing rate on task interval and target location (cue: 1; memory: 7; saccade: 6).
Shift in burst onset times
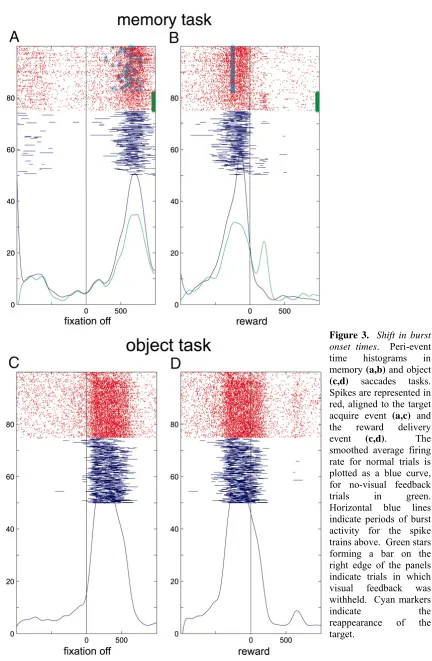
The post-saccadic burst in both trial types (a,b – memory, c,d – object) for one of these neurons in Figure 1.3 is illustrated with raster plots of spike traces aligned to the target acquire event (a,c) and the reward delivery (b,d). Bursts of activity identified with the burst detection algorithm (methods) are shown as horizontal blue lines beneath the spike trains. The bursts in the object task (c) begin at a time that could be related to saccade generation. However, the bursts of activity in the memory task (a) come substantially later, revealing that these bursts do not participate in the generation of a saccade, or at least not in the context of the memory saccade task. For this neuron the post-saccadic firing terminates with reward delivery. Other neurons (see Figure 1.5 for example) were also observed to terminate just before or soon after reward delivery.
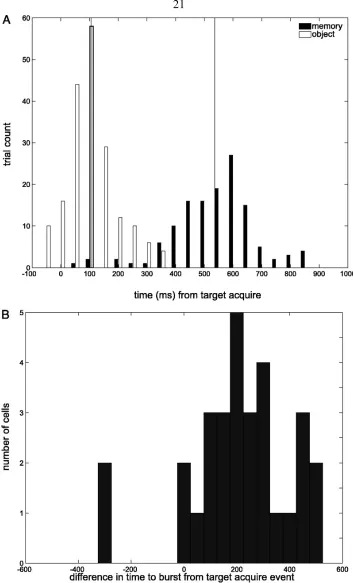
In Figure 1.4a, histograms for the time to burst relative to the target acquire event in each trial type are shown for the recording presented in Figure 1.3. There is a clear separation of these two groups (ANOVA, p << 10^-5). The mean bursting times relative to the target acquire event are 105 ms in the object task and 537 ms in the memory task. The bursts in both tasks terminate with the delivery of the reward after successful completion of the task.
Figure 3. Shift in burst onset times. Peri-event
time histograms in memory (a,b) and object
(c,d) saccades tasks.
Spikes are represented in red, aligned to the target acquire event (a,c) and
the reward delivery event (c,d). The
smoothed average firing rate for normal trials is plotted as a blue curve, for no-visual feedback trials in green. Horizontal blue lines indicate periods of burst activity for the spike trains above. Green stars forming a bar on the right edge of the panels indicate trials in which visual feedback was withheld. Cyan markers
indicate the reappearance of the
Figure 1.4. Histograms of burst onset times. a) Distribution of time to burst for each trial of the memory
(filled) and object (open) saccade tasks for the cell shown in Figure 3. Mean time to burst is: memory task: 537 ms, object task: 105 ms. Memory task data clusters to the right of the object task data. b)
tasks (N = 30) is plotted as a histogram in Figure 1.4b. In general, the bursting activity came later, relative to the target acquire event, in the memory task compared to the object-based task. Neurons in this category showed a mean shift in the onset time of the burst of 202 ms. This number is comparable to, though slightly less than, the amount of the time the animal was required to fixate the remembered target location in the memory task before the reappearance of the target (250 ms).
The onset time of the burst corresponded to the appearance of the visual feedback, which was immediate in the object-based task, but delayed in the memory-guided saccade task. In both cases the visual feedback could serve as a predictor of a reward. The hypothesis that bursting activity reflects an expectation of reward was then tested in a series of control experiments outlined below.
Bursting does not accompany non-rewarded target acquisitions
Bursting is not a visual response
Control trials of the memory-guided saccade task in which the visual feedback was withheld were run to test whether or not the bursting activity is related to the visual feedback signal. As shown in Figure 1.3 and again in Figure 1.5, removal of the visual feedback (indicated in the figures with the green bar composed of green stars) does not eliminate the onset of the bursting activity, though it may reduce the intensity or vary the onset time. Figure 1.5a shows an example in which the post-saccadic bursting activity was slightly extended by this control, though otherwise unchanged.
The bursting signal is therefore not indicating the reappearance of the target, though the visual reinforcement serves to sharpen and intensify the neural discharge. This control was run on 34 neurons, and 12 of them showed no significant difference in the mean firing rate from the time the target appeared (or should have appeared) until the end of the trial (ANOVA, p < 10^-5) in control vs. normal trials. Of the remaining neurons, many exhibited a temporal shift in their active periods or a decrease in firing, but only 1 showed an extinction of the bursting activity. This control shows that visual feedback could be dissociated from the reward delivery and the neural response remained.
Bursting properties in the absence of reward
Figure 1.5. Example response to control trials. (a) Withheld visual feedback control trials. All trials
shown are from the memory-saccade task. Green stars forming a bar on the edge of the panel indicate trials in which visual feedback was withheld. Smoothed average firing rates for normal trials are drawn in blue, and can be compared with the average firing rates during the withheld feedback trials drawn in green. (b) Withheld reward block of trials. All trials shown are from the memory-saccade task. Black
stars forming a bar slightly inset from the right edge of the panel indicate the successfully completed trials in which the reward was not delivered. Green stars forming a bar on the right edge of the panel indicate trials in which visual feedback was withheld. Only the spike trains from successfully completed trials are shown. Trials are arranged chronologically from top to bottom. Smoothed average firing rates for normal trials are drawn in blue and can be compared with the average firing rates during the withheld reward trials shown in black and the withheld feedback trials drawn in green. Cyan markers indicate the reappearance of the target.
(ANOVA, p < 10^-5) in control vs. normal trials. The vast majority (10) ceased firing during the pre-reward interval in the no-reward blocks, and the remaining neuron (of the 11 that were modulated) increased its firing rate after the reward period. An example neuron is shown in Figure 1.5b. The firing activity is gradually extinguished in the no reward block (black bar). In contrast, the activity during the no-visual feedback trials (green bar) has a less precise onset time, but does not extinguish. While the no-visual feedback trials show the effect of removing a predictor of reward, the no-reward blocks reveal the dynamic effects of the monkeys coming to understand that they should no longer expect a reward.
Unexpected reward trials
By removing the reward, the possibility that the bursting activity encoded an orofacial (e.g., licking) motor response was not eliminated. Every time the monkey expected a reward, he would presumably also plan a licking movement to acquire it. The monkey would often stop licking the juice tube in the blocks of trials in which the reward was turned off, and this would correspond to the termination of the bursting activity. Of course, if the monkey no longer expected to be rewarded for the eye movements, he also had no reason to lick the juice tube.
at the end of the fixation interval in normal trials. This first interval is the actual interval that the valve regulating the flow of reward was open. While running this control, 25 neurons with reward related activity were recorded, and 23 of these demonstrated no correlated activity in the unexpected juice delivery period. This control shows that the majority of the recorded neurons are not responsive to rewards when they are not expected, ruling out the possibility that the neural activity is attributable to motor commands required to obtain the reward, such as licking and swallowing.
To address the possibility that the neural activity reflected the monkey’s postural responses or attempted postural responses, or preparation for either, we recorded muscle activity in three muscles active during postural adjustments. We recorded EMG (see Methods) from left and right Latissimus dorsi and right Semitendinosus of Monkey S during the performance of both tasks. We observed that these muscles were active during trunk movements and leg movements. While there was activity recorded from these muscle groups during the execution of the task, we found that it was not temporally locked to reward expectation. These negative EMG results rule out the possibility that the monkey is consistently making postural adjustments in anticipation of the reward delivery.
DI S C U S S I O N
activity in the motor area SMA and (2) showing a shift of activity in time course based on a conditioned stimulus, the visual feedback that usually predicts the upcoming reward. Below we outline and justify our findings, compare our results with the results of other studies, and suggest a functional role for the representation of reward expectancy in SMA during eye movement tasks.
Onset of reward-expectancy signal corresponds to a conditioned stimulus
The activity generally started with the conditioned stimulus and stopped with the delivery of the reward. The conditioned stimulus in this context was visual feedback that occurred before reward delivery. In the memory task, the target reappeared after 250 ms of fixation on the remembered target location. This visual feedback helped ensure accuracy in the initial learning of the task, but also became a predictor of the upcoming reward. In the object task, the saccade target was visible, and so the monkey could be sure that he made a saccade to the target because he could see it. The onset time of the reward expectancy signal corresponded to the onset of the visual feedback in the tasks, either 250 ms after the correct saccade in the memory task or immediately during the correct saccade in the object task.
Control experiments establish the reward expectancy interpretation
In a series of control experiments, the argument was built that this activity reflects an expectation of reward. First, the bursting activity was dissociated from visual feedback, with the demonstration that visual feedback is not required for the neurons to discharge, though it regularizes the timing of the onset. Second, when the reward was removed for a block of trials, the reward expectancy activity gradually disappeared, showing that this activity represents a dynamic variable corresponding to the comprehension of a changed task condition. Finally, the possibility that the neural trace signified a licking plan or a detection of reward was ruled out since there was generally no response to unexpected reward delivery.
Reward related activity in the supplementary eye fields
Reward related neural signals have already been described in the SEF (Amador et al. 2000; Roesch and Olson 2003; Stuphorn et al. 2000). We found a reward expectancy signal in the SMA that appears very similar to types of activity found by Amador and colleagues and Stuphorn and colleagues.
Reward expectancy and reward prediction
The firing rates of RP neurons increase before the occurrence of a reward and then abruptly cease firing at reward delivery, just as we found in the bursting activity of many of the neurons in this study. Our results, combined with the results of Amador and colleagues, are therefore evidence that reward expectation can be found in both SMA and SEF, and likely throughout the DMFC. Our study adds to the findings of RP neurons by (1) recording neural responses during the unexpected delivery of reward and (2) submitting the monkey to short blocks of no-reward trials.
We choose to use the term reward expectancy since “expectancy” captures the way the neural activity continues until reward delivery. Furthermore, this designation separates itself from reward prediction nomenclature found in the dopamine neuron literature. To predict is to foretell on the basis of experience, while to expect is to await or look forward to the coming or occurrence. The reward prediction signal found in midbrain dopamine neurons and the reward expectancy signal in the DMFC likely play different roles in learning and goal-oriented behavior (see below).
Reward expectancy and reinforcement.
Reinforcement signals have been found in SEF using a countermanding saccade task (Stuphorn et al. 2000). The reinforcement neurons were shown to increase activation while awaiting reward. The term reward expectancy describes the function of this activity. Again, the results of this study are evidence that the reward expectation signal found in the SMA is also present in the SEF.
Reward expectancy versus enhanced motivation
The post-saccadic burst cannot be a correlate of motivation (Roesch and Olson 2003, 2004) simply because it comes after the behavior it would presumably motivate. Our use of the burst detection algorithm (Hanes et al. 1995; Thompson et al. 1996) establishes that this bursting activity comes in the post-saccadic interval.
In the Roesch and Olson study, the preferred direction of a neuron was first identified, and then a memory-guided saccade task was run to and away from the preferred direction of the cell. Since we rarely found neurons to be spatially-tuned, we may have been recording from different types of neurons in the SMA.
Interestingly, the authors noted that in areas in which reward effects were common, such as the SMAr, neurons “fired more strongly than reward-insensitive neurons during the period extending from the completion of the saccade to delivery of the ingested reward.” The authors did not think their paradigm capable of distinguishing between various interpretations of the significance of this effect, such as preparation and execution of liking movements or increased intensity of reward anticipation. In the present study, our control experiments show that the post-saccadic activity in SMA reflects reward expectation.
Reward expectancy versus attention
manipulated is expected value or attention, since these two states likely occur together and can be easily confounded. Likewise, studies examining attention may have recorded the effects of expected value (Maunsell 2004).
In the current study it is unlikely that the reward expectancy signal is actually an attention signal. The signal occurs after the task and is not spatially-tuned and thus cannot reflect attention to the saccade location. It also cannot reflect attention to the reward since there was no activity when the reward was presented unexpectedly – novelty is a powerful attractor of attention.
Reward signals and reinforcement learning algorithms
A reinforcement learning algorithm (Sutton and Barto 1988) has been proposed to account for different reward-related signals that have been found in the brain, such as the error of reward prediction in midbrain dopamine neurons (Schultz et al. 1997). The prediction error signal is widely recognized as evidence for the implementation of a reinforcement learning algorithm in the brain. For example, the prediction error can serve to update action value estimates so that the animal can have accurate estimates of the reward that can be expected for an action. In this formalism, the expected value, V, is updated after every trial according to the experienced reward by the equation:
Vt+1 = Vt + α(Rt – Vt), (1)
t+1. In this formulation the time steps are individual trials, and the signal that corresponds to the error of reward prediction found in dopamine neurons (Schultz et al. 1997) is the term in the parentheses, Rt – Vt. The action value signal, V, that we are describing would not be used instead of a prediction error signal, R-V. Rather, both signals are supposed components of a larger reinforcement learning mechanism.
The dynamics of the reward expectancy signal in SMA corresponds to the dynamics of the expected value of the action, V. Specifically, this algorithm captures the way the post-saccadic firing activity in the SMA gradually dissipates in no-reward blocks. When the reward, R, is zero for a series of trials, the equation above will diminish the expected value of the action, V, until it reaches the new value of the reward, 0. The learning rate parameter, α, determines how quickly the estimate of the expected value approaches the new value. This equation also describes how the neural activity will return to normal firing when the reward is again delivered as usual.
Functional significance of reward expectancy in DMFC – a signal to guide learning
As in neural network models of reinforcement learning (Mazzoni et al. 1991; Suri and Schultz 1999), the reward signal found in DMFC could be used to train other parts of cortex to perform visuospatial tasks requiring arbitrary sensorimotor transformations. The reward expectancy signal found in the SEF (Amador et al. 2000; Stuphorn et al. 2000) is in position to shape future oculomotor behavior through its connections with the frontal eye fields (FEF) (Schall et al. 1993) and the superior colliculus (SC) (Fries 1984).
an internal model with an expected sensory outcome for a behavior, in this case the conditioned stimulus. This model can be matched with a reward signal and refined as often as rewards are delivered or unexpectedly withheld. Second, the reward expectancy signal comes at a time that is more proximal to the behaviors which earned the reward, and thus may be able to reinforce the high level motor signals in DMFC related to those behaviors.
Usefulness of reward expectancy in SMA during an eye movement task
RE F E R E N C E S
Amador N, Schlag-Rey M and Schlag J. Reward-Predicting and Reward-Detecting Neuronal Activity in the Primate Supplementary Eye Field. J Neurophysiol 84:
2166-2170, 2000.
Barraclough DJ, Conroy ML and Lee D. Prefrontal cortex and decision making in a mixed-strategy game. Nat Neurosci 7: 404-410, 2004.
Campos M, Breznen B and Andersen RA. Reward expectancy in dorsomedial frontal cortex of the macaque monkey. Soc. Neurosci. Abstr 187.183, 2003.
Chen L and Wise S. Neuronal activity in the supplementary eye field during acquisition of conditional oculomotor associations. J Neurophysiol 73: 1101-1121, 1995.
Cox RW. AFNI: Software for analysis and visualization of functional magnetic resonance neuroimages. Computers and Biomedical Research 29: 162-173, 1996.
Cromwell HC and Schultz W. Effects of Expectations for Different Reward Magnitudes on Neuronal Activity in Primate Striatum. J Neurophysiol 89: 2823-2838, 2003.
Fries W. Cortical projections to the superior colliculus in the macaque monkey: A retrograde study using horseradish peroxidase. J. Comp. Neurol 230: 55-76, 1984.
Fujii N, Mushiake H, Tamai M and J T. Microstimulation of the supplementary eye field during saccade preparation. Neuroreport 6: 2565-2568, 1995.
Fujii N, Mushiake H and Tanji J. Distribution of Eye- and Arm-Movement-Related Neuronal Activity in the SEF and in the SMA and Pre-SMA of Monkeys. J
Hanes D, Thompson K and Schall J. Relationship of presaccadic activity in frontal eye field and supplementary eye field to saccade initiation in macaque: Poisson spike train analysis. Exp Brain Res 103: 85-96, 1995.
Hassani OK, Cromwell HC and Schultz W. Influence of Expectation of Different Rewards on Behavior-Related Neuronal Activity in the Striatum. J Neurophysiol
85: 2477-2489, 2001.
Hikosaka K and Watanabe M. Delay Activity of Orbital and Lateral Prefrontal Neurons of the Monkey Varying with Different Rewards. Cereb. Cortex 10: 263-271,
2000.
Ikeda T and Hikosaka O. Reward-dependent gain and bias of visual responses in primate superior colliculus. Neuron 39: 693-700, 2003.
Kobayashi S, Lauwereyns J, Koizumi M, Sakagami M and Hikosaka O. Influence of Reward Expectation on Visuospatial Processing in Macaque Lateral Prefrontal Cortex. J Neurophysiol 87: 1488-1498, 2002.
Luppino G, Matelli M, Camarda R and G R. Corticocortical connections of area F3 (SMA-proper) and area F6 (pre-SMA) in the macaque monkey. J Comp Neurol
338: 114-140, 1993.
Luppino G, Matelli M, Camarda R, Gallese V and Rizzolatti G. Multiple representations of body movements in mesial area 6 and the adjacent cingulate cortex: an intracortical microstimulation study in the macaque monkey. J Comp Neurol 311:
463-482, 1991.
Matsumoto K, Suzuki W and Tanaka K. Neuronal Correlates of Goal-Based Motor Selection in the Prefrontal Cortex. Science 301: 229-232, 2003.
Matsuzaka Y, Aizawa H and Tanji J. A motor area rostral to the supplementary motor area (presupplementary motor area) in the monkey: neuronal activity during a learned motor task. J Neurophysiol 68: 653-662, 1992.
Matsuzaka Y and Tanji J. Changing directions of forthcoming arm movements: neuronal activity in the presupplementary and supplementary motor area of monkey cerebral cortex. J Neurophysiol 76: 2327-2342, 1996.
Maunsell JHR. Neuronal representations of cognitive state: reward or attention? Trends
in Cognitive Sciences 8: 261-265, 2004.
Mazzoni P, Andersen RA and Jordan MI. A more biologically plausible learning rule that backpropagation applied to a network model of cortical area 7a. Cereb. Cortex 1:
293-307, 1991.
Mitz A and Wise S. The somatotopic organization of the supplementary motor area: intracortical microstimulation mapping. J Neurosci 7: 1010-1021, 1987.
Musallam S, Corneil BD, Greger B, Scherberger H and Andersen RA. Cognitive Control Signals for Neural Prosthetics. Science 305: 258-262, 2004.
Nakamura K, Sakai K and Hikosaka O. Neuronal Activity in Medial Frontal Cortex During Learning of Sequential Procedures. J Neurophysiol 80: 2671-2687, 1998.
Platt ML and Glimcher PW. Neural correlates of decision variables in parietal cortex.
Nature 400: 233-238, 1999.
Roesch MR and Olson CR. Impact of Expected Reward on Neuronal Activity in Prefrontal Cortex, Frontal and Supplementary Eye Fields and Premotor Cortex. J
Neurophysiol 90: 1766-1789, 2003.
Roesch MR and Olson CR. Neuronal Activity Related to Reward Value and Motivation in Primate Frontal Cortex. Science 304: 307-310, 2004.
Russo G and Bruce C. Effect of eye position within the orbit on electrically elicited saccadic eye movements: a comparison of the macaque monkey's frontal and supplementary eye fields. J Neurophysiol 69: 800-818, 1993.
Satoh T, Nakai S, Sato T and Kimura M. Correlated Coding of Motivation and Outcome of Decision by Dopamine Neurons. J. Neurosci 23: 9913-9923, 2003.
Schall JD, Morel A and Kaas JH. Topography of supplementary eye field afferents to frontal eye field in macaque: Implications for mapping between saccade coordinate systems. Visual Neurosci 10: 385-393, 1993.
Schlag J and Schlag-Rey M. Evidence for a supplementary eye field. J Neurophysiol 57:
179-200, 1987.
Schlag J and Schlag-Rey M. Unit activity related to spontaneous saccades in frontal dorsomedial cortex of monkey. Exp Brain Res 58: 208-211, 1985.
Schultz W, Dayan P and Montague PR. A Neural Substrate of Prediction and Reward.
Science 275: 1593-1599, 1997.
Shima K and Tanji J. Neuronal Activity in the Supplementary and Presupplementary Motor Areas for Temporal Organization of Multiple Movements. J Neurophysiol
84: 2148-2160, 2000.
Stuphorn V, Taylor T and Schall J. Performance monitoring by the supplementary eye field. Nature 408: 857-860, 2000.
Sugrue LP, Corrado GS and Newsome WT. Matching Behavior and the Representation of Value in the Parietal Cortex. Science 304: 1782-1787, 2004.
Sommer MMA, and Tehovnik EEJ. Reversible inactivation of macaque dorsomedial frontal cortex: effects on saccades and fixations. Experimental brain research
124: 429-446, 1999.
Suri RE and Schultz W. A neural network model with dopamine-like reinforcement signal that learns a spatial delayed response task. Neuroscience 91: 871-890,
1999.
Sutton RS and Barto AG. Reinforcement Learning: An Introduction. Cambridge, Mass:
MIT Press, 1988.
Tehovnik E and Sommer M. Compensatory saccades made to remembered targets following orbital displacement by electrically stimulating the dorsomedial frontal cortex or frontal eye fields of primates. Brain Res 727: 221-224, 1996.
Tremblay L, Hollerman JR and Schultz W. Modifications of Reward Expectation-Related Neuronal Activity During Learning in Primate Striatum. J Neurophysiol 80:
964-977, 1998.
Tremblay L and Schultz W. Reward-Related Neuronal Activity During Go-Nogo Task Performance in Primate Orbitofrontal Cortex. J Neurophysiol 83: 1864-1876,
2000.
Watanabe K, Lauwereyns J and Hikosaka O. Neural Correlates of Rewarded and Unrewarded Eye Movements in the Primate Caudate Nucleus. J. Neurosci 23:
10052-10057, 2003.
Watanabe M. Reward expectancy in primate prefrontal neurons. Nature 382: 629-632,
CHAPTER II
NEURAL REPRESENTATION OF SEQUENTIAL STATES
WITHIN AN INSTRUCTED TASK
AB S T R A C T
entirety of responses from SEF was used to decode the current temporal position within the context of the task. Since LIP neurons were found to respond similarly when encoding an eye movement plan (saccade period) or the location of brightly flashed stimulus (cue period), the temporal information provided from SEF could be used to imply the significance of the spatial representation found in LIP.
IN T R O D U C T I O N
(Lauwereyns et al., 2002b); expectation of reward itself (Amador et al., 2000; Stuphorn et al., 2000; Campos et al., 2005); behavioral biases for a particular movement (Mauritz and Wise, 1986; Hikosaka et al., 1989; Coe et al., 2002; Takikawa et al., 2002; Watanabe and Hikosaka, 2005) to attenuate reaction-time delays (MacKay and Crammond, 1987); the readiness to produce or cancel a movement (Libet et al., 1983) which has similarly been described as the beginnings of a proactive triggering process (Maimon and Assad, 2006); the inhibition of reflexive movements (Guitton et al., 1985); and tracking behavior, as in smooth pursuit (Heinen and Liu, 1997).
2005), and event-detecting activity in the claustrum preceeding all movements in a non-selective manner (Shima et al., 1996). Results such as these have been the basis of the controversial hypothesis that the prefrontal cortex is primarily engaged in the temporal structuring of behavior (Fuster, 1989).
The two cortical oculomotor areas of interest in this report, LIP and SEF, have both been shown to participate in the representation of behavioral timing. Anatomical connections suggest that SEF is directly involved in specifying when a saccade should occur (Shook et al., 1990), and SEF microstimulation can trigger an already planned movement to any direction (Missal and Heinen, 2004). Neurons in SEF without an apparent directional preference have been termed omni-directional (Chen and Wise, 1996), and such a signal may be required to trigger eye movements without regard for their direction. The timing of the microstimulation, however, has to be in the appropriate interval, otherwise it will delay the reaction time and instead facilitate fixation (Isoda, 2005), which cautions that the temporal responsibilities of SEF are not limited to providing a trigger for movement, but may also enhance fixation behavior when that is appropriate. Further evidence for the representation of time in SEF includes the effect of cooling of premotor cortex in monkeys, including SEF, which renders monkeys unable to perform a movement at the instructed time (Sasaki and Gemba, 1986), and disruptive stimulation in SEF that leads to temporal re-ordering of eye movements of a sequence, even though target endpoints remain accurate (Histed and Miller, 2006).
disruptions resulting from SEF inactivation, temporary LIP inactivation results in deficits of saccade metrics (Li and Andersen, 2001). LIP activity, however, has been shown to correlate with eye movement start times (Ipata et al., 2006) and exhibits a slight anticipatory rise before predictable visual cue presentations (Colby et al., 1996), revealing access to timing information. Recent studies have further proposed that LIP neurons might themselves represent the passage of time during motor planning by gradually enhancing or suppressing the motor plans for which elapsed time is an instructive cue (Leon and Shadlen, 2003; Janssen and Shadlen, 2005).
In this study we characterize the encoding of populations of neurons in LIP and SEF with respect to spatial and behavioral state representations, while the monkeys performed a memory-guided saccade task. To assess and compare the contribution each area makes to the spatial representation of the target, as well as to the representation of the current behavioral state within the context of the task sequence, we then characterize the performance of a decoding algorithm on the spatial position of the target, or separately for the temporal interval. Recording from these two oculomotor structures during the performance of the same task, we are able to better understand the ways in which the different areas are specialized and complementary.
ME T H O D S
procedures were in accordance with the California Institute of Technology Institutional Animal Care and Use Committee.
Monkeys were seated in a dimly lit room, 34 cm from a tangent LCD monitor. Stimuli were presented with 800x600 resolution and a refresh rate of 75 Hz using a custom built software display client with OpenGL. Task logic was controlled by National Instruments real time LabView software.
Eye movement monitoring
Eye movements were monitored with an infrared oculometer (ISCAN Inc.). A high-speed camera was mounted on a wooden frame above the monkey’s head and, along with an infra-red source, directed into an infra-red reflective hot-mirror held fixed at a 45 degree angle just in front of the monkey’s eyes. A trapezoidal notch was cut from the mirror so that it could be placed close around the monkey’s nose. For both monkeys the left eye was monitored. Facial whiskers and brow hairs around the left eye were clipped regularly to improve the quality of the eye-tracking image.
Training methods
the same location as the cue, and the monkey was rewarded if he made a saccade to the target in a short period of time (within ~700 ms). If the monkey broke fixation during the briefly flashed cue, the trial was aborted, and the monkey had to wait 1.5-2 sec until the next trial started. In this way, the monkey learned to withhold any eye movements until the fixation point extinguished. Over the course of 2-3 weeks, the cue flash duration was extended in small increments to 250 ms and was presented 500 – 800 ms after the start of fixation. Finally, the target stimulus was not presented immediately after the fixation point extinguished, but was instead presented just after the monkey had moved his eyes to where the target would appear. The monkeys had learned this final step easily, indicating to us that they had made the association that the cue stimulus instructed the future eye movement. The timing of the target reappearance was extended to occur 250 ms after successfully fixating the remembered cue location. The monkey continued training until task performance reliably reached about 85%, at which point the chamber placement surgery was performed.
MR Imaging
recordable area of a chamber is 14 mm in diameter, and each area of interest is typically 4 mm in diameter, so there is some room for error. Further, the SEF of both hemispheres is sometimes accessible from one chamber placed directly over the midline (0mm, 24mm), and we placed the frontal chamber as such. The anatomical MRI images of monkey M confirmed that these typical stereotaxic positions would be suitable for the chamber placement surgery.
The MRI scan was performed after the chamber placement surgery of monkey L, and the standard sterotaxic coordinates were used to locate the areas of interest during the surgery. During the post-operative MRI, a high-contrast agent (gallidium) was inserted into the chamber, which appeared brightly just above the dura in the MR image, with clearly defined chamber walls. With these images the satisfactory placement of the chambers could be verified and the precise locations of subsequent electrode penetrations could be planned.
Following the chamber placement surgery, exploratory electrode penetrations were performed to map out the cortical areas accessible to the chambers. For monkey M, for whom the MRI was performed prior to the chamber surgery, we had only a rough estimate of the cortical structures beneath the exposed dura.
Chamber Mapping and Electrical Stimulation
added to the exploratory recording and somatosensory examination techniques. A BAK instruments stimulator was used to deliver biphasic currents at 330 Hz of typically less than 200 µA in 100-500 ms trains through the recording electrodes. In the SEF, but not in adjacent regions, eye movements can be elicited at a low threshold (<50 uA). In addition, there are body movement representations just medial to the SEF (in the supplementary and pre-supplemntary motor areas) in which electrical microstimulation will evoke stereotyped movements on the limb, torso, and face. The left SEF of monkey M was found readily within a couple of days. Guided by the post-operative MRIs of monkey L, we were able to find both areas of interest in just two penetrations for each chamber. We did not confirm the location of SEF with electrical microstimulation, since the signals that we recorded we convincing and the location was corroborated by the MR images.
Behavioral task
target positions
Figure 2.1. Time course of
oculomotor task. The temporal
progression is shown in successive panels from top left to bottom right. The monkey is required to acquire a central fixation point at the start of the trial. After a variable delay (500-800 ms), a cue is briefly flashed (250 ms) at one of 43 targets in the periphery. The possible targets cover the entire visual field out to 15 degrees (inset). Following a hold interval the fixation point is extinguished and the monkey is required to saccade to the remembered target location and fixate there. After 250 ms the target reappears, and then following an additional 250 ms fixation, the animal is rewarded with a drop of juice.
Recording Procedure
Neurons were accessed on vertical penetrations with glass coated platinum-iridium electrodes (Fred Haer Co.) or Thomas Recording electrodes (ThomasRecording Gmbh). The electrodes were advanced with a Narishige or Thomas microdrive system through a blunt stainless steel guide tube pressed against the dura for SEF recordings or a sharp stainless steel guidetube puncturing the dura and driven down 1 mm for LIP recordings. Neurons were generally found 1-3mm beneath the exterior of the dura for SEF recordings and 5-9 mm beneath the level of the dura for LIP recordings.
Neuron classification analysis
To standardize the spike trains for each trial, spike trains were aligned to four different events that occurred at varying intervals, and these four spike trains were then merged around the time of the shortest interval between each event. These events were fixation appearance, cue appearance, fixation point disappearance (go signal), and the visual feedback signal. The spike trains extended 400 ms before the fixation point on event until 350 ms afterwards. This was followed by the spike train data from the period 225 ms before the cue appearance event until 575 ms afterwards, then 350 ms before the fixation off event until 400 afterwards, and finally, 200 ms before the target reappearance until 500 ms afterwards.
Using these merged spike trains, firing activity during different states and events were then compared to baseline firing levels to determine if there were significant activations or depressions. The baseline firing rate was defined as the total number of spikes in the merged spike trains divided by the total duration. This calculation of the baseline firing rate does not include inter-trial intervals, and importantly, does not assume that any particular interval is a common resting interval for all of the neurons. The definitions of all of the state and event intervals incorporated the known latencies of responses in LIP and SEF, which are both greater than 40 ms (Schall, 1991; Bisley et al., 2004), and all of the state and event definitions cover the entire duration of the time-standardized trials, with short (40 ms) gaps between each state and subsequent event, to allow for variability in onset latencies. The pre-trial state was defined as the 400 ms prior
after the appearance of the fixation point. The pre-cue state was defined as the interval
from the end of the fixation point on event until 30 ms after the cue presentation. The cue
on event was defined as the 150 ms interval starting 70 ms after the presentation of the
cue. The memory state was defined as the interval from the end of the cue on event until
30 ms after the fixation point disappearance (the signal for the monkey to make the saccade). The saccade event was defined as the 300 ms interval starting 70 ms after the
fixation point disappearance (allowing time for the execution of the saccade). The
post-saccade state was defined as the interval from the end of the saccade event until 30 ms
after reappearance of the target. The visual feedback event was defined as the 150 ms
starting 70 ms after the reappearance of the target. Finally, the reward state was defined
as the time from the end of the visual feedback event until 50 ms after the end of the delivery of reward. Significant increases or decreases in any of these intervals was defined as the likelihood of the firing rate in that interval, assuming a Poisson distribution and taking the baseline firing rate as the mean (p < 0.05). In addition to calculating activations and suppressions in entire event or state intervals, tests were performed on smoothed firing rates at 10 ms intervals to provide a continuous measure of significant activations.
same intervals, such that the activity at the end is not characterized as anticipatory. Event detection activity was defined the same as state encoding activity, but limited to the four previously defined event intervals, and anticipatory activity was not tested in the event periods. Spatially-tuned activity was defined with respect to the goodness-of-fit of the firing rates to a two dimensional Gaussian model of the response field, as described below.
Regression analysis to model contributions of target or distractor location to neuronal
activity
We used standard quantitative models implemented with MATLAB to evaluate the dependence of firing rate on cue or distractor position (Campos et al. 2006; Draper and Smith, 1981; Press et al.; 2002, Zar, 1974). The spikes trains were smoothed by convolving with a Gaussian (sigma = 50 ms) to estimate the instantaneous firing rate for individual trials. An initial estimate of the center of the response field (b3, b4) was
calculated as the vector average of all of trials with associated firing rates that were >50% of the maximum firing rate. Initial estimates of the remaining parameters were chosen arbitrarily: b0 = 100, b1 = 4, b2 = 3. The firing rates were then regressed on a
two-dimensional Gaussian using the following equation:
)
)
(
)
(
exp(
2 2 2 4 2 3 1 0b
b
y
b
x
b
b
where (x,y) is the position of the target. The regression was computed, and the values for the parameters were stored along with the p and r2 values describing the goodness-of-fit for the regressions.
Nearest neighbor decode algorithm
The following method is adapted from a recent study, and the following description closely resembles the method previously published (Quiroga et al. 2006). Each data set contained at least 129 trials (43 targets x 3 repetitions). From these merged spike trains of 3000 ms duration, varying window sizes were used to count spiking events to then be used as input into the decoding algorithm. The 75 ms time window performed better than window sizes that were slightly larger or smaller, and so 75 ms window sizes are used in all of the temporal decode results presented. Alternately, spiking events from each of the 9 states and events was used as input for spatial position decoding.
Cells were considered simultaneously recorded in the sense that, for each of three trials to each of the 43 target positions, the responses of all cells were grouped together as a single trial with m values (in which m is the number of cells). Trials were considered as
points in an m-dimensional space, each coordinate representing the mean firing rate for
each of the m cells. One at a time, each of these 129 trials was decoded based on the
trial was recorded, the neuron contributed to the decode of other directions, but not to decodes of the directions with only one recorded trial.
For the temporal decode, each trial was decoded at every 75 ms from the beginning to the end of the trial. Firing rates from the left out trial were compared with mean firing rates collapsed across all directions in the same interval and all other intervals. The time interval of the nearest neighbor was assigned as the decoded time interval of the left-out trial. For the spatial decode, the left-out trial was compared with the 128 other “simultaneously” recorded trials using the same temporal window in the other trials, and the mean firing rate was calculated individually for each cue or distractor position. The nearest neighbor was identified, and the decoded target was assigned as the same as that of the nearest neighbor.
RE S U L T S
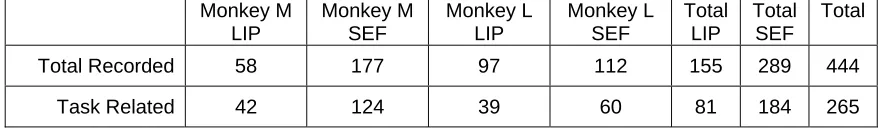
[image:63.612.100.539.605.669.2]The neuronal sample presented in this report consists of 444 neurons recorded from two monkeys while the monkeys performed memory-guided saccades (Figure 2.1). There were 289 neurons recorded from SEF and 155 recorded from LIP (see Table 2.1 for further details).
Table 2.1. Cell counts for the neuronal database. Detail of the number of recorded and task related
neurons, broken down by monkey and cortical area as well as combined.
Monkey M LIP Monkey M SEF Monkey L LIP Monkey L SEF Total LIP Total SEF Total
Total Recorded 58 177 97 112 155 289 444
Non-spatial and spatially-tuned neural activations
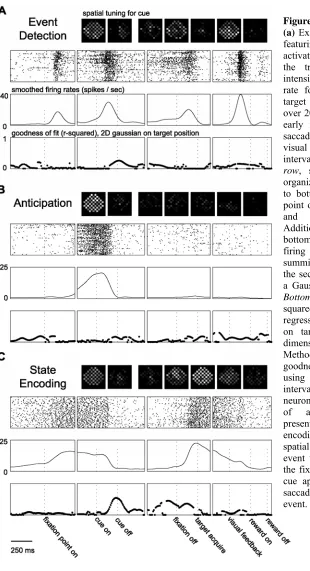
Figure 2.2. Example SEF neurons.
(a) Example event detection neuron
featuring non-spatial transient activations at many events within the trial. Top row, firing rate
intensity plots showing mean firing rate for all correct trials to each target position, arranged spatially, over 200 ms intervals in the cue on, early memory, late memory, pre-saccadic, pre-saccadic, post-pre-saccadic, visual feedback, and reward intervals, from left to right. Second row, spike trains for each trial,
organized chronologically from top to bottom, aligned on the fixation point on, cue on, fixation point off, and visual feedback events. Additional event times are labeled at bottom. Third row, smoothed spike
firing rates in time, estimated by summing the spike train rasters in the second row and smoothing with a Gaussian filter (sigma = 50 ms).
Bottom row, goodness-of-fit
(r-squared) values for non-linear regressions of smoothed firing rates on target position using a two-dimensional Gaussian model (see Methods). Each point represents the goodness-of-fit for a regression using firing rates taken at 10 ms intervals. (b) Example anticipation
neuron featuring non-spatial buildup of activity before the cue presentation. (c) Example state
encoding neuron featuring a non-spatial tonic activation from one event to another, in this case from the fixation point on event until the cue appearance and also from the saccade until the visual feedback event.