2014
Individual differences in restrained eaters
Kelly MooreIowa State University
Follow this and additional works at:https://lib.dr.iastate.edu/etd
Part of theAdvertising and Promotion Management Commons, and theMarketing Commons
This Dissertation is brought to you for free and open access by the Iowa State University Capstones, Theses and Dissertations at Iowa State University Digital Repository. It has been accepted for inclusion in Graduate Theses and Dissertations by an authorized administrator of Iowa State University Digital Repository. For more information, please [email protected].
Recommended Citation
Individual differences in restrained eaters
by
Kelly Moore
A dissertation submitted to the graduate faculty
in partial fulfillment of the requirements for the degree of
DOCTOR OF PHILOSOPHY
Major: Business and Technology (Specialization - Marketing)
Program of Study Committee: Russell Laczniak, Co-Major Professor
Terry Childers, Co-Major Professor Doug Walker
Robert West James McElroy
Iowa State University
Ames, Iowa
2014
TABLE OF CONTENTS
Page
ACKNOWLEDGEMENTS ... iv
ABSTRACT………. ... vi
CHAPTER 1 INTRODUCTION ... 1
Restrained Eating ... 2
Boundary Model ... 2
Cue Reactivity Theory ... 4
Personal Characteristics ... 5
Situational Characteristics ... 5
Purpose ... 6
Consumer Emotional Intelligence... 7
Mindful Eating ... 7
Desire and Savoring ... 8
Research Study... 10
Procedure ... 10
Summary ... 11
CHAPTER 2 LITERATURE REVIEW ... 13
Restraint Theory... 13
Situational Characteristics ... 17
Personal Characteristics ... 21
Impulsivity ... 21
Personality Traits ... 24
Summary ... 25
CHAPTER 3 HYPOTHESES ... 27
Impulsivity ... 27
Consumer Emotional Intelligence... 29
Health Information Presentation ... 30
Eye Tracking ... 38
Self-Regulation and Mindful Eating ... 40
Satiation ... 41
Mindful Eating ... 42
Page
CHAPTER 4 METHOD ... 50
Study 1 ... 50
Sample ... 50
Procedure ... 51
Materials ... 51
Measures ... 51
Restraint Scale ... 51
Table 1 ... 53
Table 2 ... 55
Table 3 ... 56
Table 4 ... 57
Consumer Emotional Intelligence Scale ... 61
Table 5 ... 61
Barrett Impulsivity Scale ... 61
Body Mass Index ... 64
Daily Caloric Value ... 64
Unhealthy Snack Selection ... 64
CHAPTER 5 STUDY 1 RESULTS ... 65
Overall Results of Regression ... 65
Table 6 ... 66
Table 7 ... 67
Discussion ... 70
CHAPTER 6 STUDY 2 METHOD ... 73
Sample ... 73
Measures ... 74
Materials ... 75
Procedure ... 75
CHAPTER 7 STUDY 2 RESULTS ... 77
Results ... 77
Table 8 ... 79
Discussion ... 79
CHAPTER 8 STUDY 3 METHOD ... 81
Materials ... 82
Cultivating Mindfulness... 82
Cultivating Mindful Eating ... 83
Cultivating Emotional Balance ... 84
Cultivating Self-Acceptance ... 84
[image:4.612.106.541.73.757.2] [image:4.612.111.522.80.331.2]Table 9 ... 87
CHAPTER 9 STUDY 3 RESULTS ... 89
Results ... 89
Table 10 ... 90
Table 11 ... 91
Table 12 ... 92
Discussion ... 92
CHAPTER 10 DISCUSSION ... 93
Limitations and Future Research ... 95
REFERENCES ... 98
APPENDIX A. MENU ... 112
APPENDIX B. STUDY 1 QUESTIONNAIRE ... 115
APPENDIX C. STUDY 1 REGRESSION RESULTS FOR EATING INVENTORY AND DEBQ MODELS ... 127
APPENDIX D. STUDY 1 SIMPLE SLOPES ANALYSIS – INTERACTION EFFECTS FOR DAILY CALORIC INTAKE………... 128
APPENDIX E. STUDY 2 QUESTIONNAIRE ... 129
APPENDIX F. STUDY 2 EYE TRACKER KEY PERFORMANCE INDICATORS ... 141
APPENDIX G. STUDY 2 EXPERIMENTAL MANIPULATION ... 143
APPENDIX H. STUDY 2 ALTERNATE REGRESSION RESULTS ... 144
APPENDIX I. MINDFULNESS INTERVENTION CLASS SCHEDULE... 145
APPENDIX J. STUDY 3 QUESTIONNAIRE ... 146
APPENDIX K. MINDFULNESS TRAINING CLASS SCHEDULE ... 158
ACKNOWLEDGEMENTS
I would like to thank Russ Laczniak for his dedication and support during this
effort and my co-advisor, Terry Childers. I’m indebted to Doug Walker for his statistical
prowess and kind heart. Further, Jim McElroy has been the best mentor and co-author a
person could ask for. I would also like to thank my other committee members Rob West
and Doug Bonnet for their guidance and support throughout the course of this research.
I would like to extend gratitude to the Iowa State University students who
participated in my research. Additionally, I want to express my appreciation for the
department staff and my colleagues, especially Jenny Lin.
Finally, I’m grateful for tremendous family support during this program. My
parents, Merritt and Jo Krause, and my brother, Jason, have been by my side every step
of the way. I’m indebted to my husband, Zach, and my daughter, Zoey, who have
ABSTRACT
This research examines three major research questions: 1) the role of impulsivity
and emotional intelligence in restrained eaters’ behaviors, 2) if menu calorie labeling will
be utilized by restrained eaters to make healthier eating decisions, and 3) if mindful
eating can effectively alter a restrained eater’s behavior.
Specifically study one examines the role of impulsivity and emotional
intelligence in restrained eaters’ behavior. Previous research has found restrained eaters
to have less healthy eating behaviors than unrestrained eaters. Emotional intelligence has
been shown to result in healthier eating behaviors, whereas impulsivity negatively
impacts eating behavior.
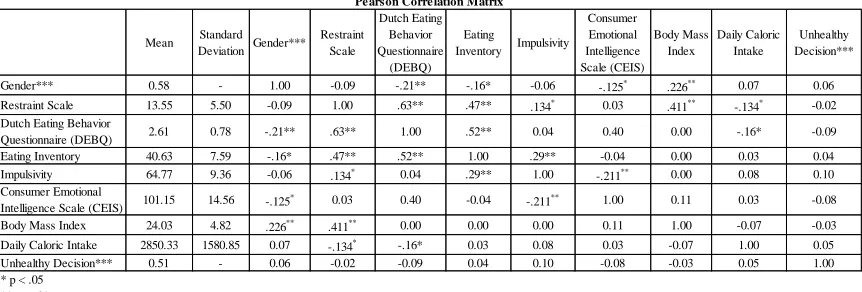
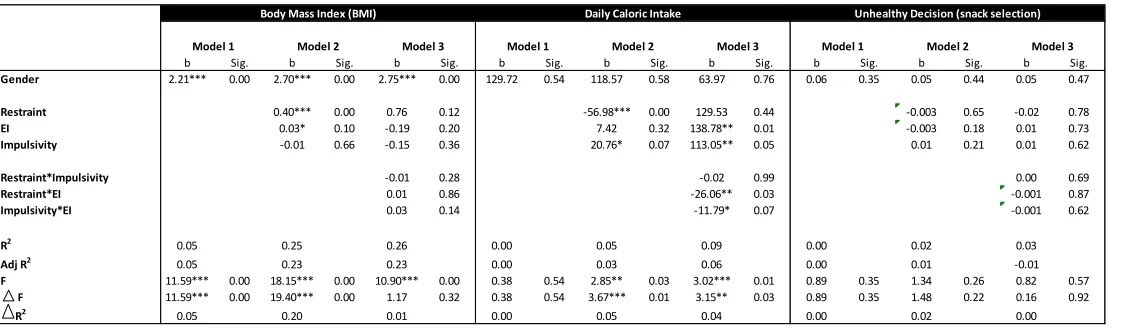
Results show impulsivity does not moderate the relationship between restraint and
unhealthy eating behaviors in this data. More restraint was associated with higher BMI.
Restrained eaters are characterized as having episodes of disinhibited eating, which result
in weight gain despite constant dieting. Increased emotional intelligence was associated
with higher BMI and a higher number of calories selected. Further, increased impulsivity
was associated with a higher number of calories selected as well.
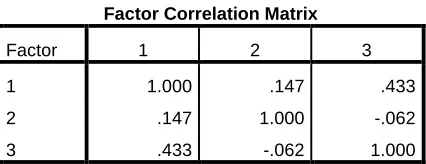
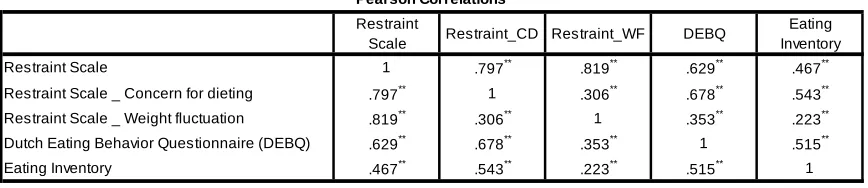
Results also indicate that the three commonly used measures of restraint yielded
similar results when used separately in the model, indicating they measure the same
construct. The Herman and Polivy (1980) restraint scale showed two interaction effects
that the Eating Inventory (formerly Three Factor Eating Questionnaire) and the Dutch
Study two investigates whether new Affordable Care Act legislation requiring
restaurants to provide menu calorie labeling will be effective in reducing the number of
calories restrained eaters consume. This legislation has spurred numerous studies on this
topic recently. Study two is unique, however, because it uses an eye tracking
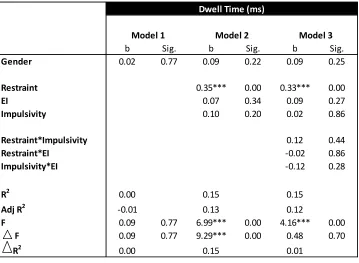
methodology to investigate this relationship. In this research, restrained eaters were
found to dwell on menu calorie information significantly longer than unrestrained eaters.
Finally, study three explores a mindful eating intervention as a method by which
to train restrained eaters to make healthier decisions. Recent psychology literature has
found mindfulness to be an effective treatment method for numerous disorders, including
eating disorders. Results from food diaries completed by participants show restrained
CHAPTER 1
OVERVIEW
Introduction
According to the U.S. Center for Disease Control and Prevention, almost
two-thirds of Americans are overweight or heavier. Obesity is a dangerous condition that
affects over one-third of adult Americans (78 million people) (Chan, 2012) and
approximately 17% of children (ages 2-19) (Ogden, Carroll, Kit, and Flegal, 2012).
The costs of obesity are high. Obesity increases an individual’s risk for serious
health problems, including type 2 diabetes, heart disease, stroke, and some types of
cancer (Wickens, 2005). Moreover, average annual medical costs for obese individuals
were $1,429 higher in 2008 than for normal weight individuals (Chan, 2012; Finkelstein,
Trogdon, Cohen, and Dietz, 2009).
Obesity rates doubled for adults and tripled for children during the period of
1980-2008, despite legislation and numerous programs to reverse this alarming trend.
Recently, as part of the Affordable Care Act of 2010, Congress passed a provision that
required restaurants that are part of a chain with 20 or more locations to provide calorie
and other nutrition information for standard menu items. One of the purposes of this
study is to examine whether the presence of caloric information will change individual’s
eating behavior.
Individuals frequently attempt to combat obesity by dieting, or trying to control
what they eat. We call people who are chronic dieters “restrained eaters,” discussed in
Restrained Eating
Herman and Polivy (1980) characterized restraint as the cognitively mediated
effort to combat the urge to eat. “Restrained eating is a pattern of chronic dietary
restriction interspersed with episodes of disinhibited overeating" (Blechert, Feige,
Hajcak, and Tuschen-Caffier, 2009, p. 262). In further explanation, Scott et al. (2008, p.
392) claimed restrained eaters have “an emotional response to foods that may cause them
to react in a more impulsive manner than unrestrained eaters.” Restrained eaters try to
restrict their food intake (Nederkoorn and Jansen, 2002). Laessle, Tuschl, Kotthaus, and
Prike (1989, p. 504) define dietary restraint as “the intention to diet to achieve or
maintain a desire weight.”
Eating research in the field of psychology has formed two distinct schools of
thought. One line of research has characterized eating as mainly physiological, whereas
the other line of research has focused on non-physiological factors (Herman and Polivy,
1983). The prior line of research (physiological) assumes eating is a biological activity.
An individual eats when they are hungry and stops eating when they are full. These
events are controlled by signals from the brain. The latter line of research
(non-physiological) assumes eating is controlled by other factors, such as social influences and
cognitive considerations. This research claims these other factors have no evident
biological purpose (Herman and Polivy, 1983).
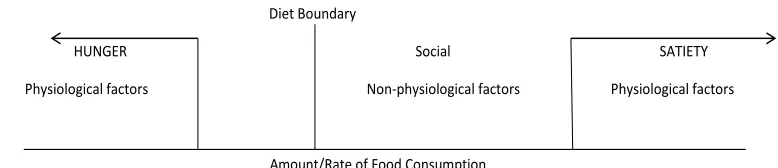
Boundary Model
The boundary model was posited by Herman and Polivy (1983) with the goal of
continuum; with hunger at the far left end representing a deficit of food consumption and
satiety at the far right end representing excess food consumption (see Figure 1). These
represent the ‘biological boundaries’ that help signal when the person feels hungry or
satiated (Nederkoorn and Jansen, 2002). Thus, the food consumption falling between
these boundaries are thought to be under control of other cognitive (non-physiological)
factors. Additionally, a diet boundary is self-imposed by restrained eaters. This is the
maximum desired food consumption for the restrained eater in question. If the restrained
eater does not perceive that they have exceeded the diet boundary, they have successfully
restricted their consumption. On the other hand, if the restrained eater perceives they
have exceeded the diet boundary, the restrained eater feels they are justified in overeating
(Nederkoorn and Jansen, 2002).
The “pre-load” paradigm has frequently been used to study restrained and
unrestrained eaters. In this method, participants are forced to consume a high calorie
pre-load followed by a “taste test.” The participant is led to believe the experimenters are
interested in their tasting preference, but in actuality they are interested in the amount of
food the person eats during the taste test. Research has shown unrestrained eaters
consume less food during the taste test following a pre-load; whereas restrained eaters
consume more food during the taste test following a pre-load than without a pre-load
Diet Boundary
HUNGER Social SATIETY
Physiological factors Non-physiological factors Physiological factors
[image:11.612.138.527.374.458.2]Amount/Rate of Food Consumption
(Blechert et al., 2009; Herman and Mack, 1975; Nederkoorn and Jansen, 2002).
Nederkoorn and Jansen (2002) refer to this phenomenon as counterregulation.
Counterregulation assumes that unrestrained eaters stop eating when they are full.
Therefore, eating a high caloric pre-load satisfies their hunger more, requiring them to eat
less in the subsequent taste test. On the other hand, restrained eaters follow what has
been called an “all or nothing” dietary rule (Blechert et al., 2009) or the “what-the-hell
effect” (Herman and Polivy, 1983). This argument assumes after restrained eaters eat a
high caloric pre-load, the individual perceives they can no longer maintain their diet goal,
resulting in overeating.
Herman and Polivy (1983) describe the “what-the-hell effect” as the following.
When a restrained eater eats a high caloric preload, such as a milkshake, they perceive
they are ‘to the right of the diet boundary’ (shown in the boundary model above).
Therefore, they feel there is no point in trying to continue to restrain their consumption
because their goal of maintaining a diet boundary has been undercut by the preload. Thus
the dieter eats until the point of satiety. Unfortunately, for restrained eaters, the point of
satiety is farther ‘to the right’ of the continuum than it is for unrestrained eaters. Hence,
they restrained eater may have episodes of disinhibited eating.
Cue Reactivity Theory
One shortcoming of the boundary model is that it doesn’t account for why
restrained eaters don’t regulate their behavior similarly when they haven’t actually eaten
the food. Nederkoorn and Jansen (2002, p. 62) explain “this theory states that when a
these cues become predictors of the start of a binge. Exposure to these cues induces
conditioned physiological activity, which can prepare the person for the intake of food.”
In other words, exposure to a preload stimulates physiological responses and cravings in
the restrained eater, which in turn lead to increased food intake and counterregulation
(Nederkoorn and Jansen, 2002).
Personal Characteristics
Psychology researchers hypothesize that the presence of the impulsivity trait in
restrained eaters increases their susceptibility to unhealthy eating behaviors. Several
researchers have found the general trait of impulsivity is related to overeating and weight
gain (Guerrieri, Nederkoorn, and Jansen, 2008; Jansen et al., 2009).
In addition to impulsivity, several personality traits have been found to be more
prominent in restrained eaters, such as neuroticism, stress, anxiety, and narcissism
(Polivy, 1996; see Chapter 2).
Situational Characteristics
Wansink (2004) offers four consumption drivers in the individual’s eating
environment, and five food-related environmental factors that influence consumption.
The consumption drivers include 1) eating atmospherics, 2) eating effort, 3) eating with
others, and 4) eating distractions. The five food-related environmental factors that
influence consumption volume but are unrelated to palatability are termed the “Five S’s
of the food environment.” These factors include salience, structure, size, whether it is
Purposes
One research aim is to determine what characteristics in restrained eaters lead to
unhealthy eating behaviors, in order to educate them on how to avoid unhealthy
behaviors and engage in healthy eating decisions. Establishing what personal and
environmental factors lead restrained eaters’ to unhealthy eating behaviors is central to
this endeavor. Is it the context, the person, or both that drive these decisions? Further,
do restrained eaters who are high in the impulsivity trait behave worse than those low in
impulsivity?
I am also interested in exploring the role of emotional intelligence (EI) in the
restrained eater’s decision. Research has indicated an individual’s emotions play a role in
their unhealthy eating decisions (Tice, Bratslavsky, and Baumeister, 2001). Additionally,
Kidwell, Hardesty, and Childers (2008a) found emotional intelligence predicted healthy
food choices.
In summary, this research attempts to clarify what personal and situational
characteristics affect a restrained eater’s behavior. I will specifically examine whether
personal characteristics such as emotional intelligence and impulsivity level of the
restrained eater will modify their eating behavior. Furthermore, I will explore whether
the presence of the newly-required menu calorie labeling, a situational characteristic, will
lead restrained eaters to behave differently, and if an emphasis on mindful eating can
Consumer Emotional Intelligence
Mayer, Salovey, and Caruso (2000) recognized two models of emotional
intelligence, 1) ability models and 2) mixed models. They focused on ability models
because they thought mixed models lacked internal consistency (Kidwell et al., 2008a).
The Mayer-Salovey-Caruso Emotional Intelligence Test (MSCEIT) scale was developed
as an emotional intelligence measure to examine the relationship between general
emotional intelligence and performance (Mayer, Salovey, Caruso, and Sitarenios, 2003).
Kidwell, Hardesty, and Childers (2008a) adapted the MSCEIT scale to be
domain-specific to consumer behavior. They sought to investigate if more effective
consumers were driven by specific competencies. Hence, Kidwell and associates (2008a)
established the Consumer Emotional Intelligence Scale (CEIS). The four dimensions are
perceiving emotion, facilitating emotion, understanding emotion, and managing emotion
(Mayer and Salovey, 1997).
Mindful Eating
Recently researchers have begun examining intervention techniques that may help
restrained eaters better control their diet. A relatively new method, known as “mindful
eating,” has been defined as describing a non-judgmental awareness of physical and
emotional sensations associated with eating (Framson et al., 2009). Mathieu (2009)
reports mindful eating involves several activities, including: 1) slowing down the pace of
eating, 2) eating away from distractions, 3) becoming aware of the body’s hunger and
fullness cues, 4) acknowledging responses to food without judgment, 5) choosing to eat
aware of and reflecting on the effects caused by unmindful eating, and 7) meditation
practice as a part of life. Potentially, experts believe mindful eating can be very
beneficial by facilitating a regained sense of hunger and fullness, weight loss and weight
maintenance, increased self-esteem, and a sense of empowerment with regard to eating
(Mathieu, 2009).
However, Mathieu (2009) claims there are a few obstacles for individuals
attempting to engage in mindful eating. First, the way of life in the US is to put a
premium on productivity, encouraging individuals to eat convenient food quickly with
lots of distractions. Second, some people have difficulty perceiving their hunger and
fullness cues due to either prior eating disorders or a genetic predisposition.
Savoring and Desire
Savoring is an important component in the concept of mindful eating. Individuals
may differ in their capacity to savor their food, resulting in overeating in those who are
less able to savor. When an individual is forced to direct attention towards the eating
process, they are more likely to savor their food since they are thinking about it.
Bryant, Chadwick, and Kluwe (2011, p. 108) define savoring as involving “the
self-regulation of positive feelings, most typically generating, maintaining, or enhancing
positive affect by attending to positive experiences from the past, present or future.” In
other words, savoring is the ability to generate, intensify and prolong enjoyment of an
event through one’s own volition (Bryant, 2003). People’s perceptions of their ability to
Bryant (2003) developed the Savoring Beliefs Inventory (SBI). There are three
dimensions of the self-report instrument, including savoring in the moment (present),
savoring through reminiscence (past), and savoring through anticipation (future). People
typically report being most capable of savoring through reminiscence, moderately
capable of savoring in the present, and least capable of savoring through anticipation
(Bryant et al., 2011).
Self-regulation involves an attempt to reduce the discrepancy between a current
state and a desired goal state (Alberts, Mulkens, Smeets, and Thewissen, 2010).
Traditionally self-regulation research has focused on people’s ability to control
themselves, but recently scientists have realized desire is also an important factor
(Hofmann and Van Dillen, 2012). Desire is the feeling of wanting something that
motivates behavior (Hofmann and Van Dillen, 2012).
Hofmann and Van Dillen (2012, p. 317) define desire as “an affectively charged
motivation toward a certain object, person, or activity that is associated with pleasure or
relief from displeasure.” Hofmann and Van Dillen (2012) developed a dynamical model
of desire, in which desire originates from the interplay of stimulus properties, internal
need states and learning history. An individual processes the reward value automatically,
and then the desire can proceed to “mindless” behavior or can emerge into consciousness.
Once the desire has emerged into consciousness, it occupies working-memory resources.
Hofmann and Van Dillen (2012) cite recent research that suggests methods for which one
can prevent the development of desires by having an impact on the early affective
abstract mind-set, and implementation intentions to avoid temptation have all been shown
to have an impact on this early processing (Hofmann and Van Dillen, 2012).
Research Study
Hypotheses
I expect restrained eaters who are high on the impulsivity trait will engage in less
healthy eating behaviors than restrained eaters who have less impulsivity or unrestrained
eaters. I also hypothesize individuals with high emotional intelligence will make
healthier eating decisions than individuals with lower emotional intelligence.
Additionally, I hypothesize individuals with low impulsivity and high EI will make
healthier decisions than low EI, highly impulsive individuals.
Moreover, I expect the presence of caloric information on a menu to influence
restrained eaters to make healthier decisions than their unrestrained counterparts. Since
restrained eaters are chronically dieting and hypersensitive to external food cues, I argue
restrained eaters they will examine calorie information longer than unrestrained eaters.
Finally, I hypothesize a mindfulness intervention will influence restrained eaters to make
healthier (more mindful) eating decisions.
Procedure
The first study will provide an overview of the personal and situational factors
restrained eaters behavior. I anticipate impulsivity of the individual will be important in
determining their eating behavior.
The second study will use an eye tracker as a tool to gauge whether the presence
of caloric information on a menu display influences restrained eaters to make healthier
decisions. In this study, I will present the participant with a menu board on a computer
screen. The menu board will contain the name of the food item, the price of the food
item, and a column for caloric content. The participant will examine this contextual
factor with instructions to select the food items they would want to eat in a 24-hour time
period. The eye tracker will be used to determine where the participant looks the longest
and most frequently.
In the third study, an expert will teach participants in the experimental condition
important techniques associated with mindful eating. Participants in both conditions will
then be asked to complete a food diary for a few weeks following the training (or lack
thereof). Results will indicate which participants lost more weight over the course of the
experiment and which participants made healthier food decisions (judging by their food
diary).
Summary
Obesity is an alarming trend that is becoming more and more prevalent in the US.
Many consumers are aware of this, and try to restrict their food intake. Restrained eaters
are chronic dieters. Two schools of thought exist concerning eating behaviors, biological
and non-physiological. The researchers on the biological side believe the brain sends
researchers believe social and cognitive factors are most important. In an effort to
incorporate both worlds, Herman and Polivy (1983) developed the boundary model,
which posits a restrained eater sets an arbitrary ‘diet boundary.’
Numerous personal and situational characteristics affect the behavior of restrained
eaters. Additionally, an individual with higher emotional intelligence is expected to be
better equipped to make healthy eating decisions, while more impulsive individuals are
less equipped.
One technique that may be beneficial in helping restrained eaters make more
healthy eating decisions is mindful eating. Still there are obstacles to this approach,
including an emphasis on productivity in the American way of life and difficulty for
some individuals to perceive fullness cues. Further, individuals also differ in their
capacity to savor.
This dissertation will consist of three studies. The first study will be an online
survey to determine the role of personal factors such as emotional intelligence and
impulsivity on restrained eaters’ decisions. The second study will attempt to gauge the
effectiveness of calorie labeling on menus through an eye-tracking approach. Finally, the
last study will try to determine if a mindfulness intervention will help restrained eaters
CHAPTER 2
LITERATURE REVIEW
Restraint Theory
Restraint theory has it’s foundations in Schachter’s (1968, 1971) and Nisbett’s
(1972) theories of obesity (Ruderman, 1986). Schachter (1968, 1971) proposed that
obese individuals were more responsive to compelling environmental cues than were
their normal weight counterparts (Ruderman, 1986). Numerous studies examining this
theory have yielded inconsistent findings (see Wooley and Wooley, 1975, and Leon and
Roth, 1977, for literature reviews). Ruderman (1986) posits this is due to many
measurement problems, including definitions of external responsiveness in nonfood cue
studies (typically the amount eaten), distinguishing between internal and external cues,
how to vary the intensity of external cues, and sampling issues.
Still, researchers have drawn two conclusions. First, obese and normal weight
people clearly have different eating patterns (Ruderman, 1986). Palatability is the only
variable that has consistently produced differences, defined by Rogers (1990, p. 167) as
the “hedonic aspects of the taste of food.” Obese people’s eating behavior is more
affected by their perceptions of palatability than their normal weight counterparts
(Ruderman, 1986). Still, the support offered by palatability is arguable because
palatability has not been clearly defined. Originally palatability was conceptualized as an
external cue, but has increasingly been defined as both an internal and external cue
(Ruderman, 1986). Palatability is now thought to be influenced by individual differences
The second conclusion is that Schachter’s original theory, that obese people’s
behavior is mostly influenced by external cues and normal weight people are primarily
influenced by internal cues, is “too simplistic” (Ruderman, 1986, p. 248).
Building on Schachter’s theory, Nisbett (1972) proposed an explanation of why
obese and normal weight people differ in their external responsiveness to food cues. He
proposed each person has an ideal weight (called a “set point”), and obese people have
higher than average set points (Nisbett, 1972). Set point is determined by the number of
fat cells in a person’s body. Ruderman (1986) argues set point is too difficult to test and
parts of the theory aren’t logical. However it is important in that it drew attention to the
role of dieting in eating behaviors (Ruderman, 1986), which launched inquiry into the
restraint construct by Herman, Mack, and Polivy (Herman and Mack, 1975; Herman and
Polivy, 1980, 1983). These authors took away that dieting is an important factor in an
individual’s food regulation efforts, and therefore initiated restraint research (Ruderman,
1986).
Restraint theory holds that eating style is under cognitive control (as opposed to
physiological), which leads an individual to ignore satiety cues. This often results in
disinhibition and overeating in situations where cognitive resources are depleted
(Johnson, Pratt, and Wardle, 2011). Polivy (1996, p. 590) described restrained eaters as
“chronic on-again-off-again dieters.”
Two hypotheses of restraint exist, including the “disinhibition hypothesis,” and
differing levels of restraint. The disinhibition hypothesis states that restrained eaters have
eating patterns marked by dieting and periodic overindulgence (Herman and Polivy,
that interfere with restrained eaters’ self-control (Ruderman, 1986). The second
hypothesis proposes that obese people and normal weight people can be characterized by
differences in level of restraint (Ruderman, 1986). Obese individuals are characterized
by higher levels of restraint than normal weight individuals. This hypothesis was
developed in response to Schachter’s findings indicating obese individuals were more
responsive to external food cues than normal weight individuals (Ruderman, 1986).
Some have argued that the restraint scale is not a ‘true’ measure of restraint since
successful dieters tend to not score as high on the scale as unsuccessful dieters on the RS
(Heatherton, Herman, Polivy, King, and McGree, 1988).
Herman and Polivy (1980) developed a restraint scale (RS) to study this
phenomenon. To study restrained eating, they may present the participant with a preload
or no preload. As expected, unrestrained eaters pay attention to internal satiety cues
when presented with a pre-load and eat less subsequently since they are not as hungry.
On the other hand, restrained eaters have been found to eat more following a pre-load.
This is presumably because they feel they have already broken their diet (cognitive
disinhibition).
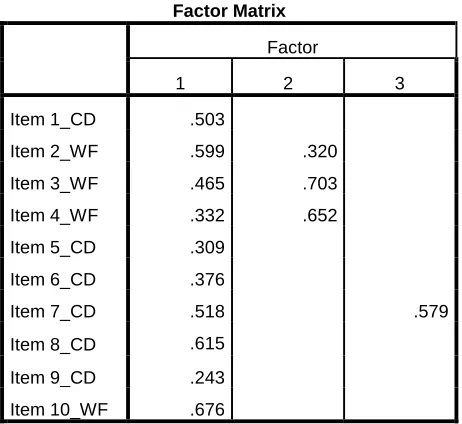
The original restraint scale (Herman and Mack, 1975) was modified (Herman and
Polivy, 1980) and has been used most frequently in research. The RS has two subscales,
concern for dieting (CD) and weight fluctuation (WF) (Williamson et al., 2007).
Although many studies have shown the reliability and validity of the RS (Gorman and
Allison, 1995), it has produced inconsistent findings which have spurred the development
of two alternative scales. The two alternative scales are the Dutch Eating Behavior
1986) and the Three Factor Eating Questionnaire (TFEQ) (Stunkard and Messick, 1985)
renamed the Eating Inventory in 1988 (Stunkard and Messick, 1988).
The Eating Inventory is thought to contain three subscales, 1) dietary (cognitive)
restraint, 2) disinhibition, and 3) perceived hunger (Williamson et al., 2007). Heatherton
and colleagues (1988) noted a few disadvantages of the Eating Inventory. First, the
predictive validity has not been demonstrated. Second, it’s not a uni-dimensional scale,
so it doesn’t identify a type of eater.
The DEBQ measures the following: 1) restrained eating, 2) emotional eating, and
3) external eating (Williamson et al., 2007). Heatherton et al. (1988) noted a few
advantages of the DBEQ. It’s relatively uncontaminated by weight and it’s easier to fill
out for the participant. Wardle (1986) noted the DEBQ was more useful than the RS
because incomplete responses to the RS were frequent and very common in their sample.
Heatherton et al. (1988) rebutted that was primarily true in British samples, not in the
United States. Further the DEBQ was found to be generalizable across countries in this
study, as their British restraint scores were similar to the Dutch sample (Wardle, 1986).
Wardle (1986) found the DEBQ was not confounded with weight variability.
Heatherton and colleagues (1988) suggest the DEBQ and Eating Inventory
measure different ‘styles of eating,’ whereas the restraint scale simply identifies dieters,
without attempting to identify their eating style. In other words, the scales have different
‘measurement strategies,’ resulting in different findings across scales (Heatherton et al.,
1988).
Williamson et al. (2007) noted, consistent with previous results, the RS-weight
the RS measures both intent to diet and susceptibility for overeating. In a normal weight
population, the RS seems to be psychometrically sound (Wardle and Beales, 1987).
Also, the median men’s restraint score has been found to be significantly lower than
women’s scores (Wardle and Beales, 1987).
Polivy (1996) explains restrained eaters focus more on food and weight-related
information. They have also been found to be more easily distractible and have a harder
time concentrating on a task (Polivy, 1996). Restrained eaters have also exhibited signs
of increased irritability, negative emotionality, and heightened affective responsiveness
(Polivy, 1996). Further, restrained eaters have been found to score higher on neuroticism
measures, such as anxiety, self-esteem, and narcissism scales (Polivy, 1996).
In conclusion, restraint theory was shaped from Schachter and Nisbett’s theories
of obesity. It is clear that normal and obese people have different eating patterns. Also,
it seems that obese individuals are influenced more by external cues than normal weight
individuals.
Situational Characteristics
Story, Kaphingst, Robinson-O'Brien, and Glanz (2008) formed a framework
depicting what influences people’s eating behaviors. They grouped environmental
influences into three levels, including social, physical and macro-level factors.
Macro-level environmental factors include things such as government policies and food
marketing practices. The physical environment is the setting where people eat or procure
the social environment includes people who may impact the eating behavior, such as
family, friends or peers.
As it relates to the physical environment, it has been estimated about 68% of total
calorie intake results from food prepared within the home, whereas 32% of calories are
consumed away from the home (Story et al., 2008). Researchers estimate consumers
spend over half of their food dollars outside the home (Rosenbloom, 2010). Factors
associated with healthful behaviors in the home include availability and accessibility of
healthy foods, the frequency of family meals, and parental intake and parenting practices
(for children’s diets) (Story et al., 2008). The trend of Americans eating out more often
is concerning since food consumed away from home is often more calorie dense and of
poorer nutritional quality (Story et al., 2008). Additionally, restaurants often encourage
overconsumption by serving large portion sizes (additional explanation below) (Story et
al., 2008). Burton, Creyer, Kees and Huggins (2006) found consumers may
underestimate their actual caloric content by as much as 50%.
Nieuwenhuizen, Weenen, Rigby, and Hetherington (2010) outline factors that
affect food intake as being related to the person, environment or product. The authors
claim good health and motivation are personal factors that promote intake
(Nieuwenhuizen et al., 2010). From an environmental perspective, distractions,
convenience, encouragement by care givers, sharing a meal with others, and eating at the
same time every day promote food intake (Nieuwenhuizen et al., 2010). Finally, foods
with high fat content, high palatability, appetizing appearance, and variety promote food
Wansink (2004) also examines environmental influences, although he focuses on
the physical and social environment and largely ignores macro-level factors. Wansink
(2004) outlines four consumption drivers in the individual’s eating environment,
including 1) eating atmospherics, 2) eating effort, 3) eating with others, and 4) eating
distractions.
Eating atmospherics refer to “ambient characteristics that influence the immediate
eating environment- such as temperature, lighting, odor and noise (Wansink, 2004, p.
460).” For instance, the body’s need to regulate its temperature calls for an individual to
consume more during cold temperatures vs. hot temperatures.
While temperature has a direct influence on consumption, lighting, odor and noise
have a more indirect (mediating) impact (Wansink, 2004). Soft lighting increases eating
duration and increases comfort and disinhibition (Wansink, 2004). Further, unpleasant
odors shorten the duration of a meal and suppress individual’s food consumption
(Wansink, 2004). Moreover, Wansink (2004) reports that both extremes of music (soft
and comforting versus loud and irritating) increase consumption, but in different ways.
Soft music encourages longer meals and a slower rate of eating resulting in higher
consumption of food and drinks. Loud music or noise can lead to individuals overeating
without monitoring their intake as they try to leave the restaurant as quickly as possible.
Wansink’s second consumption driver, eating effort, is one of the strongest
influences on consumption (Levitsky, 2002; Wansink, 2004) and is related to how easily
a food can be consumed. Foods that are convenient for an individual to access are
consumed in higher quantities, especially when the foods are ready to eat (Chandon and
The third consumption driver, eating with others, can also increase how much an
individual consumes because it can lead to an extended meal, can provide a consumption
norm based on much the other people eat, can reduce an individual’s motivation to
monitor consumption, and can make the meal more relaxing and enjoyable (Wansink,
2004). De Castro (2000) found meals eaten with one other person were 33% larger than
those eaten alone, judged by the amount eaten.
Eating distractions can also increase consumption by obscuring one’s ability to
monitor consumption, by initiating a habitual consumption script (such as popcorn during
a movie), and/or extending the duration of the meal (Wansink, 2004).
Wansink (2004) also reported “Five S’s of the food environment,” which are
food-related environmental factors that influence consumption volume but are unrelated
to palatability. These factors include salience, structure, size, whether it is stockpiled,
and how it is served.
The act of seeing or smelling a food (salience) can stimulate salivation and
increase reported hunger (Wansink, 2004). Increasing the variety of a food (structure)
can increase the consumption volume of the food (Rolls, 1986). Additionally, buying in
bulk and stockpiling food can lead to overconsumption (Chandon and Wansink, 2002).
Wide or large containers can create an illusion that one is consuming less than they are
(known as the size-contrast illusion) (Wansink, 2004).
As mentioned above, larger packages and portion sizes can also increase
consumption (Scott et al., 2008; Wansink, 2004). Scott et al. (2008) found restrained
eaters consume more calories from small food in small packages, theorizing their
information. The authors posit small food in small packages is viewed as both diet food
and high in calories (Scott et al., 2008). Alternatively, unrestrained eaters consume more
calories from large food in a large package.
Studies have shown that all of these aforementioned situational factors may affect
an individual’s eating behavior. Most experts agree that consumers must be armed with
nutritional information at the point of choice to create awareness and promote more
healthful choices (Story et al., 2008). It is believed providing calorie information at the
point-of-purchase will help consumers limit their excess calorie intake (Harnack et al.,
2008). In the absence of calorie information, research has shown consumers widely
underestimate the caloric content of menu items (Burton et al., 2006).
As of 2006, only about 44% of the top 300 restaurant chains provided nutrition
information to consumers, and most of those who did offered it via their website (not at
the point of choice) (Wootan and Osborn, 2006). In 2010, Congress passed a health care
reform law, which included a provision requiring chain restaurants with over 20 locations
to provide caloric information on their menus and drive through signs.
Restraint theory suggests restrained eaters are more cognitively concerned with
food and weight than unrestrained eaters (Polivy, 1996). Thus, they will be more
interested and pay more attention to menu calorie information, whereas unrestrained
eaters will care less since they rely on internal feelings of satiety.
Personal Characteristics
Story et al. (2008) cited five groups of individual level factors that affect eating
demographics. Cognitions may include attitude, preferences, knowledge, or values
(Story, et al., 2008). Biological factors may include gender, genes or age (Story et al.,
2008). Finally demographics may include factors such as income, race or ethnicity
(Story et al., 2008).
Chandon and Wansink (2007) noted two conflicting individual goals may be
encountered when making a food decision: taste enjoyment and maintaining good health.
Studies have shown priming the taste enjoyment goal may trigger less healthy food
choices (Shiv and Fedorikhin, 1999). Joint presentation of a healthy and unhealthy
option may result in the individual choosing the healthy option because of the guilt and
the difficulty justifying the latter (Okada, 2005).
Scott et al. (2008) found conflicting food information can cause high levels of
stress in restrained eaters. Wansink and Chandon (Chandon and Wansink, 2007;
Wansink and Chandon, 2006) had previously argued restrained eaters consume more
when health-claims are present because they feel less guilt. Scott et al. (2008) found
restrained eaters were perpetually in their ‘hot system,’ which triggered a loss of
self-control and stress when given conflicting information about food, such as dietary
categorization (small food in small packages is more like diet food) and perceived caloric
content (small food in small packages is higher in calories).
Recent research indicates psychological and environmental factors are more
important in obesity studies than genetic/biological factors (Guerrieri et al., 2008;
Levitsky, 2005). Studies have shown higher levels of impulsivity in obese populations,
Impulsivity
Several researchers have found the general trait of impulsivity is related to
overeating and weight gain (Guerrieri et al., 2008; Jansen et al., 2009). Impulsivity is
generally defined as a tendency to think, control and plan insufficiently, which mostly
results in an inaccurate or maladaptive response (Guerrieri et al., 2008; Jansen et al.,
2009). It is considered to be a multidimensional construct because correlations between
self-report measures and behavioral measures of impulsivity are generally weak,
indicating it may be an “umbrella concept” (Guerrieri et al., 2008). In other words, it
may be a group of related concepts, which several researchers believe include the
following: response inhibition/premature responding, sensitivity to reward, and a
self-reported personality trait (Guerrieri et al., 2008).
Impulsivity is operationalized in most of these studies as the inability to inhibit
basic motor responses. The response inhibition facet of impulsivity is measured
behaviorally with a Stop Signal Task (SST; Logan, Schachar, and Tannock, 1997). In
marketing, the Barratt Impulsiveness scale (Patton and Stanford, 1995) and Rook and
Fisher’s impulsivity scale (Rook and Fisher, 1995) have both been used as self-report
measures of impulsivity.
Nederkoorn, Guerrieri and associates have shown impulsivity has many negative
effects on restrained eaters. Specifically, impulsivity has been shown to increase
intentions to diet (Nederkoorn, Eijs, and Jansen, 2004), increase food intake and
overeating (Guerrieri, Nederkoorn, and Jansen, 2007), increase weight and obesity
(Guerrieri et al., 2008), and decrease weight loss during weight reduction treatment
Jansen et al. (2009) found an interaction between restraint and impulsivity, such
that high-restrained eaters only overate when they were also impulsive. Jansen and
associates suggest examining whether interactions between restraint and reward
sensitivity or the inability to delay gratification will result in the overeating of
high-restrained eaters (Jansen et al., 2009).
In the marketing realm, Kidwell, Hardesty and Childers (2008b) evaluated obese
individuals in regards to their impulsivity and emotional intelligence (discussed later).
Obese impulsive individuals were found to consume more calories when they are
miscalibrated emotionally, whereas calibrated individuals make higher-quality food
decisions (Kidwell et al., 2008b).
Personality Traits
Elfhag and Morey (2008) examined what personality traits were prominent in
restrained eaters. They found restrained eating was positively related to
conscientiousness, extraversion (specifically warmth and positive emotions), and
openness (particularly aesthetics, feelings and actions). Restraint was negatively related
to neuroticism (specifically anxiety and vulnerability). Analyzing gender effects in their
sample, restrained eating was best predicted by lower anxiety in men, and lower
vulnerability and higher achievement striving for women.
Polivy (1996) reported restrained eaters have been found to be more neurotic,
anxious, and narcissistic than unrestrained eaters. Restrained eaters also have been found
Clearly, there are many situational and personal characteristics that contribute to
different eating decisions between restrained and unrestrained eaters. I hope to add some
clarity to which factors are more important in studies one and two.
Summary
In summary, restraint theory originated with Schachter (1968, 1971) and Nisbett’s
(1972) theories of obesity. Herman and Polivy developed their restraint theory (Herman
and Polivy, 1980) based on this theoretical foundation. There are two restraint
hypotheses: 1) Disinhibition, where an individual exhibits patterns of dieting and
overindulgence and events interfere with their cognitive control. 2) Different levels of
restraint for obese and normal weight individuals.
Three different scales have been used to measure restrained eaters. The Restraint
Scale (Herman and Polivy, 1980), Dutch Eating Behavior Questionnaire (Van Strien et
al., 1986), and the Three Factor Eating Questionnaire/Eating Inventory (Stunkard and
Messick, 1985). All three offer advantages and disadvantages and are thought to mostly
measure the same construct. A notable exception is the weight fluctuation component of
the RS. The RS has been used most frequently be researchers to categorize eaters into
the restrained vs. unrestrained categories. Since these measures have been frequently
debated, I will examine all three restraint scales in study one.
Finally, several situational and personal characteristics influence restrained eaters’
behavior. Physical and social environments have been used to categorize situational
characteristics. Some examples mentioned in the literature include atmospherics, eating
food, and large containers. Furthermore, many personal characteristics affect restrained
eaters’ decisions, such as cognitions, skills and behaviors, lifestyle, biological factors,
demographics, level of impulsivity, and personality factors (i.e. neuroticism, anxiety,
CHAPTER 3
HYPOTHESES
Impulsivity
Several studies have found restrained eaters have a basic lack of inhibitory control
(Nederkoorn et al., 2004). Nederkoorn et al. (2004, p. 1652) defines an impulsive
response as “one that is executed with insufficient forethought, planning, or control, and
is therefore inaccurate or maladaptive.” If someone lacks inhibitory control, immediate
gratification will rule over long-term consequences (Nederkoorn et al., 2004).
Numerous populations have been found to possess more impulsivity than others.
Bulimic patients have proven to be highly impulsive (Nederkoorn et al., 2004).
Nederkoorn, Smulders, Havermans, Roefs, and Jansen (2006) found obese women were
more impulsive (measured behaviorally) than their normal weight counterparts.
Nederkoorn, Houben, Hofmann, Roefs, and Jansen (2010) found impulsive individuals
gained more weight than participants with more effective response inhibition, but only
when the participant had a strong implicit preference for snack food.
Guerrieri, Nederkoorn, and Jansen (2008) stated it’s difficult to assert highly
impulsive individuals have a harder time resisting food because actual food intake is
rarely measured in impulsivity studies.
Guerrieri, Nederkoorn, Schrooten, Martijn, and Jansen (2009) cognitively primed
participants with the concepts of either impulsivity of inhibition. Caloric intake was
higher in the impulsivity condition as opposed to the inhibition condition. The
In study two, the authors manipulated behavioral instructions to induce
impulsivity vs. inhibition. Again, caloric intake was higher in the impulsivity condition;
however with no difference in restrained and unrestrained eaters this time (Guerrieri et
al., 2009). The authors concluded that, at least in unrestrained eaters, heightened
impulsivity results in higher caloric intake.
Nederkoorn and colleagues (2004) found restrained eaters to have a specific
deficit in response inhibition and are more anxious in general than low restrained eaters.
Guerrieri et al. (2007) primed impulsivity in healthy participants to determine if
impulsivity causes overeating and obesity. Primed impulsivity and restraint did not
predict food intake, however impulsivity (as measured by the behavioral and self-report
measures) did predict food intake (Guerrieri et al., 2007). These findings support the
notion that impulsive people overeat more easily. Guerrieri and associates (2007) found
no support that impulsivity mediates the effect of restraint on food intake. They
hypothesized that their sample had less extreme restraint scores than Nederkoorn et al.’s
(2004) sample since the latter used only participants who scored below 6 or above 15 on
the restraint scale in a pre-test.
Jansen et al. (2009) found an interaction effect for restraint and impulsivity. In
other words, high restrained eaters only overeat when they’re also impulsive. The
authors concluded that overeating isn’t inevitable for restrained eaters. Overeating is
only a concern with a restrained eater who is also highly impulsive (Jansen et al., 2009).
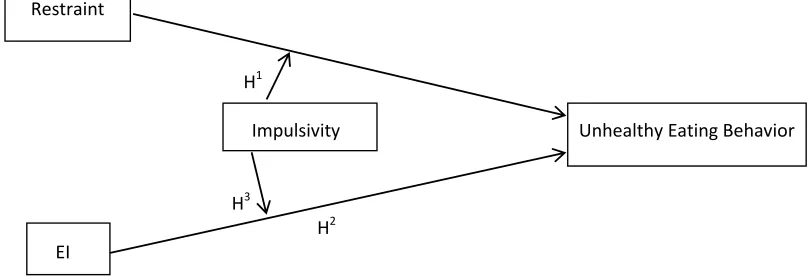
Hypothesis 1: Impulsivity will moderate the relationship between restrained
eating and unhealthy eating behaviors, such that more impulsive restrained eaters
will have more unhealthy eating behaviors.
Consumer Emotional Intelligence
Consumer Emotional Intelligence (CEI), otherwise known as emotional ability,
“represents a person’s ability to skillfully use emotional information to achieve a desired
consumer outcome” (Kidwell et al., 2008b, p. 612). The CEIS incorporates four
reflective first-order dimensions, including perceiving, facilitating, understanding, and
managing emotions.
Mayer, Caruso, and Salovey (1999) defined perceiving emotions as the ability to
perceive, appraise and express emotions accurately. Facilitating emotion is the ability to
access, generate and use emotions to facilitate thought (Mayer and Salovey, 1997).
Understanding emotion is the ability to analyze complex emotions and to form emotional
knowledge (Mayer and Salovey, 1997). Managing emotion is the ability to regulate
emotions to promote a desired outcome (Mayer and Salovey, 1997).
Kidwell et al. (2008a) found high EI scores, specifically in the understanding and
managing emotions dimensions of the CEIS, were most predictive of total calories.
Hypothesis 2: Given access to calorie labeling, an individual with high emotional
intelligence (EI) will make healthier eating decisions than individuals with low EI
Hypothesis 3: Given access to calorie labeling, an individual with low impulsivity
and high EI will make a healthier (less caloric) decision as opposed to low EI,
[image:38.612.131.536.224.363.2]highly impulsive individuals.
Figure 2 is the model my first three hypotheses set out to investigate.
Figure 2. Study 1 Model
Health Information Presentation
The recent Affordable Care Act legislation hopes to lead individuals to make
healthier eating decisions by providing calorie information. There is much debate
concerning whether or not the menu calorie labeling will accomplish the goal of
encouraging consumers to make healthier decisions. The legislation was passed in 2010,
but the U.S. Food and Drug Administration (FDA) has yet to enforce it, citing complex
issues and additional guidance needed to comply (Wei and Miao, 2013).
Three results may occur: 1) they may ignore the information (my hypothesis for
unrestrained eaters), 2) they may choose to order a healthier option, or 3) they may eat
less of their original order.
Restraint
H1
Impulsivity Unhealthy Eating Behavior
H3
Several studies explore eating a healthier option than their original order.
Yamamoto, Yamamoto, Yamamoto, and Yamamoto (2005) showed McDonald’s, Panda
Express and Denny’s menu’s without nutritional information to adolescents first and
asked them to choose what they would eat for dinner. After making their choice, they
were asked to make the choice again but instead shown menus with caloric information
included. The calorie information did not change the decisions made for a majority of the
participants. Twenty-nine percent of individuals did change at least one of their orders.
Of the orders that were changed, about half (43/93) resulted in a decrease in calories.
Thirty-three percent (9/27) of individuals who characterized themselves as too fat or
slightly overweight changed their orders.
Conversely, Cranage, Conklin, and Lambert (2005) found nutrition labels made a
difference in female’s decisions concerning where to eat. Females also reported a
significantly greater tendency than males to use the nutrition labels while making food
choices. Additionally, females chose menu items with lower calories and fat. Obese
females selected salads, vegetables, soups, fruits and low-fat dairy more when calorie
information was present.
Similarly, Gerend (2009) found the presence of calorie information did affect
women’s food decisions, but not men’s selections. Students were randomly assigned to
either the calorie viewing or non-calorie viewing condition and given a McDonald’s-like
menu to make their selection. The presence of calorie information did not significantly
alter what the men chose. Women who viewed the calorie information chose lower
A few studies have investigated the third option of eating less of their original
order. Two studies suggest that calorie information has different effects on restrained and
unrestrained eaters. First, Kirschenbaum and Tomarken (1982) investigated restrained
and unrestrained women eaters using the preload plus taste test (of ice cream) procedure.
They examined two potential methods to promote regulatory eating, smaller bowl size
and the presence of caloric information. The authors found the interaction of the small
bowl and calorie information caused restrained eaters to consume in a manner similar to
unrestrained eaters. Further, participants who took many and bigger spoonfuls consumed
more in this study.
Second, Kral, Roe, and Rolls (2002) had normal-weight women eat breakfast,
lunch and dinner in a lab on three separate occasions. The energy density of their food
was varied between days. Low energy density is associated with more fruits and
vegetables, or higher water content. Participants ate about 22% more on the high energy
density day than on the low. Participants were also split into two groups and were either
given nutritional information or not. No differences were found between these two
groups. More interestingly, restrained eaters who did not receive nutritional information
ate significantly less low energy density food than unrestrained eaters. However, no
differences in eating behavior were found between restrained and unrestrained
participants in the group that received nutritional information.
A few more studies have examined both food choices and intake simultaneously.
Aaron, Evans, and Mela (1995) monitored food choices in a cafeteria on two separate
weeks. Week one had no accompanying nutritional information, whereas week two did
patterns for restrained eaters or females between week one and two. Conversely,
unrestrained eaters and males actually increased their consumption of calories, fat and
carbohydrates in week two, when nutritional information was present.
Harnack et al. (2008) manipulated a McDonald’s menu to include or not include
calorie information. Participants were asked to purchase and consume a meal from the
menu. Results found the presence of caloric information had little effect on food
selection and consumption. Harnack et al. (2008) reported seven other studies had
examined the effect of calorie labeling at the point-of-purchase to date, and six of the
seven found the presence of the calorie information positively influenced food choices
(Balfour, Moody, Wise, and Brown, 1996; Burton et al., 2006; Cinciripini, 1984;
Conklin, Cranage, and Lambert, 2005; Milich, Anderson, and Mills, 1976; Yamamoto et
al., 2005). Still, the findings were weak or inconsistent in most of the studies.
In the realm of consumer behavior, numerous researchers have examined the
obesity epidemic. They have focused on one of two domains, the role of external
nutrition information or the internal characteristics of customers (Andrews, Netemeyer,
and Burton, 2009). Internal characteristics that have been investigated include
motivation to search for information and nutritional knowledge (Andrews et al., 2009).
Research has shown that consumers use nutritional information in the early stages of
processing, but don’t pay much attention to it after that (Andrews et al., 2009; Brucks,
Mitchell, and Staelin, 1984). Wansink and Chandon (2006) suggest consumer knowledge
regarding health and nutrition has little impact on their food decisions.
External nutrition information is primarily obtained through nutrition fact
al., 2009). The presence of health claims, such as low-fat or low-calories, may lead to
consumer inferences that a product is healthier than it is. Wansink and Chandon (2006)
found low-fat claims can lead to the underestimation of caloric content of food and higher
consumption.
Andrews and associates (2009) found both internal and external factors are
important in the consumer’s eating decision. Further, their findings support the necessity
of full and clear disclosure of less healthy foods for all consumers, regardless of
knowledge and motivation (Andrews et al., 2009).
A large body of research exists concerning the Nutritional Labeling and
Education Act of 1990 (NLEA). The main goal of the NLEA was to improve the
availability and usefulness of nutritional information on food packaging (e.g. the
Nutrition Facts panel) (Kozup, Creyer, and Burton, 2003). Restaurants and vending
machines are a notable exclusion from the NLEA. Still, several researchers examined
nutritional information formatting issues at that time and can inform this research on how
restaurants should present nutritional information.
Kozup and colleagues (2003) was one of the few studies that examined this issue
in the context of a restaurant setting. Findings suggest the target menu item is evaluated
using the non-target menu items as a frame of reference. The authors also find that
consumers are wary of product health claims. Hence, they will trust nutrition panel facts
first; however, they will resort to advertising or packaging claims when nutrition panel
information isn’t available (Keller et al., 1997; Kozup et al., 2003). Therefore,
Since consumers frequently underestimate the number of calories in a menu item,
proponents of the menu labeling legislation argue the availability of caloric information
at the point-of-purchase will foster more healthy (less caloric) food decisions (Burton and
Kees, 2011). The authors cited several possible impediments, including consumer’s
awareness, customer motivation, and knowledge of calorie information (Howlett, Burton,
Bates, and Huggins, 2009). Furthermore, are consumer expectations of calorie levels
consistent with actual caloric levels, do habits play a role, do other beliefs have an effect,
and do situational influences have an effect?
A few possible benefits of the legislation include encouraging restaurants to
reduce portion sizes, the introduction of new lower calorie healthy items, and decreasing
the calorie content of less healthy high volume products.
Swartz, Braxton, and Viera (2011) completed a literature review (for the
2008-2011 time period) on the topic of calorie labeling. They argue calorie consumption isn’t
effectively lowered through calorie labeling since only two of seven recent studies on the
topic found a significant decrease in calories when ordering from a calorie labeled menu
(Swartz et al., 2011).
Lando and Labiner-Wolfe (2007) conducted focus groups on behalf of the FDA
and found consumers were interested in having calorie information available, although
they wouldn’t use it on every occasion. They also thought a signal that an item is more
helpful (signposting) could be helpful.
Morley, Scully, Martin, Niven, Dixon, and Wakefield (2013) found respondents
calorie listed condition (around 120 calories). These respondents reported commonly
using traffic light signals in their decisions.
Pang and Hammond (2013) also found consumers in the calorie labeled menu
condition selected fewer calories than those in the no calorie labeled menu condition.
Those who saw calorie labels and an accompanying health statement also selected
significantly fewer calories.
Bassett et al. (2008) found Subway patrons who saw the posted calorie
information purchased 52 fewer calories than other Subway patrons.
Roberto, Larsen, Agnew, Baik, and Brownell (2010) found study participants in
the two conditions where calorie labels appeared on their menu ordered 14% less calories
than the no calorie label group. Further, participants in each of the calorie label groups
separately ordered fewer calories than the no calorie label group. The authors also found
adding a daily recommended caloric intake amount to the menu decreased calorie intake,
suggesting policy-makers should consider including this label (Roberto et al., 2010).
Several studies have found consumers to have very little understanding of the
nutritional content in meals, especially unhealthy ones (Burton, Howlett, and Tangari,
2009; Chandon and Wansink, 2007; Wansink and Chandon, 2006). While this implies
that calorie labeling should help inform their understanding, Burton et al. (2009) found
the relationship between the actual and expected nutritional information is what drove
participant’s responses, rather than just the disclosure of the information itself (Burton et
al., 2009).
Elbel and colleagues have found evidence against calorie labeling. Elbel, Kersh,
mandated) and in New Jersey (where it had not). The authors found about 28% of survey
respondents reported their choice was influenced by the posted calorie information.
However, the researchers didn’t detect a significant difference in calories consumed after
the introduction of the calorie labeling (Elbel et al., 2009). A similar approach was taken
in Elbel, Gyamfi, and Kersh’s (2011) research, but adolescents and children were the
population of interest as opposed to adults. Again no significant difference in calories
consumed occurred from pre-labeling mandate to post-labeling mandate. Further, fewer
adolescents paid attention to this information than adults. Fifty-seven percent noticed the
calorie information, yet only 9% reported considering the calorie information in this
sample. Two important notes concerning these studies were that they took place in low
income cities and were primarily minority samples. Additionally, the survey population
differed from the pre-test to post-test.
Liu, Roberto, Liu, and Brownell (2012) gave a group of participants a calories
listed menu and another group of participants no calories listed. These authors found no
significant differences on the number of calories ordered between the no calories and the
calories conditions.
Bates, Burton, Huggins, and Howlett (2011) found consumers need the help of
nutrition labeling to identify menu item content. Roseman, Mathe-Soulek, and Higgins
(2013) found consumers with higher nutritional knowledge made better decisions than
other regardless of the presence of calorie information. Wei and Mao (2013) found
calorie information interacts with perceived healthfulness of restaurants.
Despite these few studies with no effects found, I expect the presence of calorie
restrained eaters. Restrained eaters are chronically dieting, which means they are very
interested in what and how much they are consuming in order to not surpass their
self-imposed ‘diet boundary.’ Polivy (1996) echoes restrained eaters are more focused on
food and weight-related information than their unrestrained counterparts. Cranage et al.
(2005) found obese (restrained) eaters did in fact make healthier decisions when calorie
information was present. Unrestrained eaters are more likely to eat what they want and
rely on internal satiety cues to tell them when they’re full. Therefore, they are less
interested in the caloric content of the foods they choose to eat. Hence,
Hypothesis 4: Restrained eaters will spend a longer time evaluating calorie
information than unrestrained eaters.
Eye Tracking
Hypothesis 4 will be examined using an eye tracking device. In previous eye
tracking research, Nijs et al. (2009) argues the incentive sensitization theory (Robinson
and Berridge, 1993) is an addiction theory particularly relevant to the obesity epidemic.
In summary, the theory posits a sensitization of the reward system increases the salience
of reward-related cues in the environment, such as food. Thus, the cue grabs ones
attention, promoting craving and intake of the rewarding food (Nijs et al., 2009). Nijs et
al. (2009) examined two variables: the sum of eye fixation durations to gauge how long
the participant maintained attention, and where they first fixated to measure where they
initially directed their attention. In study 2, I am interested in the former, i.e. how long
restrained eaters attend to calorie information. Since the goal of study 2 is to investigate