Supporting Interface for Beginners Watching
Japanese Chess Games: Visualization of Putting
Timing of Captured Piece and Value of Player’s
Action
Daisuke Shimizu, Yoko Nishihara,
Member, IAENG,
and Ryosuke Yamanishi,
Member, IAENG,
Abstract—This paper proposes a supporting interface for beginners of Japanese Chess. Japanese Chess players move their pieces to check mate each opponent king. The players make predictions of the future situations of game. The predictions are hard to think up for beginners of Japanese Chess. Especially, the beginners do not understand why a player moves the piece to the square. They often fail to understand the situations of games. If such blind information is visualized for the beginners, they may understand the situations of games smoothly and they may be able to predict the next action by players. This research improves the interface that have proposed in the previous study for supporting the beginners watching Japanese Chess games. We add new visualized items to the previous interface. The added items are the putting timing of a captured piece and the value of player’s action, and the selected tactics. The putting timing is visualized with a gauge next to a captured piece, and the value of action is visualized the width of highlight backside of a piece. We conducted the evaluation experiments to verify the efficiency of the proposed interface in watching Japanese Chess games.
Index Terms—Watching support for beginners of Japanese Chess, Visualization of putting timing of a captured piece, Visualization of the value of player’s action, Visualization of tactics
I. INTRODUCTION
A
CCORDING to a Japanese report on leisure in 2018, the number of people interested in Japanese Chess has increased by 1,700,000, and it became about 7,000,000 in 2016. The increasing was caused by a boom on Japanese Chess. The boom worked to increase not only the number of players but also the number of spectators; games are exciting not only for players but also for spectators.Live commentaries of games and comments on video are known as supportable for the spectators [3]. All visualized items may be able to support the spectators [4]. For board games like Chess and Othello, visualization methods have been proposed to support the spectators [5]. Visualization methods have been studied that can support spectators [7] because not all of the spectators knows the game rules. For Japanese Chess, there are visualization methods for the spec-tators [8]. However, few methods have supported beginners as the spectators in watching Japanese Chess games.
We have proposed a supporting interface for the beginners of Japanese Chess in watching the games [1]. The interface evaluates and visualizes king’s threat and battle fields on a
1-1-1, Nojihigashi, Kusatsu, Shiga 525-8577, Japan, E-mail: [email protected] .
College of Infromation Science and Engineering, Ritsumeikan University
game board. Experimental results for the interface showed that the participants with the interface could understand the positions of games more. However, there may be any items to be evaluated and visualized for the beginners. Some of the participants mentioned that the putting timing of a captured piece is unclear and the value of player’s action is also unclear even if they use the interface. They also mentioned that player’s tactics are also unclear. We found that the three items should be visualized for the beginners.
This paper proposes a new supporting interface for the beginners of Japanese Chess in watching the games. The new interface is built up by adding the above three items to the previous interface.
II. PREVIOUSSUPPORTINGINTERFACE INWATCHING
JAPANESECHESSGAMES
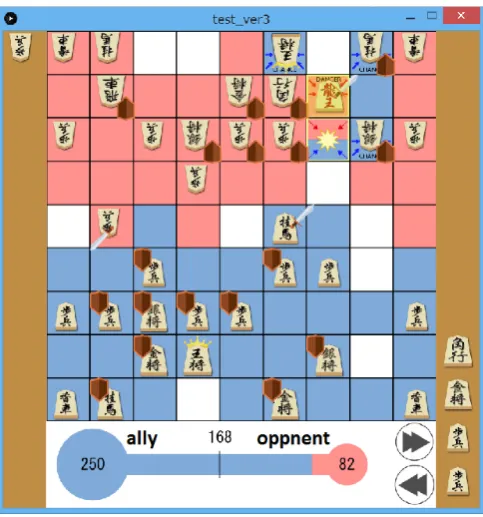
A supporting interface in watching Japanese Chess games has been proposed in our previous work [1]. The example of visualization by the interface is shown in Fig. 1. The interface supports for the beginners of Japanese Chess to understand the positions of a game. The position means which player is superior in a games: the interface evaluates and visualizes two items: the threat of a king and the battle fields where pieces are captured each other.
In the evaluation of the threat of a king, the interface firstly evaluates the power of defense for each king. In Japanese Chess games, a player’s king will lose if the king is checkmated even if the player’s pieces attack the opponent’s king. The power of defense directly effects on the threat of a king. The interface evaluates which piece is attacking the opponent king and which piece is defending the ally king. Then, the interface calculates the difference between the defending value and the attacked value for the player’s king. The difference is used as a value for defending power for a king. The interface subtracts the value for defending power of the opponent king from the value of the ally king. The difference is used as a value for the threat of the ally king. The gauge in the bottom of Fig.1 shows the threat of the ally king. The number in the center of the gauge is the value of the threat of the ally king. The number on the left side is the value of defending power for the ally king while the number on the right side is the value of the opponent king. Fig.1 shows that the player of the ally king is superior to the player for the opponent king.
Fig. 1. Supporting interface for the beginners watching Japanese Chess games. The interface has been proposed in our previous work.
The interface visualizes a square with an icon as a battle filed where pieces may be captured each other. We prepare three types of icons for visualizing the battle fields. The first one is for a square where the number of defending pieces is equal to the number of attacking pieces. The example is shown in a square in the second column from right side and in the third row from the top in Fig.1. The second one is for a square where the the number of defending pieces is more than the number of attacking pieces. The example is shown in a square in the second column from right side and in the third row from the top in Fig.1. The third one is for a square where the the number of defending pieces is less than the number of attacking pieces. The example is shown in a square in the third column from right side and in the third row from the top in Fig.1. The interface visualizes which player defends each square. In Fig.1, blue colored squares are defended by the player of the ally king while pink colored squares are defended by the player of the opponent king.
We conducted evaluation experiments to verify the effi-ciency of the interface. The experimental results showed that participants with the interface watched games for a longer time, and they gave more speeches about understanding the positions of a game. We verified the efficiency of the interface in supporting the beginners watching Japanese Chess games. However, the participants mentioned that the putting timing of a captured piece is unclear and the value of player’s action is also unclear even if they use the interface. They also mentioned that player’s tactics are also unclear. We found that the three items should be visualized for the beginners.
III. ADDITIONAL VISUALIZATION PROPOSED IN THIS PAPER
[image:2.595.303.540.61.128.2]This section explains our new interface for Japanese Chess beginners.
Fig. 2. Changing appearance of a gauge of a captured piece every turn
A. Visualization of Putting Timing of a Captured Piece
Japanese Chess is similar to European Chess in the rules and the condition of victory. However, in Japanese chess, the players can use the captured pieces from their opponent players as their own pieces. The rule does not exist in European Chess. The beginners of Japanese Chess may have difficulties in understanding the putting timing of a captured piece. Therefore, the new interface visualizes the putting timing of a captured piece. The visualization may support for the beginners to understand the positions of a game.
The interface uses a gauge to visualize the putting timing. Suppose that a piece captured in turn t1 is put on a square
in turn t2+ 1. The length of a gauge becomes bigger as
the progress of turns. At turnt1, the length of a gauge is at
minimum. At turnt2, the length of the gauge is at maximum.
The length of a gauge of a captured piecegauge(t)is given by Eq.(1).
gauge(t) =M AXGAU GE∗ t−t1+ 1 t2−t1+ 1
, (1)
where,t1≤t≤t2andM AXGAU GEis the longest gauge.
The interface setM AXGAU GE to 83 pixels.
Fig.2 shows the changing appearance of a gauge of a captured piece every turn. The gauge is visualized with red colored next to a captured piece. Users of the interface can understand the putting timing of a captured piece by watching the progress of the gauge. The gauge progresses every turn. If the length of a gauge is at maximum, the captured piece is used in the next turn. The users may enjoy predicting which square the captured piece is put on.
B. Visualization of the Value of Player’s Action
Players of Japanese Chess Game put pieces on squares to capture each opponent king. Each action of a player is not equal value in a game: some of the actions may become more important actions in the game. The more important actions directly relate to the victory of the game.
The interface in our previous work showed the threat of the ally king with a gauge and three values. The visualization items might support the beginners to understand the positions of a game. However, the visualization items might not support them to notice the value of player’s action. Therefore, the new interface evaluates the value of player’s action and visualizes the value with a highlight backside of a piece. The new visualization item may support the beginners to notice the value of player’s action.
Fig. 3. Three types of highlight to visualizing the value of player’s action
Fig. 4. Template of a tactic “Mino Castle”
1) If 50≤d(t, t+ 1)<75, then the width is set to 80*80 (shown on the left side in Fig. 3).
2) If 75 ≤ d(t, t+ 1) < 100, then the width is set to 100*100 (shown on the middle in Fig. 3).
3) If 100 ≤d(t, t+ 1), then the width is set to 120*120 (shown on the right side in Fig. 3).
The values in the above conditions have been decided empirically.
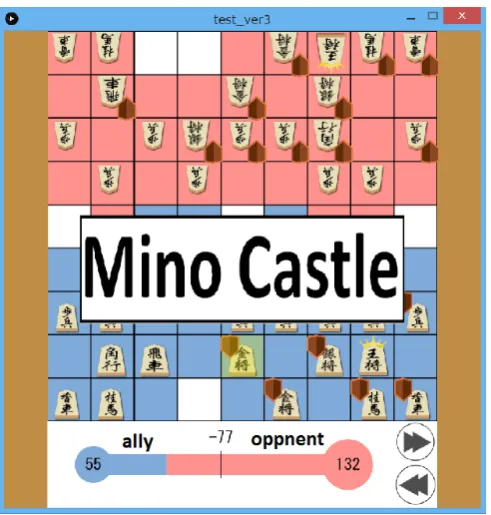
C. Visualization of Tactics by Players
There are more than 150 types of tactics in Japanese Chess. Players of Japanese Chess game select their tactics in their playing. However, the selected tactics are not shown on the board. The beginners of Japanese Chess game may not be able to understand which tactics are used in the game. The interface evaluates and visualizes their tactics in the game to support for the beginners.
In evaluation of the tactics, the interface uses templates of tactic. The template is a matrix which size is 9∗9 (which size is the same as the size of a game board) and that has relations between squares and pieces. Fig.4 shows an example of the templates that shows a tactic “Mino Castle.” The interface can evaluate 12 tactics shown in Table I. The interface matches each template with a game board every turn. If a tactic is matched, the interface visualizes the name of the tactic on the game board. Fig.5 shows an example of visualization of tactic.
TABLE I
12TACTICS EVALUATED BY THE INTERFACE
Tactic names
Climbing Silver, Fourth File Rook, Third File Rook, Quick Ishida, Cheerful Central Rook, Right Fourth File Rook, Mino Castle, High Mino, Half Mino, Diamond Mino, Silver Mino, Gold Yagura
Fig. 5. Example of visualization of tactic
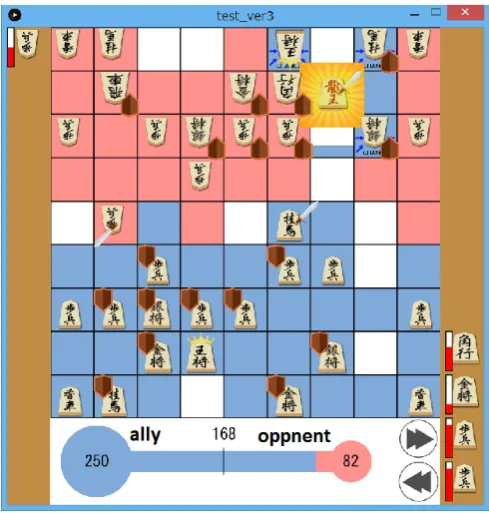
D. New Supporting Interface for the Beginners Watching Japanese Chess Game
Fig. 6 shows the new interface proposed in this paper for the beginners of Japanese Chess games. Next section explains the evaluation experiments of the new interface.
IV. EVALUATIONEXPERIMENT
We conducted evaluation experiments to verify the effi-ciency of the proposed interface in understanding the posi-tions of games.
A. Procedures of the experiments
We asked 6 participants to join the experiments. The participants did not know the rules of Japanese Chess and could not understand the positions of games. They were two men and four women in their age of 20s. We divided them into two groups. One of the group was the experimental group while the another was the control. The participants of the experimental group used the proposed interface in watching games. Those of the control group used the in-terface proposed in our previous work.
We explained visualized items on the interface to the participants. We asked them to understand the positions of a game while watching and speak out what they think. Table II shows information of used games.
We counted up the numbers of utterances:
[image:3.595.70.264.198.372.2]Fig. 6. Example of new interface of study
TABLE II
USED GAME INFORMATION IN THEEVALUATIONEXPERIMENT
# Game Player1 Player2 Date 1 Ryuo Toshiaki Kubo 9Dan Hiroyuki Miura 9Dan 26th, July, 2016 2 Osho Yoshiharu Habu 3Crown Yasumitsu Sato 9Dan 21th, Nov., 2013 3 Oi Yuta Furumori 4Dan Toshiaki Kubo Osho 5th, Oct., 2018 2) the numbers of utterances about captured pieces, the
value of player’s action, and tactics.
The new interface visualizes more items than the interface in our previous work. The numbers of the above utterances of the experimental group might be bigger than that of the control group.
B. Experimental Result
Table III shows the numbers of utterances about questions and understanding. Table IV shows the numbers of utterances about captured pieces, player’s actions, and tactics.
TABLE III
NUMBERS OF UTTERANCES ABOUT QUESTIONS AND UNDERSTANDINGS BY THE SIX PARTICIPANTS
Control group Experimental group
Participant Question Interpretation Question Interpretation
1 10 10 32 6
2 5 0 11 11
3 21 12 11 1
Average 12 7.3 18 6
TABLE IV
NUMBER OF UTTERANCES ABOUT CAPTURED PIECES,THE VALUE OF PLAYER’S ACTION,AND TACTICS
Participant Control group Experimental group
1 1 4
2 1 13
3 0 2
Average 0.6 6.3
V. DISCUSSION
The averaged number of utterances about questions of the experimental group was bigger than that of the control group (12<18). The interface of the experimental group visualized more items than that of the control group. The bigger average might be obtained by increasing of items.
The averaged number of utterances about interpretations of the experimental group was smaller than that of the control group (7.3<6). The participants of the experimental group might be confused in interpretating the positions of games because more items were visualized on the interface. The smaller average might be obtained by the same reasons.
The numbers of utterances of the experimental group about captured pieces, the value of player’s action, and tactics were bigger than the control. The results indicate that the three items caused effects on user’s watching of games.
VI. CONCLUSION
This paper proposes a supporting interface for beginners of Japanese Chess in watching games. We added new visualized items to the interface that have already proposed in our previous work. The added items are the putting timing of a captured piece, the value of player’s action, and tactics of players. The putting timing of a captured piece is visualized with a gauge next to a captured piece. The gauge supports the beginners to know when the captured piece is put on a square of a game board. The value of player’s action is visualized with a width of highlight backside of a piece. The width is obtained from the amount of difference of king’s threat. The beginners understand the value of player’s action from the width of highlight. The tactics of a player is visualized as an image of tactic name. The image supports the beginners to understand which tactic is selected by a player.
We conducted the evaluation experiments to verify the efficiency of the proposed interface. We asked the partici-pants of the experiments to think the positions of a game while watching a game, and speak out everything what they thought. Experimental results showed that the number of speeches of the participants using the proposed interface was bigger than that using our previous interface. Especially, the number of questions of them using the proposed interface was bigger while the number of interpretations was almost the same as the previous interface. The participants using the proposed interface gave more speeches about captured pieces, the value of player’s action, and players’ tactics. The result indicated that the proposed interface supported the participants watching games. Some of the participants gave speeches about predictions of the next action by a player. The speeches indicated that the proposed interface might be able to support the beginners to predict the future situation of a game.
ACKNOWLEDGMENT
This research have been partly supported by HAYAO NAKAYAMA Foundation for Science & Technology and Culture.
REFERENCES
[1] Yoko Nishihara, Reona Takayama, Kensuke Hishida, Ryosuke Ya-manishi, Enjoy Watching Japanese Chess Games like Football: an Evaluation Method of Game Positions for Beginners, CHI PLAY 2018, pp.569–575, (2018).
[2] Roger Hare, Shogi - Japanese Chess 13th September 2003
[3] Effie Karouzaki and Anthony Savidis: A Framework for Adaptive Game Presenters with Emotions and Social Comments, International Journal of Computer Games Technology, pp.1–18 (2012).
[4] G¨unter Wallner and Simone Kriglstein: An introduction to gameplay data visualization, Game Research Methods, pp. 231–250 (2015). [5] Luz Rello and Sergi Subirats and Jeffrey P. Bigham: An online Chess
game designed for people with dyslexia, Proceedings of the 13th Web for All Conference, (2016).
[6] Rogerson, Melissa J. and Gibbs, Martin R. and Smith, Wally: What can We Learn from Eye Tracking Boardgame Play?, Extended Ab-stracts Publication of the Annual Symposium on Computer-Human Interaction in Play, pp.519–526, (2017).
[7] Marios Bikos and Yuta Itoh and Gudrun Klinker: An Interactive Augmented Reality Chess Game Using Bare-Hand, Proceedings of 2015 International Conference on Cyberworlds, (2015).