REVIEW ARTICLE
ON INTERFERENCE GRAPHS
Yegnanarayanan, V
1and Thamarai Selvi, V
1
Department of Mathematics, Velammal Engineering College,Chennai
2Research and Development Centre, Bharathiar University,
ARTICLE INFO ABSTRACT
Interference due to transmissions by adjacent
wireless network can be modeled using a Unit Disc Graph (UDG). We investigate the reliability associated with using the clique number instead of the chromatic number of the UDG while computing the interference. In our extensive simula
networks, we observed that the clique number and the chromatic number values were typically very close to one another and the maximum deviation was much less than
implies very high reliability in the p
INTRODUCTION
The transmission interference between nodes in a wireless network affects network performance in a number of ways. For example, the extent of this interference must be determined in order to find the capacity of the network (Jain et al., 2003). However, determining this interference is an important and difficult problem in itself. The interference problem can be modeled using graph-theoretic techniques, in particular the theory associated with Unit Disc Graphs (UDGs). As explained below, the chromatic number of a UDG model of a wireless network is directly related to interference. Closely related to the chromatic number is another graph invariant, the clique number, and is known in special cases to equal the chromatic number. For most classes of graphs, computing the chromatic number and clique
*Corresponding author: [email protected]
number is NP
that cannot be solved in polynomial time). However, in UDGs, while the chromatic number problem is still NP
can be determined in polynomial time. This raises the question: What is the frequency of scenarios in whi
vicinity
The primary goal of this paper is to investigate through simulations the accuracy of approximating the chromatic number with its clique number in UDGs. More spe
estimate of the fraction of instances when the chromatic number equals or is very close to the clique number in randomly generated UDGs.
Unit Distance graphs
In a
E, there is an edge and
ISSN: 0975-833X
International Journal of Current Research
Vol.11, pp.187-191, December
Key words:
Wireless interference, Clique number, Chromatic number, Unit disk graph, Imperfection ratio
Article History:
Received 12th September, 2010
Received in revised form 15th October, 2010
Accepted 13th November, 2010 Published online 28th December, 2010
ARTICLE
ON INTERFERENCE GRAPHS-II
and Thamarai Selvi, V
2Department of Mathematics, Velammal Engineering College,Chennai-600066, India.
Research and Development Centre, Bharathiar University, Coimbatore-641046, India.
Interference due to transmissions by adjacent nodes in a multi-hop wireless network can be modeled using a Unit Disc Graph (UDG). We investigate the reliability associated with using the clique number instead of the chromatic number of the UDG while computing the interference. In our extensive simulations with UDGs of random networks, we observed that the clique number and the chromatic number values were typically very close to one another and the maximum deviation was much less than the theoretical bounds. This implies very high reliability in the proposed approximation.
number is NP-complete (hardest among problems that cannot be solved in polynomial time). However, in UDGs, while the chromatic number problem is still NP-complete, the clique number can be determined in polynomial time. This raises the question: What is the frequency of scenarios in which the clique number value equals or is in the
vicinity of the chromatic number value of a UDG?
The primary goal of this paper is to investigate through simulations the accuracy of approximating the chromatic number with its clique number in UDGs. More specifically, we would like an estimate of the fraction of instances when the chromatic number equals or is very close to the clique number in randomly generated UDGs.
Unit Distance graphs
In a UDG G(V, E) with vertex set V and edge set E, there is an edge uv between vertices (nodes) a
and b if and only if (iff) the Euclidean distance
ternational Journal of Current Research , December, 2010
INTERNATIONAL JOURNAL OF CURRENT RESEARCH
between a and b d(a,b) is less than or equal to 1 i.e.
E ={uv | d(u,v) ≤1,∀u,v∈V}. The chromatic number
Fig.1 Weighted UDG G and its Transformation G’. Weights in G are given in parentheses
χ(G) is the minimum number of colors required to
color the vertices of G such that no two adjacent vertices share the same color. A clique is a complete (fully interconnected) sub-graph in G, and a maximal clique is a clique that is not contained in any larger clique. The clique number or maximum clique number ω(G) is the maximum size of all maximal cliques. Assume that we are given n nodes (1, 2…, n), and their respective position coordinates in 2D. If these nodes are thought of as nodes in a wireless network, then the following two definitions will be useful:
transmission range (TR) of a given node is defined
as the maximum distance at which the node’s transmission can be successfully received, and all nodes that lie within the transmission range of the given node are called the communicating neighbors of that node. The interference range (IR) is defined as the maximum distance at which a given node’s transmission can interfere with or corrupt a simultaneous transmission or reception attempt by another node, and all nodes that lie within interference range of a given node are interfering neighbors of the given node. Clearly all communicating neighbors are interfering neighbors as well. We treat the case in which IR is the same for all nodes. The following discussion is relevant to any mode of channel access that uses time slots (TDMA, CSMA, etc.).
The UDG formed by taking the nodes in the wireless network as its vertices, and normalizing the distance to IR is the interference graph of the network. If the two nodes share an edge, it means that they are mutually interfering and hence they cannot transmit simultaneously in the same
timeslot. If all nodes require identical number of transmission timeslots per second to suit their traffic requirements, then the number of timeslots per second required to satisfy the traffic requirement of all the nodes in the network can be obtained by optimally coloring the nodes of the UDG. That is, the chromatic number gives the minimum number of timeslots required per second in this scenario. However, such a balanced load scenario rarely occurs in the real world.
The unbalanced load scenario, wherein the traffic rates of each node need not be identical, is more practical. Let a vector of integers R =
[r1,r2,..,rn] be specified and an element riin the R
vector be the number of transmission timeslots required per second by node i to satisfy its traffic needs. The UDG can be now termed as a weighted
UDG, wherein each node has a weight associated with it. To find out the optimal number of timeslots required per second in case of a weighted UDG, we must use weighted vertex coloring (Gerke et al.,
2001) algorithms, which is simply normal (unweighted) coloring done on a transformed graph
G’. The graph G’(V’, E’) is obtained from G(V,E)
by replacing each vertex v in G by a clique of size
rv, where rvis the rate requirement of node v. The
edge set E is augmented to obtain E’, such that if two nodes u, v ∈V were neighbors in G, then in G’
every node in the clique corresponding to u is also a neighbor of every node in the clique corresponding to node v. The chromatic number of
G’ is the minimum number of timeslots per second required to satisfy the unbalanced traffic needs of the nodes in the network. Figure 1 gives an example of a weighted UDG and its corresponding transformation. If the UDG in Fig. 1 corresponds to a wireless network, then the minimum number of timeslots required to satisfy the traffic requirements of the nodes in the network equals 5, which is also the value of χ(G’) of the UDG G’.
The clique number (ω) of any graph lower bounds the chromatic number (χ) of the graph. In the special case of a “Perfect Graph” (Ramirez-Alfonsin and Reed, 2001) χ and ω have equal values in every induced subgraph, but we are only interested in the relationship between χ(G) and
ω(G) for the given graph G and not for the induced
important to note that even non-perfect graphs can have equal values for χ and ω. While the chromatic number problem on a UDG is still NP-complete, the clique number problem can be solved in polynomial time in UDGs (Clark et al., 1990). Thus when χ(G) = ω(G) for the given UDG, the timeslot allocation problem can be solved in polynomial time.
Previous work
In (Graf et al., 1998), the chromatic number of an unweighted UDG G is upper bounded as 6ω(G) – 6. For weighted UDGs, the authors in (Gerke and McDiarmid, 2001) introduce the metric “imperfection ratio”, imp (G), of a transformed weighted graph, defined as the supremum of the ratio of its chromatic number to its clique number. The supremum is computed over all possible weight vectors R. They also bound imp(G) as: imp(G) = sup( χ(G’)/ ω(G’)≤ 2.155. The authors in (Gerke and McDiarmid, 2001) also mention that
the imp(G) = 1 iff G is perfect, and also speculated
that the bound could be improved to 1.5 for non-perfect UDGs. The authors in (Gupt et al., 2004) while developing a mathematical model for computing feasible rate vectors in ad-hoc networks, make use of the theoretical bound on imp(G) in their optimization problem. They also note that the observed imp(G) was significantly lower than the theoretical bound in (Gerke and McDiarmid, 2001). In most cases, their model computes rate vectors that are overly conservative with respect to the optimal values due to the use of the imp(G)
bound in their rate constraints. They make an argument that the bound of 2.155 needs to be present to account for the worst-case scenario. In light of this very conservative approach, one is interested in investigating the frequency of occurrence of worst-case-like scenarios, and more importantly the “closeness” of the clique number and chromatic number values in non-worst case scenarios. To the best of our knowledge, no such study has been documented to date.
Analysis
Mathematical analysis to provide information on the closeness of chromatic number and clique number seems very difficult to do. The other
approach is to employ an exhaustive search method over all possible weight vectors for all possible UDG combinations. Clearly, the second approach is infeasible. However, in the context of wireless networks, the maximum rate (weight) can be bounded. More specifically, it is quite reasonable to assume that the ratio of maximum traffic rate to the minimum traffic rate in a wireless network does not exceed some bound. While an exhaustive search will still not be possible even with a bounded maximum weight, one can conduct experiments that will search through a large number of scenarios. Pradeepkumar Mani, David
W. Petr [10] in their study restricted themselves to
the following problem: Given a node i, what is the total number of timeslots required per second to satisfy the traffic needs of i’s interfering neighbors? In other words to compute the interference as sensed by node i due to the transmissions of its interfering neighbors. Note that part of the interfering traffic may be generated by node i’s communicating neighbors for node i itself. However, to make no such distinction they only computed the total number of timeslots required per second for node i’s interfering neighbors. The total number of timeslots required by node i’s
neighbors is the total interference sensed by node i. In a graph-theoretic sense, to analyze the coloring properties of the UDG that is formed between nodes that lie within a circle of radius 1. In this case, the chromatic number of the UDG exactly equals the interference sensed by node i.
To assess closeness of χ and ω, they defined the measure partial imperfection ratio (PIR) of a graph G, defined as the ratio χ (G)/ω(G) for a given weight vector R. PIR values closer to 1 indicate very high closeness. The following is their simulation scenario: They assumed the simulation area to be a disk of radius 1. They placed n nodes in randomly chosen locations within the disc. Node
i is assigned an integer weight ri that corresponds
to its traffic requirements. The weights are chosen randomly having a uniform p.m.f in {1, 2,.., K}, where K corresponds to the maximum weight. To study the influence of nodal density on PIR, they varied n as 10, 25, 50, 75 and 100. Also, to study the effect of having various node traffic rates, they independently varied K as 1, 5 10, 20, 30, 40, and 50. It has to be noted that the mean weight assigned
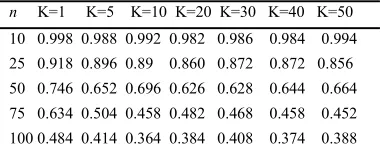
Table 1. Fraction of Instances when χ = ω (PIR-1.0) for various nodes (n) and maximum weight (K)
n K=1 K=5 K=10 K=20 K=30 K=40 K=50
10 0.998 0.988 0.992 0.982 0.986 0.984 0.994
25 0.918 0.896 0.89 0.860 0.872 0.872 0.856
50 0.746 0.652 0.696 0.626 0.628 0.644 0.664 75 0.634 0.504 0.458 0.482 0.468 0.458 0.452
100 0.484 0.414 0.364 0.384 0.408 0.374 0.388
Table 2. Maximum Value of PIR (X-PIR) for various nodes (n) and maximum weight (K)
n K=1 K=5 K=10 K=20 K=30 K=40 K=50
10 1.200 1.125 1.100 1.152 1.099 1.208 1.152 25 1.091 1.184 1.113 1.103 1.102 1.087 1.103 50 1.136 1.083 1.123 1.097 1.101 1.122 1.085 75 1.103 1.073 1.083 1.105 1.064 1.091 1.072 100 1.089 1.071 1.086 1.070 1.078 1.067 1.092
Table 3. Mean Value of PIR (M-PIR) for various nodes (n) and maximum weight (K)
n K=1 K=5 K=10 K=20 K=30 K=40 K=50
10 1.000 1.001 1.001 1.001 1.001 1.001 1.000 25 1.006 1.004 1.003 1.005 1.004 1.004 1.004 50 1.011 1.009 1.007 1.008 1.008 1.007 1.008 75 1.012 1.012 1.011 1.010 1.011 1.011 1.011 100 1.014 1.013 1.012 1.012 1.010 1.011 1.012
to a node in UDG G is 0.5(K+1), and hence the mean number of nodes in UDG G’ is 0.5n (K+1). Thus, the smallest mean size of the UDG (in terms of number of vertices) in their study is 10, and the largest is 2550. An experiment comprised 500 simulations conducted for a given (n, K) pair. For each experiment, the mean PIR value (M-PIR), the
maximum PIR value (X-PIR) and the percentage
of instances when the PIR value exactly equaled
1.0 (PIR-1.0) were observed. They used MATLAB
to generate graphs in DIMACS (http://prolland.free.fr/works/research/dsat/dimacs.html)
format. For optimal coloring, they used the DSATUR program (http://mat.gsia.cmu.edu
/COLOR/color.html) written in C, and to compute
the maximum weight clique, they used the
CLIQUERsoftware http://users.tkk.fi/~pat/cliquer.html, also written in C. Tables 1-3 show the results obtained. From Table 1, it can be seen that the PIR value equaled 1.0 more often for lower number of nodes in G, and the number of instances when the PIR value did not equal 1.0 increased steadily with
an increase in the number of nodes in G. The maximum, minimum and average PIR-1.0 values were 99.8%, 36.4% and 68.6%. From Table 2, it can be seen that the observed X-PIR values are quite close to 1.0 with the mean value being 1.106 (i.e. mean value of maximum deviation is 10.6%). The maximum value is 1.2079, far less than the conjectured upper bound of 1.5 or the theoretic upper bound of 2.155. Table 3 shows that the M-PIR values lie very close to 1 for all scenarios, with the maximum of the M-PIR values being 1.0138, which implies that, on an average, the observed deviation between the chromatic number and the clique number was less than 1.4%. The mean of all M-PIR values was 1.007. While the worst-case PIR-1.0 value seems discouraging, it has to be viewed in conjunction with the M-PIR and X-PIR values, which suggest that the deviations between χ and ω, if any, were negligible the vast majority of the time. Thus, we now have evidence to believe that the theoretical bound of 2.155 very rarely holds in practice, and using this bound almost always grossly over-estimates the actual chromatic number and severely under-estimates the available wireless network capacity (by around 50% in most cases).
Conclusion
REFERENCES
Clark, B.N., Colbourn, C.J. and Johnson, D.S.1990. “Unit Disk Graphs”, Discrete Mathematics, 86:165-177.
Gerke, S. and McDiarmid, C. 2001. “Graph Imperfection”, Journal of Combinatorial
Theory, Series B, 83(1), 58-78.
Graf, A., Stumpf, M. and Weienfels, G. 1998. On coloring unit disk graphs. Algorithmica,
20(3):277-293.
Gupta, R., Musacchio, J. and Walrand, J. 2004. Sufficient Rate Constraints for QoS Flows in Ad-Hoc Networks”. UCB/ERL Tech.
Memorandum M04/42.
Jain, K., Padhye, J., Padmanabhan, K. and Qiu, L. 2003. Impact of Interference on Multi-hop Wireless Network Performance”,in Proceedings of ACM/IEEE MobiCom, pp 66-80
Pradeepkumar Mani, David W. Petr, 2007. “Clique Number Vs. Chromatic Number in Wireless Interference Graphs: Simulation Results”,
Technical Report, Information and
Telecommunication center, The University of Kansas.
Ramirez-Alfonsin J., Reed B. (Editors),2001.
Perfect Graphs J.H. Wiley and Sons,
Chichester U.K.