Particle Swarm Optimization and Support Vector
Machine for Vehicle Type Classification in Video Stream
Andriansyah Zakaria
Dep. of Information System Diponegoro University
Semarang, Indonesia
R. Rizal Isnanto
Dep. of Computer Engineering Diponegoro University
Semarang, Indonesia
Oky Dwi Nurhayati
Dep. of Computer Engineering Diponegoro University
Semarang, Indonesia
ABSTRACT
Detection, tracking, and classification of vehicles is the most important stage of computer vision applications in Intelligent Transportation Systems. In this study, vehicle detection was carried out using a background subtraction method in which the background was modeled using frame differencing background subtraction and contours as models of objects. The extraction of geometric features from the vehicle contour is used as input to Support Vector Machine (SVM) with the Radial Basis Function (RBF) kernel to classify vehicle types in combination with particle swarm optimization (PSO) to select optimal C and gamma parameters. This study resulted in a sensitivity of 85.71%, specificity of 83.33%, accuracy of 85%. With an average accuracy for object tracking is 90%.
Keywords
Intelligent Transport System, Background Subtraction, Particle Swarm Optimization, Support Vector Machine, Contour Detection, Video.
1.
INTRODUCTION
Intelligent Transportation System is a method used for traffic management so that the transportation system is more efficient. The use of video cameras for traffic monitoring is an example of an intelligent transportation system application. Data such as the number of vehicles and vehicle speed can be easily obtained [1]. Traffic monitoring systems using radar and magnetic sensors have problems in the complexity of hardware and some parameters of traffic conditions such as the number of vehicles, type of vehicle, and average vehicle speed. This can be overcome by using a computer vision algorithm because it only requires video frame footage from the traffic surveillance to do the same job [2]. Traffic surveillance can be used for detection, tracking, classification, monitoring traffic violations, counting the number of vehicles, etc [3].
Traffic surveillance system can be divided into three parts, detection, tracking and classification of vehicles. Several algorithms are available in the literature to complete this work. To detect moving objects from video data can use background subtraction methods [4].
Background subtraction is a method often used to detect moving objects on a video. Compared to the detection of vehicle objects using a single image, the detection using sequential frames from a video is easier because the foreground movement has significant movement and the background is assumed to be static, so moving vehicle objects on the video frame can be detected from foreground segmentation [5]. Frame Differencing is a method of background subtraction that can be used to detect moving
objects effectively, by subtraction the current video frame with the previous video frame, then thresholding process is carried out to get moving objects [4].
The next thing besides detecting vehicle objects is tracking vehicle objects. One method used is the contour tracking method, it can be done by estimating contour changes by matching the foreground and background features [6]. The main purpose of the vehicle classification process is to identify the type of vehicle in a class that has been defined previously. Feature extraction is a process of dimension reduction where information conveyed by a large image is expressed using its characteristics. Good features must be informative, resistant to noise, fast to calculate at the same time, and unique. Common features used for image classification are color, geometry, gradient, eigen vector, and others. Geometric features such as width, height, and the ratio between widths and height of vehicle obtained from video cameras are used to classify and vehicle counting. Geometry features also have good performance used in real-time systems for tracking and contour detection for finger movement recognition [7].
Support Vector Machine (SVM) is a supervised learning model that effective for classification and pattern recognition purposes, which aims to find the best hyperplane which separates two classes in the input space based on Structural Risk Minimization and Vapnik Chervoneks dimensions to obtain best generalization capabilities. SVM has several advantages such as short training time, good generalization performance. Selection of parameters is a very important problem in SVM research, learning ability and generalization performance depend on the selection of SVM parameters [8]. Particle Swarm Optimization (PSO) is an optimization algorithm proposed by Kennedy and Eberhart in 1995. PSO works based on the behavior of flocks of birds looking for food. PSO is looking for optimal solutions with individual cooperation. PSO is used on nonlinear problems to determine the best parameters on optimization problem dimensions that have high performance and reduce to half the computational process in achieving the target (food). The combination of PSO and SVM algorithms produces better accuracy compared to conventional SVM [9].
In this research is concentrated on developing algorithms for classifying vehicle types into two classes, Light Vehicles (LV) and Heavy Vehicles (HV) on video data using SVM, and PSO as an optimization algorithm for selecting the best SVM parameters. Detection only focuses on moving vehicles.
2.
RELATED WORK
subtraction techniques. The first step in this technique is to model the background. Each sequence of the video frame is compared to the reference model to determine the possibility of pixel variations indicating the presence of a moving object [10]. Frame differencing is one of the background subtraction techniques. Moving objects can be detected by subtracting the frame image at time t with the background model. Then the deduction value is compared with the threshold value, if the result of the subtraction exceeds the threshold value then the object is a moving object. Frame Differencing produces good accuracy in detecting vehicles on video data [4].
Feature extraction can be used to help the introduction of visual objects. Each object type of vehicle has different physical characteristics, each feature of a vehicle object that is extracted properly from the result of the camera capture, the detected vehicle object can be classified properly according to its type. Feature geometry such as height, width, and high-width ratio are used as characteristics to classify vehicles with high accuracy and minimal use of resources so that they are suitable for real-time classification systems [11]. The use of geometry feature extraction was also applied to real-time systems, the introduction of commands based on finger movements using tracking and finger contour resulted in an accuracy of 92% [12].
PSO can be used for parameter optimization on SVM with a radial base function (RBF) kernel for voice recognition systems. PSO is used to optimize the combination of C parameters and the best so as to improve SVM accuracy in classifying sound patterns compared to conventional SVM. The combination of PSO and SVM is used for recognition of facial expressions with accuracy as a fitness function to obtain optimal parameters C and [8].
3.
RESEARCH METHODOLOGY
The research methodology used to solve the problem of vehicle classification is described as follows :
3.1
Vehicle Detection
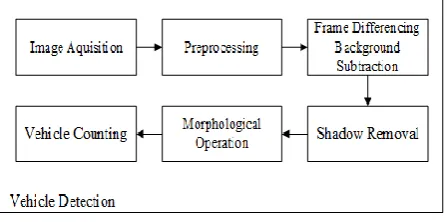
[image:2.595.56.280.533.644.2]The first step is image acquisition obtained from the video camera converted into a sequence of the image frame, to reduce the noise, a simple median filter is performed. The vehicle detection block diagram is shown in Figure 1.
Fig 1: Block diagram of a vehicle detection
3.1.1
Frame Differencing
Moving objects can be detected by subtracting the image frame at time t with the background model. Then the subtraction value is compared to the threshold value to detect the foreground identified as an object. Let Ft and Ft-1 isthe
current frame at time t, and t-1 is the previous frame. After subtraction Ft with Ft-1 , frame difference Dt (x, y) is found as
output.
- - (1)
(2)
The threshold value of T is set to get a binary image from the difference frame Dt (x, y)[13].
3.1.2
Shadow Removal
Strong illumination changes will cause shadows. The shape of shadows change every time and moving to follow the vehicle. Shadow pixels will be considered as foreground pixels, which will affect detection accuracy and subsequent classification stages. At this stage, the threshold value is set to detect the shadow area and delete it from the foreground mask. Assume
is the brightness of the background pixel in
the RGB color space which covered by a shadow on frame t
and let Sti be the observed brightness value for this pixel at
this frame. Then the ratio between Sti and Sbi is used to
threshold the shadow area using the formula:
(3)
The problem of using this threshold method is when the pixel of the vehicle where it meets the condition will be removed from the foreground because it is considered a shadow. So the choice of threshold values β1, β2, and β3 must be precise [2]. In this research, the selected values of β1, β2, and β3 are 0, 0.7, and 2.5.
3.1.3
Morphological Operations
The morphological operation is an operation that works on the topology and structure of objects from the image, where objects will be subjected to structural elements such as reducing or adding the shape of an object. After the background subtraction process is obtained a foreground mask that represents pixels of moving objects in the video. The resulting foreground image object still has noise such as dot pixels and the shape of a vehicle is not perfect. Morphological operations are used to correct images after background subtraction. The operation used in this research is opening and closing. The opening operation aims to remove noise that appears in the foreground image and the closing operation it is useful in closing small holes inside the foreground objects, or small black points on the object [14].
3.1.4
Vehicle Counting
In the previous process, noise that emerged from the background segmentation process was deleted. Therefore binary images of mobile vehicles are obtained. Every blob in a binary image represents a moving vehicle. From this image, the vehicle is detected by the contour. Contour-based detection will provide useful information such as width, height, perimeter, location, and a number of vehicles detected [15]. Every vehicle detected is given a bounding box marker. In this research, only vehicles that have the largest contours are used for subsequent analysis.
3.2
Vehicle Classification
Fig 2: Block diagram of a vehicle classification
3.2.1
Geometric Features
The dataset contains images from light vehicles (LV) such as cars, pick-up, etc. and heavy vehicles (HV) such as trucks, buses, and others. When the size of the two is compared, there is a noticeable difference. Similarly, if we see a vehicle from a different angle, as seen from above, side, or front, the size also varies. So this information can be used to classify vehicles. The position of the point of view of the vehicle will be used in this study. It is assumed that the length and height of the vehicle are denoted as l and h. Then the area of the vehicle is obtained:
(4)
and the ratio between length to height is given by LHR (5)
These two parameters are also used as input vectors for SVM to classify vehicles. The problem using this feature is that it depends very much on the point of view of the camera [2].
3.3
Support Vector Machine
The basic idea of the SVM learning algorithm can be summarized in two steps. First, the input space is converted into linear features of higher dimensional space by nonlinear functions. Then the optimal hyperplane that separates between classes can be built in this higher dimensional feature space. Nonlinear transformations can be realized by defining proper kernel functions. this research uses the kernel Radial Basis Function (RBF) function which is formulated:
- - ) (6)
An important factor influencing SVM performance is parameter selection. Vapnik shows that kernel function parameters and penalty C parameters are significant factors that affect SVM performance [17]. In the RBF kernel function, the parameter γ is given according to the data subspace that has a certain dimension, which limits the level of complexity of the optimal hyperplane in this subspace. Changing parameters γ in the RBF kernel function changes the nonlinear transformation function and the level of complexity of sample distribution in the appropriate data subspace. The error C parameter penalty controls the complexity of the model and estimated errors. When the value of C is higher, the corresponding data fitting degree of data is higher but the generalization ability is reduced. So the SVM performance is determined by the parameters C and γ [11].
3.4
Particle Swarm Optimization
The PSO algorithm simulates the behavior of bird flocks in searching for food and finding optimal value (food) with cooperation. These birds are called particles. Every solution to
the optimization problem is the search space particle. Each particle has a fitness value that is determined by the optimization function, the fitness value is the standard value of the particle. Each particle has the speed to determine the direction and distance of its flight. All particles are initialized as a swarm of stochastic particles and then get the optimal solution through iteration. Each particle updates its speed and location by tracking two values in each iteration, namely the Pbest value which is the optimal solution found by the particle itself and the other is Gbest which is the optimal solution of the whole particle [8].
3.5
SVM Parameters Optimization Based
on PSO
To measure the performance of the combination parameters C and γ are the same as measuring the accuracy of each combination within the specified range. In this research, uses a confusion matrix by calculating the value of sensitivity, specificity, accuracy, and error to estimate each of the best parameter combinations. This value is the fitness value of each particle. The following is the PSO - SVM procedure: 1. Initialization of particle, inertia weights, particle speeds,
dimensions, C1 and C2.
2. Evaluate the fitness value of each particle.
3. Compare the fitness value and determine the best local particles (Pbest) and the best global particles (Gbest). 4. Update the speed and position of each particle until the
value of the fitness function is convergent.
5. After converging, the best global particles (Gbest) on swarm are fed to SVM for the testing process.
6. SVM classification testing.
4.
DESIGN OF RESEARCH
4.1
Material and Tools
In this research, uses video data with the format (.mp4) as input with a frame rate of 30 fps and a resolution of 640 x 480 pixels with a duration of 2 minutes. This video data for implementation. The training dataset, uses 20 vehicle images for each LV and HV class. The tool used by Jupyter Notebook, python 3, OpenCV 3.
4.2
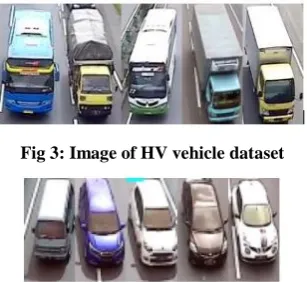
Training Dataset
[image:3.595.352.506.599.740.2]The training dataset contains images of vehicles representing the class to be classified. In this research, the classes to be classified are LV and HV, where each class contains 20 vehicle images. Then the preprocessing image and geometric feature extraction are performed. The image of the HV vehicle dataset is shown in Figure 3. The image of the LV vehicle dataset is shown in Figure 4.
Fig 3: Image of HV vehicle dataset
5.
EXPERIMENTAL RESULT
5.1
Best Parameters SVM Based on PSO
Table 1 shows the results of the fitness value specificity, sensitivity, accuracy and error in the training process PSO - SVM using a training dataset. At the beginning of the training process, the fitness value is initialized with specificity (SPE), sensitivity (SEN), accuracy (ACC) = 0, and error (ERR) = 1 which is the lowest value of SVM performance. The Gbest value that represents the best c and gamma parameters of SVM is obtained during the 6th iteration. Gbest from the 6th to 50th iteration converges to the value of c = 1.2576 and
gamma = 0.9028 with a specificity value = 0.85, sensitivity = 1, accuracy = 0.925, and error = 0.075. The best c and gamma
values are then used for testing the test data for evaluation before being implemented on video data. In this research uses 10% of the dataset to be used as test data.
Table 1. Fitness value of SVM base on PSO.
[image:4.595.344.516.128.227.2]Figure 5 shows the results of the fitness value specificity, sensitivity, accuracy, and error.
Fig 5: Performance of fitness value
5.2
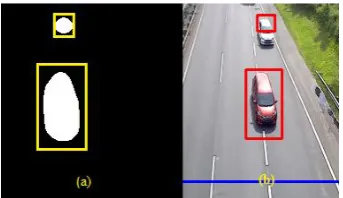
Detection and Counting of Vehicle
The largest vehicle contour of a vehicle object detected will be marked with a bounding box. Because the object keeps moving, object tracking is needed on the contour. Tracking can be done by finding the centroid from the contour then calculating the Euclidean distance between centroid at time t
and t-1. This is to indicate whether the vehicle object at t-1 is the same object as the object at time t. The inter-centroid distance limit used in this research is 40, which gives the best results for counting the number of vehicles. Figure 6 shows the detection of vehicle obstruction from the system.
Fig 6: Object detection (A) Binary image, (B) Original image
[image:4.595.48.266.278.450.2]Table 2 shows the detection accuracy and counting of vehicles:
Table 2. The result of the detection system
Total no. of vehicle 40
Correct detection 36
Accuracy (%) 90
Error (%) 10
From Table 2 concluded from 40 real vehicle objects, the system was able to detect 36 with 90% accuracy.
5.3
The Result of Vehicle Classification
Every vehicle that was detected classified using SVM with the best parameters resulting from training optimization, c = 1.2576 and gamma = 0.9028. To measure the classification performance, a confusion matrix is used. In this research also compare the PSO-SVM classification with conventional SVM. Table 3 shows the results of the vehicle classification process.
Table 3. Confusion Matrix of vehicle classification
Prediction Class
LV HV
Actual LV 24 4
Class HV 2 10
Specifity (%) 83,33
Sensitivity (%) 85,71
Accuracy (%) 85
Error (%) 15
From Table 3 it can be concluded that there are 24 LV vehicles which are correctly predicted as LV, 4 LV vehicles which are predicted to be mistaken as HV vehicles, 10 HV vehicles which are predicted to be true as HV, and 2 HV vehicles which are predicted to be mistaken as LV with specificity 83.33%, sensitivity 85.71 %, 85% accuracy, and 15% error. Some that cause classification errors are segmentation errors, especially in two adjacent vehicle objects that form one vehicle contour object. Figure 7 shows vehicle segmentation errors:
0 0.2 0.4 0.6 0.8 1 1.2
1 2 3 4 5 6 7 8 9 10
Result of Fitness Value
Specifity Sensitivity
Accuracy Error
x SPE SEN ACC ERR Gbest
0 0 0 0 1 0,0521 0,8306
1 0.16 0.35 0.3 0,7 0,0887 0,8437 2 0,58 0,53 0,55 0,45 0,5568 0,8975 3 0,83 0,71 0,75 0,25 1,1973 0,9010 4 0.85 1 0.925 0.075 1,2576 0,9028 5 0.85 1 0.925 0.075 1,2576 0,9028 6 0.85 1 0.925 0.075 1,2576 0,9028 7 0.85 1 0.925 0.075 1,2576 0,9028 8 0.85 1 0.925 0.075 1,2576 0,9028 9 0.85 1 0.925 0.075 1,2576 0,9028
… … … …
[image:4.595.366.490.295.349.2] [image:4.595.316.532.491.601.2] [image:4.595.53.273.497.680.2]Fig 7: Misclassification due to segmentation errors
Table 4. Comparison of classification accuracy between PSO-SVM and conventional SVM
Accuracy
PSO-SVM 85%
SVM 79%
6.
EXPERIMENTAL RESULT
This paper proposes a PSO-SVM technique to optimize the performance of the SVM classifier where used in vehicle classification on video data. The result indicates using a PSO-SVM algorithm can efficiently search a set of value of C and
, which can improve the vehicle classification accuracy. But the time of searching best parameters is increased due to hybrid computing usage. In this case, the use of the vehicle dataset is suitable when using the input parameter of 10 particle. The parameter selection method based on PSO can not only ensure the learning ability of SVM but also improve the generalization ability to some extent. Segmentation methods need to be done better, especially segmentation of vehicle objects that are close together to reduce errors in classification.
7.
REFERENCES
[1] Indrabayu., Bakti, R. Y., Areni, I. S. and Prayogi, A. A. (2017) “Vehicle detection and tracking using Gaussian Mixture Model and Kalman Filter,” Proceedings - CYBERNETICSCOM 2016: International Conference on Computational Intelligence and Cybernetics. [2] Saran, K. and Sreelekha, G. (2015) “Traffic Video
Surveillance : Vehicle Detection and Classification,” 2015 International Conference on Control, Communication & Computing India, (November), Hal. 516–521.
[3] Liu, X., Pan, L. dan Sun, X. (2016) “Real-Time Traffic Status Classification Based on Gaussian Mixture Model,” 2016 IEEE First International Conference on Data Science in Cyberspace (DSC), Hal. 573–578. [4] Xu, L., and Bu, W. (2011) “Traffic flow detection
method based on fusion of frames differencing and background differencing,” 2011 2nd International Conference on Mechanic Automation and Control Engineering, MACE 2011 - Proceedings, Hal. 1847– 1850.
[5] S. Joudaki, M. Sunar, and H. Kolivand, “Background Subtraction Methods in Video Stream: A Review,”
Proceedings of the 2015 4th International Conference on Interactive Digital Media, ICIDM 2015.
[6] J. Ning, W. Yu, and S. Yang, “an Active Contour Tracking Method by Matching Foreground and Background Simultaneously , 2013.
[7] G. Moussa, “Vehicle type Classification with Geometric and Appearance Attributes,” International Journal of Civil,Architectural,Structural and Construction Engineering, 2014.
[8] Zhang, X. and Guo, Y. (2009) “Optimization of SVM Parameters Based on PSO Algorithm,” 2009 Fifth International Conference on Natural Computation, hal. 536–539
[9] F. Ardjani, K. Sadouni, and M. Benyettou., “Optimization of SVM multiclass by particle swarm (PSO-SVM),” 2010 2nd International Workshop on Database Technology and Applications, DBTA2010 - Proceedings, 2010.
[10] I. Pathan, and C. Chauhan., “A Survey on Object Detection and Tracking Methods,” International Journal of Innovative Research in Computer and Communication Engineering., vol. 6, pp. 5212–5215, 2015.
[11] R. Wang, L. Zhang, K. Xiao, R. Sun, and L. Cui., “EasiSee: Real-time vehicle classification and counting via low-cost collaborative sensing,” IEEE Transactions on Intelligent Transportation Systems., vol. 15, pp. 414– 424, 2014.
[12] Gurav, R. dan Kadbe, P. (2015) “Real time finger tracking and contour detection for gesture recognition using OpenCV,” 2015 International Conference on Industrial Instrumentation and Control, ICIC 2015. [13] Sengar, S. and Mukhopadhyay, S. (2016) “A novel
method for moving object detection based on block based frame differencing,” 2016 3rd International Conference on Recent Advances in Information Technology, RAIT 2016.
[14] P. Bhuvaneswari, and T. Kumar.,“ Moving Object Tracking using Background Subtraction Technique and its Parametric Evaluation,” ,2014.
[15] Hsieh, J. W., Chen, L. C., Chen, S. Y., Chen, D. Y., Alghyaline, S. and Chiang, H. F. (2015) “Vehicle color classification under different lighting conditions through color correction,” IEEE Sensors Journal, 15(2), hal. 971–983.
[16] M. Tang, and F. Chen.., (2013) “Facial expression recognition and its application based on curvelet transform and PSO-SVM,” Optik - International Journal for Light and Electron Optics, hal. 5401-5406.