Automatic Pattern Forecasting from Banking Financial
Data
Md Jayedul Haque
Instructor
Department of Computer
Science & Engineering
United International University
Bangladesh, Dhaka
Khairul Mottakin
Senior Lecturer
Department of Computer
Science & Engineering
United International University
Bangladesh, Dhaka
Nazmun Nahar
Department of Computer
Science & Engineering
Bangladesh, Dhaka
ABSTRACT
A very famous adage of Adam Smith, “All money is a matter of belief”. It is, of course, the beginning of the first use of money was observed when the supply of demanded product was available in the hands of others. It can also be said that the introduction of money has introduced us to a system called business. Initially, this system gave rise to the internal economy but later it spread to the whole world. But in the whole world there is a new system emerged for the flow of economy which is known as bank to everyone. And through this bank, a country may be importing or exporting every day. Only the economy of a country is considered good when export is more than import. Due to everyone's attention of better economy, export can be increased and import can be optimized. So, to solve this problem statistics can help us greatly. As Statistics, has been using in determining the existing position of per capita income, unemployment, population growth rate, housing, schooling medical facilities and so on.
In this study not only statistics but also machine learning tools were used to analyze and forecast the financial banking data specifically import data. Basically, import data is known to a country as an economic data. So when it can predict about imports, then deciding how much of the export will be good for economics can easily be determined. In this paper it has been worked with import data of Bangladesh Bank for analysis and forecast the import of Bangladesh, based on collected data to strengthen the economic condition.
Keywords
Financial Informatics, Economics, Statistics, Imports and Exports, Machine Learning.
1.
INTRODUCTION
In the current stage of world several types of professional economists are found working in many scopes and areas. Economists who are employed and recruited by a central bank often provide direction on whether or not interest rates should be changed, while in the private sector, economists often prognosticate future variables such as exchange rate movements and their effect on company exports. Central Bank provide the supremacy over domestic production of a country, demand of internal market and export-import affairs. All these data is known as financial data. As the world’s individual economy exchange their growth along with considered barter system or financial system. The financial system is a framework based on legal agreements between institutions to countries, and both formal and informal economic stakeholders act together to facilitate or control the international flows of financial capital for the sake of investment and trade financing. The noble objective of this
study is to predict the amount of import commodities which is or will be imported from foreign country. It is necessary of evocation to the facts to predict the effect of policy changes, or to forecast what may happen in the future.
2.
LITERATURE REVIEW
seasonality patterns of a selected item in a retail trading chain in Bangladesh. Then demand was extrapolated using conventional Holt-Winter’s model. The same was done again using artificial neural network (ANN) with fuzzy uncertainty. Finally, the errors, measured in terms of MAPE, were compared for finding the best fitting forecasting approach. Greece is a low-productivity economy with an ineffective welfare state, relying almost exclusively on low wages and social transfers. In 2007 G. Atsalakis [4] introduced a new technique in the field of unemployment modeling in order to forecast unemployment index. Techniques from the Artificial Neural Networks and from fuzzy logic have been combined to generate a neuro-fuzzy model. The input is a time series. Classical statistics measures are calculated in order to assess the model performance. Further the results are compared with an ARMA and an AR model. In some prior studies about demand forecasting, traditional statistical methodologies such as moving average, Box- Jenkins were used. Liu et. al. used data mining methodologies for time series and provided improvement in Box - Jenkins time series forecasting results [5]. Since statistical models could not give satisfying results, artificial intelligence algorithms were tried in numerous studies. For instance, Neural Network algorithms were commonly applied in the literature [6-11]. Given studies provided impressive results with NN algorithms. Some subsequent studies combined ANN algorithm with another algorithm with the purpose of providing more successful methodologies. Doganis et. al. used genetic algorithm with RBF neural network algorithm [12]. Aburto and Weber proposed another hybrid model which combined Autoregressive Integrated Moving Average (ARIMA) model with neural network algorithm [13]. In this study, it will use K-means and K-medoids for clustering the data. Eventually, it will use Linear Regression and ANN for forecasting and extrapolating based on data.
3.
BACKGROUND
Bangladesh's economy has many problems. Some of them are just basic problems. The government's efforts to create a good business environment have been slow. Electricity is getting easier but still problematic. The lack of continuation of applicable labor laws. As long as these are not resolved, the economic development of the country will not accelerate. There is considerable difference between economists' definition of economic development. Different people have tried to explain it in the light of their own views. But in general, economic development refers to the growth of real national income by fulfilling the basic needs of the people of every country, which constantly contributes to the reduction of income and expenditure, increasing the employment of the people at the rate of increasing rates and overall efforts of the people to maintain their standard of living. According to Williams and Patrick, "The long-term increase in the per capita production and service of the people of any country or region is called economic development." According to Professor Snider, the long-term or continuous growth process of 'per capita production' is called economic development.
According to the renowned economist Yang, "Development is a complex process of social, economic, political and progress of a person or society."
4.
WORK FLOW
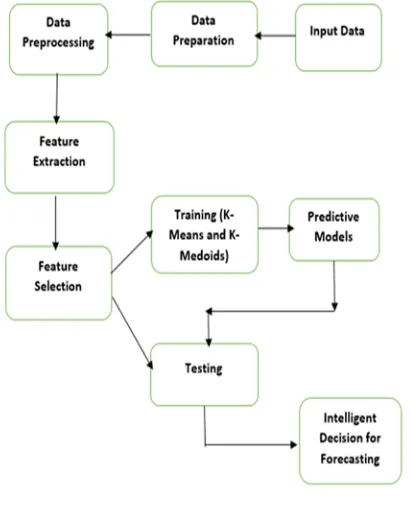
[image:2.595.327.533.268.523.2]The first challenge of this study was collecting data which became easier when it is got permission to access the import data of Bangladesh Bank. After collecting data processing become primal as there were so many categorical entry in the numerical field. So, making numerical data from categorical data was our next duty. Some constant feature were removed to make the computation easier. Then it became easier to apply methodology of clustering and forecasting. After the using of clustering algorithm it has used predictive models to forecast. After getting result it has to take decision based on the result. But in terms of our study the decision defines that based on previous data import of particular product is going to increase or decrease.
Fig 1: Pattern Classification process
4.1
Feature Extraction
Fig 2: Feature Extraction process
5.
METHODOLOGY
In this study, cluster analysis and forecasting methodologies are used. Cluster analysis or clustering is the task of grouping a set of objects in such a way that objects in the same group (called a cluster) are more similar (in some sense or another) to each other than to those in other groups (clusters). In this study two very popular clustering tools means and K-medoids are used. On the other hand Linear Regression and ANN both are extrapolating tools which is used in this study.
5.1
K-Means
K-means (MacQueen, 1967) is one of the simplest unsupervised learning algorithms that solve the well-known clustering problem. The whole procedure takes data as input and make output of several group based on input data. In the beginning of procedure it is defined k centroids, one for each cluster. These centroids should be placed in an intelligent way because of different location causes different result. So, the better choice is to place them as much as possible far away from each other. The next step is to take each point belonging to a given data set and associate it to the nearest centroid. When no point is pending, the first step is completed and an early cluster is done. Now it is needed to calculate again the new centroids k as barycenter of the clusters resulting from the previous step. After we have these k new centroids, a new relationship has to be made between the same data set points and the nearest new centroid. It looks like a loop has been generated because the centroid changed periodically. As a result of this loop it may be noticed that the k centroids change their location step by step until no more changes are done.
5.2
K-Medoids
K-medoids, like K-means, is another classical method which is related to the k-means algorithm and the medoid shift algorithm. Both the k-means and k-medoids algorithms are partitioned (breaking the dataset up into groups) based algorithm. K-means aims to decrease the total squared error on the other hand k-medoids decreases the sum of inconsistency between points labeled to be in a cluster and a point designated as the center of that cluster. In contrast to the k-means algorithm, k-medoids chooses data points as centers. K-medoids is also a partitioning technique of clustering that
clusters the data set of n objects into k clusters with k known a priori. A primal tool for finding k is the silhouette. It could be more robust to noise and outliers as compared to k-means because it minimizes a sum of general pairwise inconsistencies in liew of a sum of squared Euclidean distances. The available choice of the inconsistency function is very rich but in our method we used the Euclidean distance. A medoid of a finite dataset is a data point from this set, whose average dissimilarity to all the data points is minimal i.e. it is the most centrally located point in the set. The most common understanding of k-medoid clustering is the Partitioning Around Medoids (PAM) algorithm.
5.3
Linear Regression
Linear Regression is a statistical tool which is used to make the relationship between two variables by modeling a linear equation to observed data. In this context one variable is considered to be an explanatory variable, and the other is considered to be a dependent variable. For example, a modeler might want to relate the weights of individuals to their heights using a linear regression model. But before trying to build a linear model of observed data, a modeler should first define whether or not there is any relationship between the variables, in short we can say the co-relation between two variables. This does not mean that one variable causes the other (for example, higher income do not cause higher utility), but it can be said that there could be some significant association between the two variables. A scatterplot is considered a very powerful tool in determining the strength of the relationship between two variables. If there appears to be no association between this two variables (i.e., the scatterplot does not indicate any increasing or decreasing trends), then fitting a linear regression model to the data probably will not provide a useful model. A valuable numerical measure of association between two variables is the correlation coefficient r, which is a value between -1 and 1 indicating the strength of the association of the observed data for the two variables.
5.4
Artificial Neural Network
An Artificial Neural Network (ANN) is an information processing model which is now highly used and successful tool in the world which is imitated by the way biological nervous systems works, such as the human brain, process information. The main purpose of this model is to imitate the novel structure of the information processing system like human and make a meaningful output. Like Linear Regression, Artificial Neural Network is also used to make relationship within variables and prediction. It is composed of a large number of highly interconnected processing elements called neurons working in unison to solve a particular problem. ANNs learn by example like human brain. An ANN is used for a specific application, such as pattern recognition or data classification, through a learning process. In biological systems it can be found the synaptic connections that exist between the neurons which is used to transfer information one neuron to another to complete the learning process. Similar to biological hierarchy ANN use same connection between two neurons but virtually not physically.
6.
RESULT AND DISCUSSION
This section provides the necessary result and discussion on the problem.
6.1
Data Introduction
data. But, it has been introduced deputy director of Bangladesh Bank in the acknowledgment section who helped to collect those data. It has been collected "import data" of past seven years from Bangladesh bank. Bangladesh Bank only permitted to access the data from 1993-1999. There were 57 bank, 39 currency, more than 200 country, 14 column and around 7.5 lakh row in this data set. But it can only identify those data with their given code as because of their security. Excel format of data has been given below where it can view the data
.
Fig 3: Overview of Data
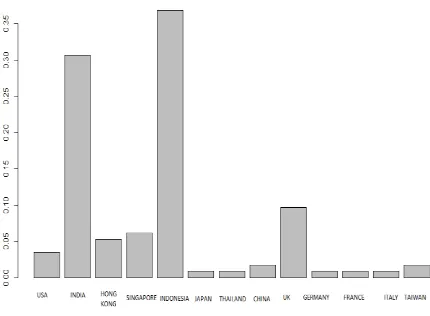
[image:4.595.316.535.246.405.2]An individual product, which name is not known except code as for security concern, has been selected to generate the frequency distribution of several countries that implicates what is the transaction constraint between countries regarding this product. From the graph given below, it shows that the highest number of product has been imported from Indonesia in Bangladesh from 1993 to 1999. After Indonesia subsequent country is the India from where we import most of this product. This graph will help us understand the information very easily and take ideas at a glance. It can be seen in the graph that around 13 country sell this product to Bangladesh. In the following section clustering algorithms will be used to find out the possibility of having anomaly in this data. As it is very difficult to make any decision over noisy data so we must try to find the presence of anomaly in data to make proper decision
.
Fig 4: Frequency of an individual product in several countries
Later, it is organized the information imported from Indonesia according to the year so that it can understand the effect of demand of this product over year. So, this analysis justifies that imported product varies not only from country to country but also year to year. The graph given below shows that this selected product was imported mostly in 1993, 1994 and 1998 from Indonesia. At this stage it can make a decision that the
demand of this particular product is not constant yearly. But, of course, it must understand that the lower import of the goods from Indonesia does not mean that it will not be imported more from other countries. It should concern that waning the product from Indonesia may wax the product from another country. If the cumulative demand is reduced, then it can be ensured that the imports of the product have declined, otherwise not. In early stages the demand of this product was high but next successive year it changed its routine by degrading the demand and continued till 1997. But next year in 1999 it dissipated again. To better understand, it can be used another attribute which will make importing information more specific. The attribute month will be used next to have better understanding about this particular product over a specific year.
Fig 5: Frequency of an individual product in different year in Indonesia
6.2
Tools & Libraries
R is used to analyze and apply our tools. Some libraries have to be installed to use mentioned tools. Among them, ggplot2, cluster, fpc & nnet is one of the most important. Hadley Wickham created the ggplot2 package, provides a magnificent graphics language for creating complex and elegant plots. On the other hand cluster is used in plotting the clustered data. And nnet package is used to apply Artificial Neural Network in the data set. And Flexible Procedures for Clustering (fpc) provides Various methods for clustering and cluster validation
.
6.3
Clustering & Forecasting
[image:4.595.57.272.488.646.2]The location of the elbow in the resulting figure given below suggests a suitable number of clusters for the k-means. It might conclude that 7 clusters would be indicated by this method as a selected optimized center
.
Fig 6: Number of Optimized Clusters
[image:5.595.320.543.236.667.2]After the receptive center is received, a graph has been drawn. The graph shows that there are some blocks where there is more information that is likely to get the pattern. Patterns form in the data over longer periods of time, and these patterns are crucial for the functionality of our model if chaos exist in data. This pattern will help us in the future if our predictions are correct or not using Machine Learning and Artificial Intelligence tool. There are two different plot are given below using 7 cluster kmeans, one is using information of country and another is using year
.
[image:5.595.60.273.402.556.2]Fig 7: K-Means Cluster analysis with 7 center according to country
Fig 8: K-Means Cluster analysis with 7 center according to year
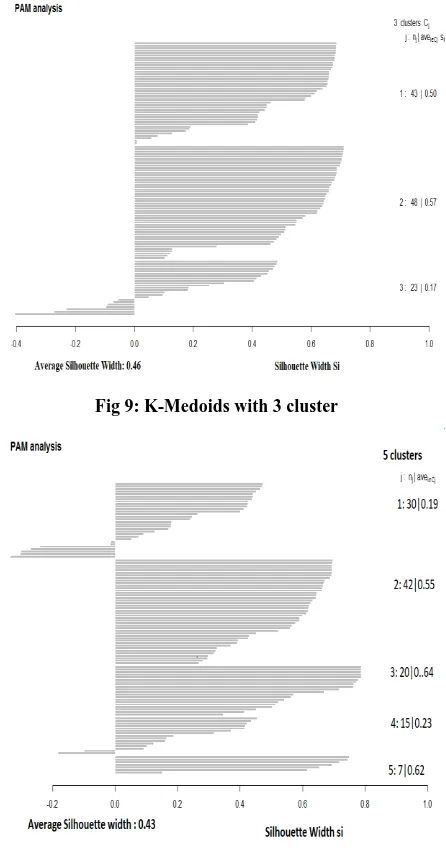
The tool we used to justify K-means accuracy is K-Medoids. It has been used three centers to test the K-Medoids result over our data. All the plotted graph have been given below to
observe and from this analysis it can be concluded that 7 clustering is optimal solution based on the Silhouette width. The silhouette width is a measure of how similar a data is to its own cluster compared to other clusters. Silhouette refers to measure the relationship and consistency within clusters of data. The silhouette ranges from -1 to 1, where a high value indicates that the object is well matched to its own cluster and poorly matched to neighboring clusters. It is noticed in the Partitioning Around Medoids (PAM) analysis in figure given below the average silhouette width is maximum for the 3 centroid cluster but per cluster silhouette width is maximum of 7 centroid cluster. Which implies that the data in 7 centroid cluster is closer and consistent to its cluster rather than other. So, from this PAM analysis it may conclude that the center which is selected from the optimized graph is justified
.
Fig 9: K-Medoids with 3 cluster
[image:5.595.72.264.595.704.2]Fig 11: K-Medoids with 7 cluster
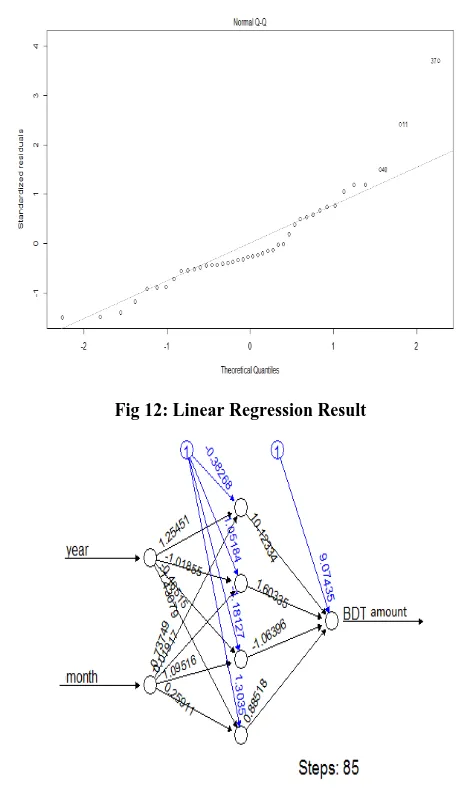
[image:6.595.308.537.76.473.2]After consistent informed about data and examining the data as correct on the above, it is time to come forward to find out the desired results. After cluster analysis it has been used Linear Regression and ANN for the sake of forecasting and extrapolation. It became difficult to work with large data set because there were 57 bank, 39 currency, more than 200 country and around 7.5 lakh row in this data set. So it has been selected a specific country Indonesia which reduced so many data to compute easily. A common practice is to split the data into a training and test set. First train the model with separated training set and test how well it generalizes to data it has never seen before with the test set. So the model's performance on given test set will provide insights on how the model is performing. For the training purpose all the data from 1993 to 1998 were selected. On the other hand only the data of 1999 were left to test. After training and preparing Linear Regression and Artificial Neural Network, evaluation was necessary both the forecasting tools to check how accurate the result which is got from the tools. About 85 steps were noticed in Artificial Neural Network which is showed in figure 13. Eventually, two input were taken to compute the BDT amount which is showed as output in figure 13. The whole process is done in two stages: the input values are linearly aggregated at first stage, after that the result is used as the argument of a nonlinear activation function. The aggregation uses the weights wi imputed to each connection, and a constant bias term, with a fixed input equal to 1. The activation function must be a non-decreasing and differentiable function; the most common choices are either the identity function, as the logistic one y = 1/ (1+ex). [16] After applying the Linear Regression on the filtered data set, looking at the trend line, it is understood how close or far the information is from the trend line. The more close to trend line the more the data is accurately predicted. Both the figure of Linear Regression and Artificial Neural Network are given below with their information. One predictive method is used for justification for another because to conclude any decision one must have some justification with proper authority. In the next section it has discussed briefly about the result what it has been experienced with proper comments. In Statistics, Linear Regression has been successfully used, but Artificial Intelligence has been very successful in the Machine Learning, which has also been observed in our study. So, Artificial Neural Network might be used for the future prediction in any country
.
Fig 12: Linear Regression Result
Fig 13: Artificial Neural Network Result
6.4
Analysis of Experimental Results
After this, it has been examined the accuracy of our desired results by 1999 data. As it has been previously discussed that the data of 1999 will be used as testing data. Specifically, it has been taken month of March and May and run on Artificial Neural Network and Linear Regression what has already trained. In fact, no matter how good the algorithm is, there is error in his performance. After getting the result it is calculated the error of both algorithm what it has been used to forecasting. The error of Linear Regression is 21.06% and 38.72% respectively for both month. On the contrary, the error of Artificial Neural Network is 8.11% and 21.43% respectively for both month. In comparison with Linear Regression, ANN has better result just look into the table 1
.
Table 1. Difference between original and projected Data
Year Mont
h
Origina l Amoun t(BDT)
Forecasting
by Linear
Regression(B DT)
Forecasti
ng by
ANN(BD T)
1999 March 501975 607692 542704
If it is possible to give Artificial Neural Network training with information from all the past years, then it can forecast more precisely and accurately how our imported goods may be in the coming years. Though all the result which is got from this study is hypothetical but it can be a strategic steps to ensure prosperity and strengthen the economy of a country.
7.
CONCLUSION
The most difficult thing to do at the beginning was to collect data but the Bangladesh Bank has given permission to access. Later it was very important to get ideas about the information that some formula of statistics have helped us to understand precisely. Because it is very difficult to know about the work and to know about the next steps if there is no good sense of data. In spite of the many inconveniences it has been done and it has been fixed some of its authenticity through Kami clustering methodologies. One clustering algorithm is actively used for justification for another. Finally, it has provided methodologies for the prediction for which it has been divided the data into two sections first on for training and last one for testing purpose. And after the test, some errors found which can be reduced if it can train our methodologies with more information if Bangladesh Bank permitted but should be kept in mind that methods should not be over fitting. This study can help us to explain more clearly how the imports can become in the next years. In this study, it remains space for the future research and development on several fields which can be carried on like most profitable commodity selection using decision tree, and lucrative budget combination for import sector using genetic algorithm.
8.
ACKNOWLEDGMENTS
I would like to start by expressing my deepest gratitude to the Almighty Allah for giving me the ability and the strength to finish the task successfully. I would like to express my heartiest gratitude to my supervisor for his continuous guidance, encouragement, and patience, and for giving me the opportunity to do this work. Besides, I would like to thank Serajam Monira Deputy Director of Bangladesh Bank to help me collecting the import data of Bangladesh Bank.
9.
REFERENCES
[1] Boone and Kurtz, “Contemporary Business,” 16th edition.
[2] A. Ganesh-Kumar, Sanjay K. Prasad and Hemant Pullabhotla, “Supply and Demand for Cereals in Bangladesh, 2010–2030,” June 2012.
[3] M.A.A. Hasin, S. Ghosh, M.A. Shareef, “An ANN Approach to Demand Forecasting in Retail Trade in Bangladesh”, International Journal of Trade, Economics and Finance, vol. 2, no. 2, April 2011.
[4] G. Atsalakis, C.I. Ucenic, C. H. Skiadas, “Forecasting Unemployment Rate Using a Neural Network with Fuzzy Inference System,” ICAP, 2007.
[5] L.M. Liu, S. Bhattacharyya, S.L. Sclove, R. Chen, W. J. Lattyak, “Data Mining on Time Series: An Illustration Using Fast-Food Restaurant Franchise Data”, Computational Statistics & Data Analysis, vol. 37, pp. 455-476, 2001.
[6] P.C. Chang, Y.W. Wang, C.H. Liu, “The Development of a Weighted Evolving Fuzzy Neural Network for PCB Sales Forecasting”, Expert Systems with Applications, vol.32, pp. 86- 96, 2007.
[7] Z.L. Sun, T.M. Choi, K.F. AU, Y. Yu, “Sales Forecasting Using Extreme Learning Machine With Applications In Fashion Retailing”, Decision Support Systems, vol. 46, pp. 411-419, December 2008.
[8] Y. Yu, T. Choi, C. Hui, “An Intelligent Fast Sales Forecasting Model for Fashion Products”, Expert System with Applications, vol. 38, pp. 7373-7379, 2011.
[9] S.H. Ling, “Genetic Algorithm and Variable Neural Networks: Theory and Application”, Lambert Academic Publishing, 2010.
[10]K.F. Au, T.M. Choi, Y. Yu, “Fashion Retail Forecasting by Evolutionary Neural Networks”, International Journal of Production Economics, vol. 114, pp.615-630, 2008.
[11]R.S. Gutierrez, A. Solis, S. Mukhopadhyay, “Lumpy Demand Forecasting Using Neural Networks”, International Journal of Production Economics, vol. 111, pp. 409-420, 2008.
[12]P. Doganis, A. Alexandridis, P. Patrinos, H. Sarimveis, “Time Series Sales Forecasting For Short Shelf-Life Food Products Based On Artificial Neural Networks And Evolutionary Computing”, Journal Of Food Engineering, vol. 75, pp. 196-204, 2006.
[13]L. Aburto, R. Weber, “Improved supply chain management based on hybrid demand forecasts”, Applied Soft Computing, 2007.
[14]Nahida Sultana Ebney Ayaj Rana, and Rashed Al Mahmud Titumir “Export, Import, Remittance and FDI: Recent Trends,” Bangladesh Economic Update vol. 5, No. 4, April 2014.
[15]Valentino Piana (2001). IMPORTS. [Online]. Available: http://www.economicswebinstitute.org/glossary/imports. htm
[16]Henrique Steinherz Hippert, Carlos Eduardo Pedreira, and Reinaldo Castro Souza, Neural Networks for Short-Term Load Forecasting: A Review and Evaluation, IEEE Transactions on Power Systems, Vol. 16, February 2001.
[17]Michael Todaro and Stephen C. Smith, "Economic Development" (11th ed.)., Pearson Education and Addison-Wesley (2011).
[18]Sen, A (1983). "Development: Which Way Now?". Economic Journal. 93 (372): 745–62. doi:10.2307/2232744.
[19]Hirschman, A. O. (1981). The Rise and Decline of Development Economics. Essays in Trespassing: Economics to Politics to Beyond. pp. 1–24.
[20]Hoggson, N. F. (1926) Banking Through the Ages, New York, Dodd, Mead & Company.
[21]Goldthwaite, R. A. Banks, Places and Entrepreneurs in Renaissance Florence, (1995)
[22]Boland, Vincent (2009-06-12). "Modern dilemma for world's oldest bank". Financial Times. Retrieved 23 February 2010.