Published Online August 2012 in SciRes (http://www.SciRP.org/journal/ce) http://dx.doi.org/10.4236/ce.2012.34078
Teach Ourselves: Technology to Support Problem Posing in
the STEM Classroom
Carole R. Beal, Paul R. Cohen
School of Information: Science, Technology and Arts, The University of Arizona, Tucson, USA Email: [email protected], [email protected]
Received May 18th,2012; revised June 20th, 2012; accepted July 3rd, 2012
The theory of problem posing in mathematics education suggests that there are motivational and cognitive benefits for students from creating their own problems, yet such activities are not typically integrated into the traditional classroom. A field study was conducted to learn if middle school students (N = 224) could successfully create math and science problems using a web-based content-authoring and sharing system, and if the activity could be successfully integrated into classroom instruction. Over the twelve-week ac-tivity, students created their own math and science problems, and solved problems authored by their peers. Results showed that students were able to create problems successfully, but that problem solving domi-nated problem posing activities. The process of reviewing and approving students’ work was also chal-lenging for teachers. Both students and teachers reported strongly positive responses to the activity.
Keywords: Mathematics Education; Technology-Based Instruction; Middle School Students
Introduction
There is an urgent need to improve educational outcomes in math and science, and to encourage more K12 students to fol-low a steady trajectory towards math and science careers. The nation is facing a significant shortage of workers with skills in science, technology, engineering, and mathematics (STEM). Unfortunately, math and science achievement for middle and high school students in the United States remains discourag-ingly low (National Center for Education Statistics, 2011). In international comparisons, US students score in the average range overall, and much less well than students from other na-tions that are comparable in terms of economic development (Gonzales, Williams, Jocelyn, Roey, Kastberg, & Brenwald, 2008; Organization for Economic Cooperation and Development [OECD], 2010). The United States also appears to have a lower proportion of students who achieve scores in the very top levels, relative to other nations (OECD, 2010).
A related problem is that although the national need for a new generation of engaged, accomplished STEM learners is great, relatively few students appear to be interested in these fields. In spite of many investments in STEM mentoring, public service campaigns and other programs, participation remains low. On average, American students are not very interested in math and science, compared to students in other nations (Sjo- berg & Schreiner, 2007). Many hold the perception that STEM fields are difficult and dull (Davis et al., 2006). Students’ be-liefs about the demands of STEM participation are not currently balanced by an awareness of the potential rewards of creative intellectual engagement, and the excitement of discovery that deeply engages STEM practitioners.
The low achievement and lack of interest in STEM by stu-dents is especially striking when considered in relation to recent changes in social and entertainment venues, which have in-creasingly involved direct user creativity and active participa-tion. Over the last decade, new technologies have led to an
lem posing strategies and activities that are mentioned in the literature include (but are not limited to) creating an analogous problem on a different topic or with different content, thinking about how a problem connects with personal experience, think-ing about how problem information that can be varied and con-sidering what would happen if information was negated or re-versed (“what if not?”), explaining how a problem should be solved, changing a problem so that a different solution is re-quired, or finding an alternative way to solve the same problem, and applying mathematical operations to information gleaned from real-world contexts.
Problem posing is argued to provide students with the op-portunity to reflect on what is known and not known, to restate a problem in a new equivalent form or to vary problems in new ways, and to engage in explanation, all cognitive activities that should deepen students’ understanding of the material (Arroyo & Woolf, 2003; Bonotto, 2010; Contreras, 2003; Chi, 2009; Cotic & Zuljan, 2009; English, 1997; Hausmann & Van Lehn, 2007; Hirashima, Yokoyama, Okamoto & Takeuchi, 2007; Martinez-Cruz & Contreras, 2002; Mestre, 2002; Roscoe & Chi, 2007; Roy & Chi, 2005; Silver & Cai, 1996; Silver, Kilpatrick, & Schlesinger, 1995; Xia, Lu, & Wang, 2008).
In addition to the hypothesized cognitive benefits, problem posing has also been suggested to increase student motivation, whereas solving problems defined by others day after day often leads to student boredom (Contreras, 2003; English, 1997; Knuth, 2002; Miller, 2006; Whitin, 2004). Teachers have re-ported anecdotally that the activity of problem posing leads to class engagement and higher interest in math, especially among students who are not generally enthusiastic about math (Miller, 2006; Simic-Mullter, Turner, & Varley, 2009; Wilson, Fernan-dez, & Hadaway, 2006; Verzoni, 1997). Problem posing has also been suggested to reduce math anxiety because students who define their own problems become more confident and feel a greater sense of “ownership” about the topic (Miller, 2006). Noted mathematics educator Lyn English reported, “… prob- lem-posing can encourage children to take greater responsibil-ity for their learning and dissipate common fears and anxieties about mathematics learning” (1997: p. 173).
Although problem posing has considerable promise as an innovative instructional activity, several researchers have re-ported that it can be difficult for teachers to implement in the classroom. For one thing, it is more work to review a set of distinct problems created by different students, compared to grading 26 identical worksheets or problem sets. In addition, problem posing activities require good classroom management skills, because students may be at quite different places in the process of creating their materials. Finally, options for students to share their work with peers and see what other students are creating are relatively limited with traditional paper-based ac-tivities.
To address these implementation challenges, we developed Teach Ourselves (TO), a web-based application that supports student creation of instructional materials, along with tools for sharing their content with others. The TO application is driven by an economy in which students earn points both for creating materials and for solving problems created by their peers, mak-ing the activity game-like. Although the literature on problem posing has focused primarily on mathematics learning, there is no theoretical reason why the same principles of engagement would not apply to problem posing in other domains. Thus, the
Teach Ourselves application includes multiple domains: math, and life, earth, physical, space and applied science. Specific features are described next:
Features of the Teach Ourselves Application
When the student logs in, he or she can decide to solve a math or science problem that is already available in the system, or to create a new one. Students who want to solve can view a list of the problems that have been created by others, along with their current points value. The list can be filtered by domain, or by the points associated with the problems. If the student con-tracts to solve a problem and does so successfully within three attempts, he or she earns the contracted points value. Each in-correct attempt elicits a brief feedback hint, and the problem solver can also view a multimedia help file created by the problem author. If the student does not enter the correct answer, he or she can try the problem again (although the points value may have fluctuated by the next try). Teach Ourselves includes Web 2.0 features such as the ability for students to +1 (“like”) a problem, make a comment, or flag it as inappropriate or incor-rect in some way. To includes leaderboards that show users in terms of overall points, points by domain, class, school and other groupings, as well as individual progress summaries that can be viewed by the student on his or her profile page.
Students can also earn points by creating their own problems; in fact, in the TO economy, the points values for creating are significantly higher to provide an incentive for students to cre-ate content. The student contracts to crecre-ate a problem at the current value for that domain. The student works with a tem-plate that includes areas for typing in a problem, adding a graphic, entering two pieces of feedback that would be shown if the future problem solver enters incorrect answers, and upload-ing a help item (Birch & Beal, 2008). Help items can be pic-tures, slide shows (created with PowerPoint), animations, screen- cast or cell phone videos, or other media. The function of the help item is to provide an explanation or worked example that can guide the user to the solution without providing the answer. Students are required to include source information and attribu-tions for images or other media in corresponding areas of the template. Students can preview their problem and save it to work on another time, or they can submit it to their teacher for review and approval.
When teachers log in, they can see a list of problems submit-ted by their students that are waiting to be reviewed. Teachers are provided with an integrated rubric to guide the process of checking that each problem includes accurate content and ap-propriate content, that the answer is correct along with any associated units that need to be specified, and that the attribu-tions for any source materials are listed. If the teacher approves the problem, the student can publish it to the open market so that it is available for other students to solve, and earns the contracted number of points. Teachers can also return the prob-lem to the author with comments and suggestions for revision. Sample student-authored problems are available in the “try this!” area of www.teachourselves.org.
Method
Participants
Data were obtained from 224 middle school students (120 girls, 94 boys, and 10 students whose gender was not identi-fied). Mean age of the participants was 13.8 years. Written parent consent was obtained for the participants. Students worked with TO as part of their math or science class instruc-tion approximately once a week for twelve weeks. The activity was directed by teachers (N = 9) who were recruited via an-nouncements sent to list-services reaching math and science teachers throughout the state. One group included two classes of students (N = 58) with one teacher. Teachers received small stipends in recognition of the out-of-class time involved in the project, such as the professional development training and completion of online surveys.
Procedure
Teachers participated in one two-hour online training session in which they were introduced to the theoretical framework and the features of the Teach Ourselves web application, including management of student accounts, and the rubric for the review and approval of students’ work. Teachers then scheduled TO days for the equivalent of one class period per week. The Teach Ourselves application was seeded with 182 problems that had been created by students in a small pilot study conducted in the previous year.
The activity ran for approximately twelve weeks in each classroom. Students’ activity within the Teach Ourselves web application was automatically logged, including the points earned from solving and creating problems, and social behav-iors such as making comments, complimenting via the +1 mechanism, or flagging problems for a perceived issue. At the conclusion of the activity, students were asked to complete an online survey about their experience with the application, and what other features they would like to see included. Teachers also completed an exit survey about their perceptions of the activity, and other features they would like to see.
Results
Problem Solving
The mean number of problems solved by each student is shown in Table 1 by domain. As may be seen in the table, the most popular category was Space Science, followed by Math. As indicated by the relatively high standard deviations, there was a considerable range, from seven students who solved only one problem to one student who solved 785 problems over the course of the activity.
Problem Creating
[image:3.595.309.538.109.236.2]Students produced a total of 961 new problems that were ap-proved by their teachers and thus became available in TO for other students to solve. The mean number of problems ap-proved and published by each student is shown in Table 1. The range was from 0 (N = 32 students) to 9 problems published (N = 1 student). A key step in creating a problem involves the creation of a help item that the solver can access for assistance with the problem. An examination of the help files revealed that 76% involved a simple image file, 20% involved the creation of
Table 1.
Mean number of problems solved and created by domain.
Solved Created
Life Science 16.0 (22.1)a 0.6 (1.2)
Earth Science 10.6 (14.5) 0.3 (0.7)
Physical Science 9.7 (16.2) 0.7 (1.2)
Space Science 36.2 (42.1) 0.7 (1.4)
Applied Science 11.7 (15.9) 0.3 (0.9)
Mathematics 21.9 (38.3) 1.7 (2.1)
Total 106.1 4.3
aStandard deviations are shown in parentheses.
a PDF (usually from a PowerPoint slide show) and only 4% involved an animation or video file.
In addition to the successfully approved and published prob-lems, students had an average of 0.42 problems sitting in the review queue waiting for teacher approval, and another 1.5 problems that had been submitted for review at least once but then returned by the teacher for revision. Thus, overall, students created about 6 problems (roughly 4 published, 1.5 in progress and 0.5 waiting for approval).
Some students (N = 32, 14.3% of the total sample) did not produce any published problems. Most of them (85%) were in the group supervised by the teacher who had two classes of participants. Although these students did not successfully pub-lish any problems, they had submitted an average of 2.8 prob-lems that had been returned for additional work, and at the end of the study, they had an average of 1.4 problems that had been submitted but remained in the review state. Thus, these students did participate in the creation process although they were not able to complete the cycle of obtaining approval. Their teacher reported that she was not able to keep up with the review and approval of her students’ work. As noted below, this teacher also had the highest average number of submission attempts per problem, typically approving a problem only after its third try.
Balance of Solving and Creating
There was considerable variation across the nine groups in terms of the total points earned per student, and whether the points were earned from solving versus creating problems. Results by group are shown in Table 2. The pattern suggests that even though creating problems earned more points per problem, students who put more of their overall effort into problem solving tended to accumulate more points.
Use of Social Media Features
Table 2.
Points earned by solving and creating problems by group.
Group N Mean points per student Solving Creating
Cougars 15 7372 74% 26%
Cobras 20 7108 82% 17%
Axolotls 22 6400 72% 27%
Condors 17 3749 65% 34%
Jaguars 26 3176 54% 45%
Eagles 32 2516 62% 37%
Mustangs 58 2188 89% 11%
Owls 10 1682 38% 61%
Hawks 24 1394 35% 64%
attribution its a search engine”), the problem contained a spell-ing or grammatical error (4%) or another issue (16%, e.g., “to easy!”).
The frequency with which problems were flagged varied across the groups, suggesting that were may have been differ-ences in the quality control imposed by teachers during the review process. Table 3 shows the mean number of times a problem was submitted for review before its final approval, along with the mean number of flags per problem, presented for each of the nine groups. As may be seen in the table, when teachers approved problems after fewer than two submissions, problems were more likely to be subsequently flagged as flawed than problems from groups where teachers were not as quick to approve problems.
Student Survey
The exit survey was completed by 180 students (80%). Stu-dents were asked to review seven key components of Teach Ourselves and indicate how important each component had been. Results are shown in Table 4. Sample comments in-cluded, “I like how it focuses on points and badges.” “I like that you get ponts that motivaits me”. “I enjoyed extremely the leader board I think it iskinda fun”. “I trying to git in first rank-ing”. “I love Teach Ourselves. I like the thrill of getting points and getting on the leader board.”
In response to the survey item about what additional features students would like to see added to TO, the most popular were “prizes and rewards” (75%), “an avatar” (66%), “option to unpublish my work so I can edit it” (49%), and “more help with making help items” (36%). (Students could choose more than one feature so percentages do not sum to 100%). Examples of comments include, “use points for avatar customization and cool prizes,” “getting a prize for the most points,” “something to reward your work, more points.”
Students were asked to indicate how much they felt that they had learned from different activities in TO. Results are shown in Table 5. Interestingly, students gave the lowest rankings to making the help items for their problems, even though the theoretical framework outlining the cognitive benefits of prob-lem posing would suggest this should be the most beneficial part of the process.
Another survey item asked if students would use TO outside of school: 46% selected the option “Yes, I would use it on my
Table 3.
Mean number of problem submissions and flags by group.
Group Submits Flags
Hawks 1.28 0.91
Axolotls 1.40 3.54
Cougars 1.76 2.53
Cobras 1.91 2.24
Condors 2.05 2.58
Owls 2.40 0.40
Eagles 2.48 0.60
Jaguars 2.50 0.77
[image:4.595.58.288.110.266.2]Mustangs 3.21 0.15
Table 4.
Student responses regarding importance of TO components.
Very Important
Sort of Important
Not Important
“Approved” comments 75% 22% 3%
Getting points 72% 24% 5%
“Denied” comments 69% 23% 8%
Checking Leaderboard 49% 33% 18%
Discussing 49% 33% 17%
Flagging 46% 35% 18%
[image:4.595.310.537.302.437.2]Giving +1s 39% 43% 18%
Table 5.
Percent of student respondents indicating amount learned from TO activities.
A lot Some Very little
Solving problems 58% 36% 6%
Creating problems 53% 40% 7%
Creating help items 29% 48% 22%
own,” 20% selected “Yes, I would use it with my friends,” and 34% selected, “No, I would never do it outside of school.” Thus, over half indicated that they would consider using TO on their own time. Sample comments included, “It’s fun. I do it after school on my own, unlike ALEKS.” “IT’S SUPER FUN AND HELPS ME LEARN!!!! “I like creating problems and solving problems has become something I do everyday.” “It was fun making my own problems.” “I think its cool that we get to create problems that we want to do.” “I think that solving other people problems, and other student's problems is really cool, because I get to see what they have learned.” “It’s an easy way to learn new cool things.” “I like the fact that all the problems are made by other students and often they are very interesting.”
Spontaneous Activity Out of School
[image:4.595.308.536.482.546.2]files showed that students were using TO during out of school hours, even though they were not required or expected to do so. The greatest periods of activity occurred during school hours, as expected. However, there was also a fair amount of activity in the after-school hours (e.g., 4 pm through 10 pm). A review of the discussion log files during this time period revealed interchanges suggesting that students were motivated by the goal of achieving extra points: “Guess what! Were in the top 10 on the lader board! It said Canyon Ridge ” “I’m in 25th place of everybody I’m excited. How many points you got?” “I been on a couple of hours but I have to get off you better not pass me while I’m off”. “Yay I’m finally ahead of Lily!”
Teacher Exit Survey
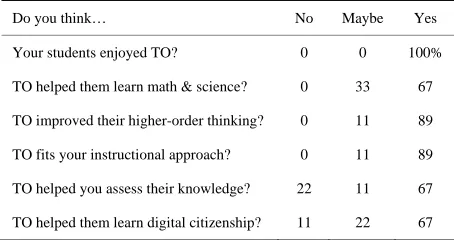
Teachers also had a generally positive reaction to the activity. Every one asked if they could continue to use Teach Ourselves in the next school year. Responses to the exit survey are shown in Table 6. On the survey, teachers were also asked to describe one thing they liked about the activity and one thing that they felt needed to be improved. Positive comments included the following: “It helped the students be more analytical about their work.” “They had to decide the best way to express their ques-tion and the appropriate format for the answer.” “It got the stu-dents really thinking about the information and how to ask a robust question about it instead of just telling someone the in-formation.” “I enjoyed seeing the creative problems that were created.”
Other comments by teachers included, “I’m amazed at how creative and well-written some of my students’ questions are.” “I really think this is helping my students with their higher-order thinking.” “Their excitement about the program was evident— they LOVED having Teach Ourselves days.” “I witnessed my students take pride on their work and become more confident and sure of themselves.”
[image:5.595.58.285.617.737.2]Teachers’ comments about what needed to be improved fo-cused mostly on technical issues and features: “My students experienced many problems with the application. They often received error messages or the application was very slow. They found this to be frustrating.” “Maybe a way to email students from within the program in case they are not logging into TO, you can still send a message to them about their problem.” “A better way to express mathematical expressions using fractions, exponents, and other math symbols.” “The help item input.” “Have a way to block more than one account being made with the same name and/or email.” In addition, two teachers com-mented on the need to ensure that all published problems
Table 6.
Teacher responses on exit survey.
Do you think… No Maybe Yes
Your students enjoyed TO? 0 0 100%
TO helped them learn math & science? 0 33 67
TO improved their higher-order thinking? 0 11 89
TO fits your instructional approach? 0 11 89
TO helped you assess their knowledge? 22 11 67
TO helped them learn digital citizenship? 11 22 67
were of high quality: “One thing that really needs to be im-proved is controlling the quality of the problems being ap-proved by mentors.” “The only thing is probably the criteria for every approved problem.”
Discussion
One goal of the study was to learn if students could success-fully create math and science problems within the application. The answer was a tentative “yes,” in that students did create an average of four problems that successfully made it through the entire creation cycle, with another 1 - 2 problems in the produc-tion pipeline. However, the relative balance was clearly towards solving problems that had been created by others rather than authoring new content, even though the points value was de-signed to be higher for creation than for solving. In some re-spects this result may not be surprising given that the activity of creating new content was unfamiliar to students. Creating con-tent also involved multiple steps, including obtaining the ap-proval to publish from the teacher, which took two attempts on average. The overall pattern was also consistent with recent observations, that even within the Web 2.0 community, most users browse the available content rather than contribute to it themselves. One observer noted the “1% rule,” meaning that out of 100 people who are online, only one will actually con-tribute content (Arthur, 2006). In addition, our analysis indi-cated that students who accumulated the most points did so by mostly solving, and that overall scores were lower when stu-dents allocated more time to creating. One strategy may be to increase the value associated with creating content relative to solving more dramatically than was the case in this study, to provide a stronger incentive for students to allocate more of their time to the problem posing activity.
A second goal of the study was to learn if the activity would engage students’ interest, as suggested by the problem posing theoretical framework. The reaction was generally positive, indicated by students’ responses on the end-of-activity survey, their comments recorded in the logs of the online discussions, and the spontaneous activity within the application during out- of-school hours. Students reported that they liked earning points for their work, even though there was nothing that stu-dents could actually do with their points within the application. The competitive component also seemed to be highly engaging, perhaps because there were multiple opportunities to earn a spot on one of the leaderboards. Teachers also reported that they thought their students enjoyed the activity. One sent us a note that a student had written in class: “I like how it makes learning fun and I am doing it on my own time. I think the idea of it is genius!”
stu-dents’ work, and that the approval standards were not entirely consistent from teacher to teacher. The teacher who could not keep up was also the teacher whose standards were so high that each approved problem was on its third submission. However, the problems that she eventually did approve were rarely flagged as flawed by other students. In contrast, teachers who required fewer rounds of revision were more likely to have their students’ problems flagged as flawed by others. One solution might be to allow students to conduct initial reviews of peers’ work, perhaps by requiring approval by several peers before the problem is submitted to the teacher for final approval and pub-lication.
One finding of interest was that although the problem posing theoretical framework emphasizes that the student should deepen his or her own understanding through the activity, stu-dents themselves reported that they learned most from solving other students’ problems. However, conclusions are limited because students did not necessarily solve and create problems in the same domains. Thus, a student might have found it easier to write problems about a topic that was well-known, but then chosen to solve problems in a less familiar domain. Additional research in which students are assigned to solve and create in a specific domain might help to resolve this issue.
The greatest limitation of the study was that there was no as-sessment of student learning. Teachers reported that they thought students had learned, and that the activity had improved their critical thinking skills. However, it is quite possible that students were highly engaged with solving and creating but that the activity did not necessarily deepen their knowledge of the domain-specific material. One student commented on the sur-vey, “I have learned a lot from solving problems but I usually don't learn as much when creating my own problem because I already know what my question is about.” Additional research will be required to investigate this issue.
Acknowledgements
We would like to thank Jane Strohm, Tom Hicks and Wil-liam Mitchell for their outstanding work on the project, and the student and teacher participants for their enthusiastic support. The research presented here was supported by the CS-STEM program in the United States Defense Advanced Research Pro-jects Agency. The views expressed here do not necessarily represent those of the funding agency.
REFERENCES
Arroyo, I., & Woolf, B. P. (2003). Students in AWE: Changing their role from consumers to producers of ITS content. Proceedings of the 11th International Conference on Artificial Intelligence and Educa- tion, Sydney, 20-24 July 2003.
Arthur, C. (2006). What is the 1% rule? The Guardian, July 26, 2006. URL (last checked 1 May 2011).
http://www.citeulike.org/group/2518/author/Arthur:C
Birch, M., & Beal, C. R. (2008). Problem posing in Animal Watch: An interactive system for student-authored content. Proceedings of the 21st International FLAIRS Conference, Coconut Grove, 15-17 May 2008.
Bonotto, C. (2010). Engaging students in mathematical modelling and problem posing activities. Journal of Mathematical Modelling and Application, 1, 18-32.
Brown, S. I., & Walter, M. I. (1990). The art of problem posing. Hills-dale, NJ: Erlbaum.
Cai, J. (1998). An investigation of US and Chinese students’
mathe-matical problem posing and problem solving. Mathematics Educa-tion Research Journal, 10, 37-50. doi:10.1007/BF03217121 Cai, J., & Huang, S. (2002). Generalized and generative thinking in US
and Chinese students’ mathematical problem solving and problem posing. Journal of Mathematical Behavior, 21, 401-421.
doi:10.1016/S0732-3123(02)00142-6
Chi, M. T. H. (2009). Active-constructive-interactive: A conceptual framework for differentiating learning activities. Topics in Cognitive Science, 1, 73-105. doi:10.1111/j.1756-8765.2008.01005.x
Chi, M. T. H., Roy, M., & Hausmann, R. G. M. (2008). Observing tutorial dialogues collaboratively: Insights about human tutoring ef- fectiveness from vicarious learning. Cognitive Science, 32, 301-341. doi:10.1080/03640210701863396
Contreras, J. N. (2003). A problem-posing approach to specializing, ge- neralizing and extending problems with interactive geometry soft-ware. The Mathematics Teacher, 96, 270-275.
Cotic, M., & Zuljan, M. V. (2009). Problem-based instruction in mathe- matics and its impact on the cognitive results of the students and on affective-motivational aspects. Educational Studies, 35, 297-310. doi:10.1080/03055690802648085
Crespo, S. (2003). Learning to pose mathematical problems: Exploring changes in preserve teachers’ practices. Educational Studies in Mathe- matics, 52, 243-270. doi:10.1023/A:1024364304664
Davis, D. D. et al. (2006). An integrative model for enhancing inclusion in computer science education. In E. Trauth (Ed.), Encyclopedia of gender and information technology (pp. 269-275). Hershey, PA: Idea. doi:10.4018/978-1-59140-815-4.ch042
Education Development Corp. (2003). Making mathematics: Mentored research projects for young mathematicians. URL.
http://www2.edc.org/makingmath/handbook/teacher/ProblemPosing/ ProblemPosing.asp
English, L. (1997). Promoting a problem-posing classroom. Teaching Children Mathematics,4, 172-179.
Gonzales, P., Williams, T., Jocelyn, L., Roey, S., Kastberg, D., & Brenwald, S. (2008). Highlights from TIMSS 2007: Mathematics and science achievement of US fourth and eighth grade students in an international context (NCES 2009-2011 Revised). Washington DC: National Center for Education Statistics, Institute of Education Sci-ences, US Department of Education.
Hausmann, R., & Van Lehn, K. (2007). Explaining self-explaining: A contrast between content and generation. Proceedings of the 13th In- ternational Conference on Artificial Intelligence and Education, Los Angeles, 9-13 July 2003.
Hirashima, T., Yokoyama, T., Okamoto, M., & Takeuchi, A. (2007). Learning by problem-posing as sentence-integration and experimen-tal use. In R. Luckin, K. R. Koedinger, & J. Greer (Eds.), Artificial intelligence in education: Building technology rich contexts that work (pp. 254-261). Amsterdam: IOS Press.
King, A. (1992). Comparison of self-questioning, summarizing and note-taking review as strategies for learning from lectures. American Educational Research Journal, 29, 303-323.
Knuth, E. J. (2002). Fostering mathematical curiosity. The Mathematics Teacher, 95, 126-130.
Martinez-Cruz, A. M., & Contreras, J. N. (2002). Changing the goal: An adventure in problem solving, problem posing, and symbolic meaning with a TI-92. The Mathematics Teacher, 95, 592-597. Mestre, J. P. (2002). Probing adults’ conceptual understanding and
transfer of learning via problem posing. Journal of Applied Devel- opmental Psychology, 23, 9-50.
doi:10.1016/S0193-3973(01)00101-0
Miller, L. (2006). Building confidence through math problem solving. URL (last checked 16 January 2006).
http://www.nipissingu.ca/oar/archive-Vol2No1-V211E.htm
National Center for Education Statistics (2011). The Nation’s Report Card: Mathematics 2011 (NCES 2012-458). Washington DC: Na-tional Center for Education Statistics, Institute of Education Sciences, US Department of Education.
and teaching problem solving. New York: John Wiley.
Roscoe, R. D., & Chi, M. T. H. (2007). Understanding tutor learning: Knowledge building and knowledge telling in peer tutors’ explana- tions and questions. Review of Educational Research, 77, 534-574. doi:10.3102/0034654307309920
Roy, M., & Chi, M. T. H. (2005). The self-explanation principle. In R. E. Mayer (Ed.), Cambridge handbook of multimedia learning (pp. 271-286). Cambridge: Cambridge University Press.
doi:10.1017/CBO9780511816819.018
Silver, E. A., & Cai, J. (1996). An analysis of arithmetic problem pos-ing by middle school students. Journal for Research in Mathematics Education, 27, 521-539. doi:10.2307/749846
Silver, E. A., Kilpatrick, J., & Schlesinger, B. (1995). Thinking through
mathematics. New York: College Board.
Simic-Mullter, K., Turner, E., & Varley, M. C. (2009). Math Club problem posing. Teaching Children Mathematics, 16, 206-212. Verzoni, K. A. (1997). Turning students into problem solvers.
Mathe-matics Teaching in the Middle School, 3, 102-107.
Whitin, P. (2004). Promoting problem posing explorations. Teaching Children Mathematics, 180, 7.
Wilson, J. M., Fernandez, M., & Hadaway, N. (2006). Mathematical problem solving. URL.
http://jwilson.coe.uga.edu/emt725/PSsyn/PSsyn.html