Method Development for the Detection of Basic/Weak
Basic Drugs in Hair by LCMSMS: Comparison between
Methanolic and Alkaline Extraction on Real Samples
Jaber Al Jaber1,2, David Holt3, Atholl Johnston1,3
1The William Harvey Research Institute, Barts & The London School of Medicine & Dentistry, Queen Mary University of London,
London, UK; 2Department of Pharmacology and Toxicology, Faculty of Medicine, Kuwait University, Jabriya, Kuwait; 3Analytical
Services International Ltd., St. George’s University of London, London, UK. Email: [email protected]
Received March 4th, 2012; revised April 20th, 2012; accepted May 12th, 2012
ABSTRACT
Detection of drugs in hair has become popular in recent years. The significantly long drug detection window (months) in hair has allowed the retrospective investigation and measurement of past consumption of drug. As the majority of drugs are basic, an extraction method was developed based on a methanolic solution for detection of basic/weak basic drugs in hair. It was compared with alkaline digestion (NaOH) followed by LLE. A filtration step with filtration vials was added and their materials were compared. After filtration, extracts were injected directly onto a C18 column cou- pled to Sciex ABI 2000 MSMS. The mobile phase was 50% methanol, 0.1% formic acid and 2 mM ammonium acetate (isocratic). Both methods were compared by applying them to real samples. Results showed that calibration was linear with r2 of 0.991 - 0.999 for 20 tested analytes. The matrix effect was assessed to be between 91.4% - 110.2% for 18 analytes. PTFE filter material showed better recoveries over the GMF and PVDF based filters. Stability of analytes during extraction in general was better with methanolic incubation than alkaline digestion. With regard to real sample recovery, 6 out of 10 analytes recovered better with alkaline digestion. In conclusion, the methanolic method is capable of extracting most basic drugs in hair samples but only part of the total incorporated drug. Therefore, these results sug-gest that a combination of both methods (methanolic and alkaline extractions) in hair sample processing for general detection of basic and weak basic drugs may produce better results. However, not all basic drugs are stable under alka-line digestion.
Keywords: Hair Analysis; Basic Drugs; LCMSMS; Benzodiazepines; Method Development; LLE
1. Introduction
Drug analysis in hair has grabbed the attention of toxi- cology analysts and researchers in recent years. This is mainly because it has provided some ability of proving drug ingestion when conventional samples could not. Hair differs from other traditional biological samples used for human toxicological analysis such as urine, blood, liver or saliva with its significantly longer detec- tion window (months) allowing retrospective investiga- tion and measurement of drug consumption. Hair analy- sis is becoming accepted in many developed countries for substance consumption related issues in a wide range of sectors; the medico-legal sector, workplace testing, treatment monitoring, schools, forensics, research, in- surance companies, environmental biomonitoring and driving licensing [1-4].
Extraction of drugs from hair is considered one of the
most important steps in hair analysis. Apart from exter- nal drug deposition on hair, drugs are mainly enclosed tightly in the hair shaft and to a certain extent maybe bound to proteins, melanin or lipids of the cell membrane complex. Therefore, hair matrix type, structure of the drug, method and duration of extraction, and solvent used are all important factors affecting the final extrac- tion yield [5].
there has been some focus on using methanolic solutions as an extraction medium consisting of varying ratios of methanol, acetonitrile and formate buffer for extraction of several groups of basic drugs simultaneously [13-15]. However, the extent of their efficiency was not examined most of the time. Therefore, in the present study the aim was to develop a method to enable the detection and quantification of basic and weak basic drugs in hair si- multaneously based on the methanolic solution extrac- tion technique and to compare its efficiency with the al-kaline digestion technique which was followed by liq- uid-liquid extraction (LLE).
2. Materials
2.1. Chemicals
All chemicals were of HPLC or analytical grade. Me- thanol, acetonitrile, acetone, propanol, methyl-tert-butyl- ether (MTBE), citalopram, clobazam, clonazepam, co-caine, codeine, desmethyldiazepam, 3,4-methylenedio- xyamphetamine (MDA), 3,4-methylenedioxy-N-ethy- lamphetamine (MDEA), 3,4-Methylenedioxyme-tham- phetamine (MDMA), midazolam, sulpiride, zaleplon and zolpidem were purchased from Sigma-Aldrich Co, Dor- set UK. 7-aminoclonazepam, amfetamine, amfetamine- D11, benzoylecgonine-D8, benzoylecognine, codeine-D3, diazepam, diazepam-D5, ecognine methyl ester, medaze- pam, oxazepam and temazepam were purchased from LGC standards, Middlesex UK. Other prescription drug standards were supplied from their manufacturer. Deion- ised water was prepared on site (ELGA Limited). Di- chloromethane, 7.5 M ammonium acetate solution and all consumables (tubes, etc) are from VWR International Ltd, Lutterworth UK. The rest of the chemicals used in the solutions below were from Sigma-Aldrich Co, Dorset UK.
2.2. Solutions
2.2.1. Standard Solutions
1000 mg/L or 100 mg/L working standards made with MS grade methanol of each analyte and internal standard. All stored at –20˚C and diluted to the required concen- tration prior to the experiment.
2.2.2. 0.1 M Phosphate Solution
One litre of solution was prepared by dissolving 1.7 g of anhydrous disodium orthophosphate and 12.14 g of so- dium dihydrogen orthophosphate monohydrate in 800 mL of de-ionized water. The pH was adjusted to 6 with 1 M potassium hydroxide and the solution made up to vo- lume with de-ionized water.
2.2.3. 0.1% Formic Acid (v/v)
100 µL of concentrated formic acid (98/100) was mixed
with 99.9 mL of de-ionized water, mixed well and stored at room temperature.
2.2.4. Methanolic Extraction Solution
60 mL of methanol, 10 mL of acetonitrile and 30 mL of 0.1% formic acid were measured into measuring cylinder, mixed well and stored at room temperature.
2.2.5. 1 M NaOH Solution
40 g of NaOH (MW 40.0) pellets were measured into a 1000 mL volumetric flask and made up to the 1000 mL mark with de-ionized water. This was mixed thoroughly and stored at room temperature.
2.2.6. 2 M Ammonium Acetate
266.6 mL of 7.5 M ammonium acetate solution were measured into a 1000 mL volumetric flask and made up to the 1000 mL mark with de-ionized water.
3. Methods and Results
3.1. Hair Preparation
The decontamination process was by using three washing steps with two solvents and one aqueous solution: 0.01 M phosphate solution (pH 6), dichloromethane and pro- panol/acetone (1:1). The uncut hair was put in a 6 ml glass tube, then 2 mL of the first solution added and vor- tex mixed for 1 minute. After that the solvent was de- canted and then the next solvent was added. After the last washing step (2 mL propanol/acetone) the hair was left to dry at room temperature or the process was speeded up with the speed-vac. This decontamination method was found to be quick and very efficient in cleaning post- mortem hair samples.
After the hair had dried segments of ~0.6 cm each were cut into small pieces (1 - 3 mm) with scissors and ideally 25 mg were weighed directly. If this was not pos- sible any amount between 10 and 80 mg was considered and placed into a 2 mL glass tube with a screw cap.
3.2. Methanolic Extraction
utes the extracted solutions were transferred to auto- sampler vials and evaporated to dryness followed by re- constitution with 125 μL of 25% methanol and filtered with the syringeless mini-uniprep filters (Whatman GE). Finally 20 μL of this filtrate was injected into the LCM- SMS system.
3.3. Alkaline Digestion
Twenty five milligrams of washed blank/patient hair was incubated with 0.5 mL of 1 M NaOH for 3 hours in a wa- ter bath (50˚C) to allow for digestion of the hair. Samples were then extracted after digestion with 2 mL MTBE by 30 minutes rotary mixing and 10 minutes centrifugation. Solvent layers were transferred into clean tubes contain- ing 150 µL 1% formic acid, then mixed on a rotary mixer for 20 minutes and removed after 10 minutes of cen- trifugation by aspiration. From the remaining aqueous layer 20 µL was injected into the LCMSMS system.
3.4. Method Development with Some Validation for Selected Analytes
3.4.1. Instrumentation and Ion Identification
The LCMSMS analysis was carried out with an HPLC system consisting of a Perkin Elmer PE200 series auto- sampler, pump and column oven. The MSMS part was a SCIEX API 2000 Triple Quadrupole MS-MS instrument (Applied Biosystems) equipped with an electrospray in-terface (Turbo Ion Spray) set on the positive mode. Ion spray voltage was set to 5500 V. Nitrogen was used as the nebulizer gas-GS1 (30 psi), auxiliary gas-GS2 (20 psi heated to 300˚C), curtain gas (20 psi) and as the CAD gas (set on 3).
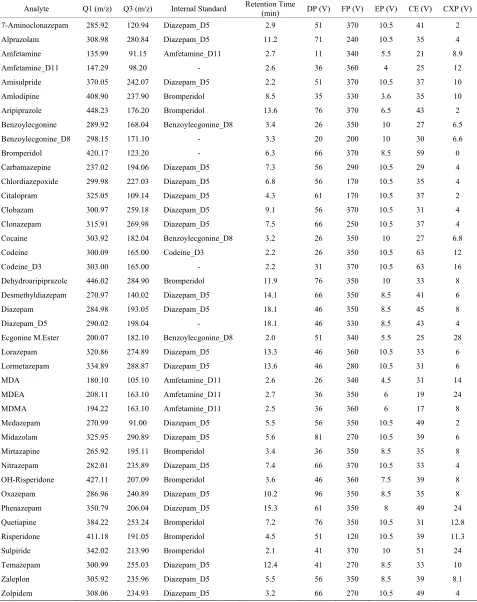
Analytes were infused at 0.25 mL/minute to the LCMSMS system at a concentration of 1 mg/L in 50% methanol/2mM ammonium acetate solution. The precur- sor and product ion identification and parameter tuning were completed by automatic and manual tuning. Opti- mum tuning parameters, precursor and product quantita- tion ions are shown in Table 1. Mobile phase was 50%
methanol, 0.1% formic acid and 2 mM ammonium ace-tate (isocratic). Separation with Altech Alltima C18 column (15 cm × 2.1 mm, 5 μm) maintained at 50˚C.
3.4.2. Comparison of Mini-Uniprep Filter Media
Three filter materials were compared by using spiked blank hair samples at concentrations of 0.5 ng/mg hair. 25 mg of blank hair were weighted out in glass tubes. Then the whole extraction/incubation method was ap- plied to all the samples. The three materials were 0.45 µm pore size Glass Microfiber (GMF), 0.2 µm pore size Polytetrafluroethylene (PTFE) and 0.2 µm pore size Polyvinylidenefluoride (PVDF) used in manufacturing
Whatman Mini-UniPrep Syringeless Filters. The filters efficiency was calculated by comparing the percentage of extraction recovery through their peak area ratio of pro- duct ion for each drug after filtration with unfiltered calibrators.
Table 2 shows clearly that the PTFE filter medium has
the greatest recovery (mean = 100%) of all the analytes while the GMF and PVDF filters (mean = 89% and 72%, respectively) reduced significantly the response of ami- sulpride and citalopram. Also the responses of medaze- pam, midazolam and zolpidem were considerably re- duced by the PVDF filter.
3.4.3. Linearity
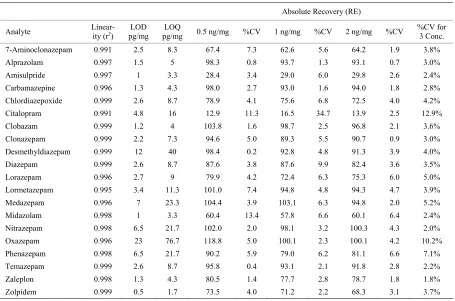
The linearity study reflects the relationship between change of spiked analyte concentration and detector re- sponse to that change [16]. It was attained by spiking hair samples with 50, 75, 100, 500, 1000 and 2000 pg/mg of each analyte. The linear correlation coefficients (r2) val- ues were better than 0.99 for all analytes.
3.4.4. LOD and LOQ
Limit of detection and limit of quantification were as- sessed by spiking blank hair with the analytes in de- creasing concentrations. The LOD and LOQ were calcu- lated at a signal to noise ratio of 3 and 10, respectively. LOD values for all analytes were 0.5 - 23 pg/mg and LOQ values were 1.7 - 76.7 pg/mg (Table 3).
3.4.5. Selectivity
Selectivity in drug analysis is the ability of an analytical method to differentiate and quantify the analyte of inter- est in the presence of other components in the sample [17]. In order to achieve that a low standard (0.1 ng/mg) of each drug from the group was injected individually into the LCMSMS system and all the other drug detec- tion windows and retention times were observed to see if there were any interfering peaks or false positive results that might appear in the same retention time and same window as the injected analyte. No interference was found on the same detection window and retention time for any of the analytes. Also drug-free hair samples showed no false positive results.
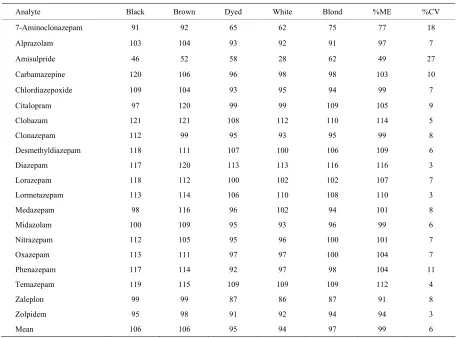
3.4.6. Matrix Effect
The matrix effect (ME) is basically the ion suppression or enhancement of the analyte peak caused by co-eluting compounds from the biological matrix (urine, blood, hair, etc). The aim of this experiment was to acquire more accurate data on the extent of matrix influence on the results when matrices come from different types of hair. As proposed by Matuszewski et al. the ME was assessed
Table 1. Optimized MRM and MS/MS parameters for analytes and internal standards.
Analyte Q1 (m/z) Q3 (m/z) Internal Standard Retention Time(min) DP (V) FP (V) EP (V) CE (V) CXP (V)
7-Aminoclonazepam 285.92 120.94 Diazepam_D5 2.9 51 370 10.5 41 2
Alprazolam 308.98 280.84 Diazepam_D5 11.2 71 240 10.5 35 4
Amfetamine 135.99 91.15 Amfetamine_D11 2.7 11 340 5.5 21 8.9
Amfetamine_D11 147.29 98.20 - 2.6 36 360 4 25 12
Amisulpride 370.05 242.07 Diazepam_D5 2.2 51 370 10.5 37 10
Amlodipine 408.90 237.90 Bromperidol 8.5 35 330 3.6 35 10
Aripiprazole 448.23 176.20 Bromperidol 13.6 76 370 6.5 43 2
Benzoylecgonine 289.92 168.04 Benzoylecgonine_D8 3.4 26 350 10 27 6.5
Benzoylecgonine_D8 298.15 171.10 - 3.3 20 200 10 30 6.6
Bromperidol 420.17 123.20 - 6.3 66 370 8.5 59 0
Carbamazepine 237.02 194.06 Diazepam_D5 7.3 56 290 10.5 29 4
Chlordiazepoxide 299.98 227.03 Diazepam_D5 6.8 56 170 10.5 35 4
Citalopram 325.05 109.14 Diazepam_D5 4.3 61 170 10.5 37 2
Clobazam 300.97 259.18 Diazepam_D5 9.1 56 370 10.5 31 4
Clonazepam 315.91 269.98 Diazepam_D5 7.5 66 250 10.5 37 4
Cocaine 303.92 182.04 Benzoylecgonine_D8 3.2 26 350 10 27 6.8
Codeine 300.09 165.00 Codeine_D3 2.2 26 350 10.5 63 12
Codeine_D3 303.00 165.00 - 2.2 31 370 10.5 63 16
Dehydroaripiprazole 446.02 284.90 Bromperidol 11.9 76 350 10 33 8
Desmethyldiazepam 270.97 140.02 Diazepam_D5 14.1 66 350 8.5 41 6
Diazepam 284.98 193.05 Diazepam_D5 18.1 46 350 8.5 45 8
Diazepam_D5 290.02 198.04 - 18.1 46 330 8.5 43 4
Ecgonine M.Ester 200.07 182.10 Benzoylecgonine_D8 2.0 51 340 5.5 25 28
Lorazepam 320.86 274.89 Diazepam_D5 13.3 46 360 10.5 33 6
Lormetazepam 334.89 288.87 Diazepam_D5 13.6 46 280 10.5 31 6
MDA 180.10 105.10 Amfetamine_D11 2.6 26 340 4.5 31 14
MDEA 208.11 163.10 Amfetamine_D11 2.7 36 350 6 19 24
MDMA 194.22 163.10 Amfetamine_D11 2.5 36 360 6 17 8
Medazepam 270.99 91.00 Diazepam_D5 5.5 56 350 10.5 49 2
Midazolam 325.95 290.89 Diazepam_D5 5.6 81 270 10.5 39 6
Mirtazapine 265.92 195.11 Bromperidol 3.4 36 350 8.5 35 8
Nitrazepam 282.01 235.89 Diazepam_D5 7.4 66 370 10.5 33 4
OH-Risperidone 427.11 207.09 Bromperidol 3.6 46 360 7.5 39 8
Oxazepam 286.96 240.89 Diazepam_D5 10.2 96 350 8.5 35 8
Phenazepam 350.79 206.04 Diazepam_D5 15.3 61 350 8 49 24
Quetiapine 384.22 253.24 Bromperidol 7.2 76 350 10.5 31 12.8
Risperidone 411.18 191.05 Bromperidol 4.5 51 120 10.5 39 11.3
Sulpiride 342.02 213.90 Bromperidol 2.1 41 370 10 51 24
Temazepam 300.99 255.03 Diazepam_D5 12.4 41 270 8.5 33 10
Zaleplon 305.92 235.96 Diazepam_D5 5.5 56 350 8.5 39 8.1
Zolpidem 308.06 234.93 Diazepam_D5 3.2 66 270 10.5 49 4
Q1 = precursor ion, Q3 = product ion, DP = declustering potential, FP = focusing potential, EP = entrance potential, CE = collision energy, CXP = collision cell xit potential.
Table 2. Mini-UniPrep filter media: comparison of results for % recovery of 0.5 ng/mg spiked analytes.
Analyte GMF PTFE PVDF
7-Aminoclonazepam 114 94 93
Alprazolam 100 98 101
Amisulpride 7 92 21
Carbamazepine 108 98 94
Chlordiazepoxide 116 99 84
Citalopram 7 113 <1
Clobazam 106 100 94
Clonazepam 103 104 93
Desmethyldiazepam 99 100 101
Diazepam 103 99 98
Lorazepam 104 97 99
Lormetazepam 109 96 94
Medazepam 86 100 2
Midazolam 59 104 25
Nitrazepam 109 97 93
Oxazepam 105 102 92
Phenazepam 105 103 92
Temazepam 100 101 99
Zaleplon 106 96 98
Zolpidem 100 96 18
Mean 92.3 99.5 78.5
GMF = Glass Microfiber, PTFE = Polytetrafluroethylene, PVDF = Polyvinylidenefluoride.
Table 3. Linearity, LOD, LOQ and Absolute Recovery (RE) results for 0.5, 1 and 2 ng/mg of analytes (n = 3). Absolute Recovery (RE)
Analyte Linear-ity (r2) pg/mg LOD pg/mgLOQ 0.5 ng/mg %CV 1 ng/mg %CV 2 ng/mg %CV %CV for 3 Conc.
7-Aminoclonazepam 0.991 2.5 8.3 67.4 7.3 62.6 5.6 64.2 1.9 3.8%
Alprazolam 0.997 1.5 5 98.3 0.8 93.7 1.3 93.1 0.7 3.0%
Amisulpride 0.997 1 3.3 28.4 3.4 29.0 6.0 29.8 2.6 2.4%
Carbamazepine 0.996 1.3 4.3 98.0 2.7 93.0 1.6 94.0 1.8 2.8%
Chlordiazepoxide 0.999 2.6 8.7 78.9 4.1 75.6 6.8 72.5 4.0 4.2%
Citalopram 0.991 4.8 16 12.9 11.3 16.5 34.7 13.9 2.5 12.9%
Clobazam 0.999 1.2 4 103.8 1.6 98.7 2.5 96.8 2.1 3.6%
Clonazepam 0.999 2.2 7.3 94.6 5.0 89.3 5.5 90.7 0.9 3.0%
Desmethyldiazepam 0.999 12 40 98.4 0.2 92.8 4.8 91.3 3.9 4.0%
Diazepam 0.999 2.6 8.7 87.6 3.8 87.6 9.9 82.4 3.6 3.5%
Lorazepam 0.996 2.7 9 79.9 4.2 72.4 6.3 75.3 6.0 5.0%
Lormetazepam 0.995 3.4 11.3 101.0 7.4 94.8 4.8 94.3 4.7 3.9%
Medazepam 0.996 7 23.3 104.4 3.9 103.1 6.3 94.8 2.0 5.2%
Midazolam 0.998 1 3.3 60.4 13.4 57.8 6.6 60.1 6.4 2.4%
Nitrazepam 0.998 6.5 21.7 102.0 2.0 98.1 3.2 100.3 4.3 2.0%
Oxazepam 0.996 23 76.7 118.8 5.0 100.1 2.3 100.1 4.2 10.2%
Phenazepam 0.998 6.5 21.7 90.2 5.9 79.0 6.2 81.1 6.6 7.1%
Temazepam 0.999 2.6 8.7 95.8 0.4 93.1 2.1 91.8 2.8 2.2%
Zaleplon 0.998 1.3 4.3 80.5 1.4 77.7 2.8 78.7 1.8 1.8%
Zolpidem 0.999 0.5 1.7 73.5 4.0 71.2 2.2 68.3 3.1 3.7%
[image:5.595.71.526.436.737.2]3.4.7. Absolute Recovery with Methanolic Incubation
tracted drug-free hair samples from 5 different sources (black, baby-brown, black dyed, white and blonde) spiked with 0.2 ng/mg low standard solution following filtration (i.e. after extraction/incubation) with the mean
peak area of product ion of neat unextracted standards prepared in the mobile phase [18]. The percentage of the ME was calculated by dividing the mean of the extracted samples by the mean of unextracted ones according to Equation (1).
Recoveries were estimated by determining peak areas of
spiked after incubationME % 100
unextracted standard
(1)
analytes obtained when the drugs spiked with blank hair (in extraction solution) at three concentrations 0.5, 1, and 2 ng/mg (n = 3) where compared with unextracted/un- filtered standards. Therefore, this recovery takes into account all the extraction steps including filtration, incu- bation and matrix effect (absolute). The recovery was calculated as a percentage by dividing the average peak area ratio of the extracted standards over the average peak area ratio of the unextracted standards and multi- plied by 100.
This percentage represents the absolute ME (both ion
suppression and ion enhancement). good recoveries (>58%) at all three concentrations with The results in Table 3 show that all the analytes had %CV below 13.4%, except for 2 analytes which gave low recoveries (12.9% - 29.8%).
The ME results shown in Table 4 indicate that there
was no significant ion suppression or enhancement af- fecting the analytes, except with amisulpride and the metabolite of clonazepam the 7-amino. Some of the ana- lytes showed slight ion enhancement such as diazepam and clobazepam, but the rest of the drugs were within 91.4 - 110.2% ME. Also the %CV was in the range of 3.2% - 11.1% showing a good agreement level between the different hair samples.
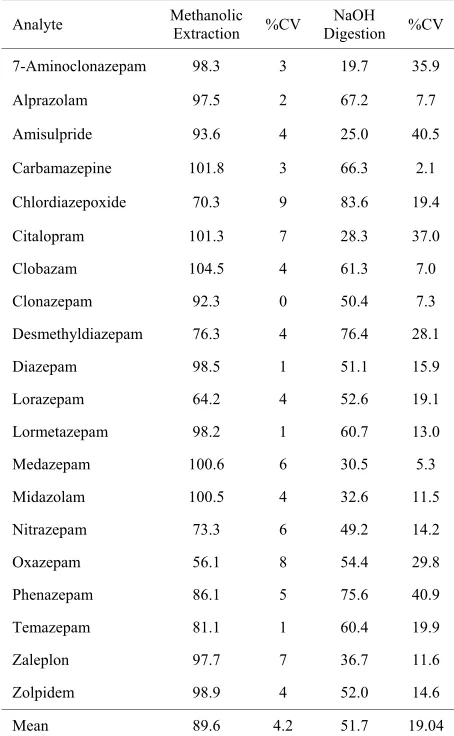
3.4.8. Stability during Methanolic Extraction
[image:6.595.69.526.397.735.2]All analytes were prepared at 0.5 mg/L (~= ng/mg) of the extraction solution (mentioned in solutions section) and incubated/sonicated with slightly harsher conditions at 50˚C for 18 h without the blank hair. Then the mean peak area ratio of product ion/internal standard was compared
Table 4. Matrix effect (ME) results for 0.2 ng/mg hair samples spiked with the analytes (n = 5).
Analyte Black Brown Dyed White Blond %ME %CV
7-Aminoclonazepam 91 92 65 62 75 77 18
Alprazolam 103 104 93 92 91 97 7
Amisulpride 46 52 58 28 62 49 27
Carbamazepine 120 106 96 98 98 103 10
Chlordiazepoxide 109 104 93 95 94 99 7
Citalopram 97 120 99 99 109 105 9
Clobazam 121 121 108 112 110 114 5
Clonazepam 112 99 95 93 95 99 8
Desmethyldiazepam 118 111 107 100 106 109 6
Diazepam 117 120 113 113 116 116 3
Lorazepam 118 112 100 102 102 107 7
Lormetazepam 113 114 106 110 108 110 3
Medazepam 98 116 96 102 94 101 8
Midazolam 100 109 95 93 96 99 6
Nitrazepam 112 105 95 96 100 101 7
Oxazepam 113 111 97 97 100 104 7
Phenazepam 117 114 92 97 98 104 11
Temazepam 119 115 109 109 109 112 4
Zaleplon 99 99 87 86 87 91 8
Zolpidem 95 98 91 92 94 94 3
Mean 106 106 95 94 97 99 6
with the mean peak area ratio of product ion/internal standard of unextracted/unincubated standards prepared in 25% MeOH at the same concentration (n = 3).
3.4.9. Stability/Recovery with Alkaline Digestion
Extraction of hair with various solvents following alka- line digestion has been widely mentioned in many pub- lications [11,19-21]. In order to investigate whether the proposed method has any advantages over the alkaline digestion method, the first step was to check how stable the analytes would be during the incubation/extraction with NaOH/MTBE. Twenty five milligrams of blank/ washed hair was incubated for 3 hours at 50˚C with the analytes at a concentration of 1 ng/mg and mixed with 0.5 mL 1 M NaOH. Extraction was with 2 mL of MTBE on an orbital shaker for 30 minutes followed with back extraction with 150 µL of 1% formic acid. Twenty mi- crolitres were injected into the LCMSMS system.
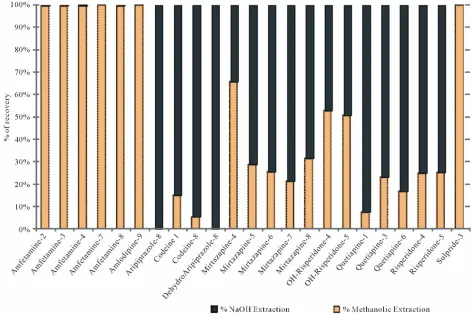
The stability results shown in Table 5 indicate that
almost all the analytes are stable under the extrac- tion/incubation conditions of the methanolic method. The least stable analyte was oxazepam with 56.1% recovery. The average recovery was 89.6% with coefficient of variation of 4.2%. While stability of analytes under the alkaline condition was remarkably lower with an average of 51.7%. The results are also demonstrated in Figure 1.
3.5. Real Samples (Methanolic vs. Alkaline Extraction)
The methanolic method was applied to 10 cases, one of them postmortem. Hair samples were taken from the posterior vertex region of the scalp. Nine of these cases were patients taking doses of different classes of basic drugs. Seven of the nine were addicts under rehabilita- tion.
About 0.6 cm segment from the root end (proximal) of each sample was decontaminated and extracted by the methanolic method. However, there was an additional step added to the analysis of those cases. After full incu- bation and extraction steps, hair sample remained in the tubes were not discarded. Instead they were re-extracted with the alkaline digestion method described earlier. Re- sults are shown in Table 6 and Figure 2 and discussed in
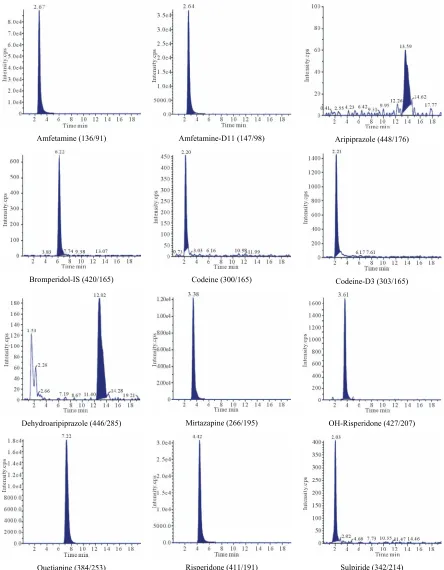
the following section. Some of the real samples chroma- tograms are shown in Figure 3.
4. Discussion and Conclusion
[image:7.595.309.536.134.502.2]The development of the proposed basic drugs extraction method was based on previous studies showing that methanolic and aqueous solution is capable of extracting drugs from hair samples [2]. However, a comparison between this extraction solution and the digestion with
Table 5. Stability (%) of the analytes after sonication/in- cubation at 50˚C/18h (n = 3) and after extraction and diges- tion with 1 M NaOH at 50˚C/3h (n = 2).
Analyte Methanolic Extraction %CV DigestionNaOH %CV
7-Aminoclonazepam 98.3 3 19.7 35.9
Alprazolam 97.5 2 67.2 7.7
Amisulpride 93.6 4 25.0 40.5
Carbamazepine 101.8 3 66.3 2.1
Chlordiazepoxide 70.3 9 83.6 19.4
Citalopram 101.3 7 28.3 37.0
Clobazam 104.5 4 61.3 7.0
Clonazepam 92.3 0 50.4 7.3
Desmethyldiazepam 76.3 4 76.4 28.1
Diazepam 98.5 1 51.1 15.9
Lorazepam 64.2 4 52.6 19.1
Lormetazepam 98.2 1 60.7 13.0
Medazepam 100.6 6 30.5 5.3
Midazolam 100.5 4 32.6 11.5
Nitrazepam 73.3 6 49.2 14.2
Oxazepam 56.1 8 54.4 29.8
Phenazepam 86.1 5 75.6 40.9
Temazepam 81.1 1 60.4 19.9
Zaleplon 97.7 7 36.7 11.6
Zolpidem 98.9 4 52.0 14.6
Mean 89.6 4.2 51.7 19.04
NaOH was not probably suggested in this specified way, particularly with general basic drugs screening. There- fore, the mixture of methanol, formic acid and acetone- trile (methanolic solution) was proposed to extract basic drugs. Methanol and 0.1% formic acid are protic solvents and capable of swelling the hair and attracting/ionizing basic drugs entrapped inside the hair shaft, at least theo- retically. Acetonitrile was added in a small amount (10%) as it was recommended by some articles [15,22].
Figure 1. Stability of analytes during methanolic and alkaline conditions.
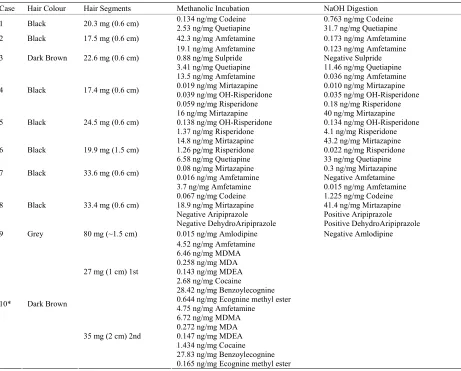
Table 6. Real samples: comparison of results.
Case Hair Colour Hair Segments Methanolic Incubation NaOH Digestion
1 Black 20.3 mg (0.6 cm) 0.134 ng/mg Codeine 2.53 ng/mg Quetiapine 0.763 ng/mg Codeine 31.7 ng/mg Quetiapine
2 Black 17.5 mg (0.6 cm) 42.3 ng/mg Amfetamine 0.173 ng/mg Amfetamine
3 Dark Brown 22.6 mg (0.6 cm)
19.1 ng/mg Amfetamine 0.88 ng/mg Sulpride 3.41 ng/mg Quetiapine
0.123 ng/mg Amfetamine Negative Sulpride 11.46 ng/mg Quetiapine
4 Black 17.4 mg (0.6 cm)
13.5 ng/mg Amfetamine 0.019 ng/mg Mirtazapine 0.039 ng/mg OH-Risperidone 0.059 ng/mg Risperidone
0.036 ng/mg Amfetamine 0.010 ng/mg Mirtazapine 0.035 ng/mg OH-Risperidone 0.18 ng/mg Risperidone
5 Black 24.5 mg (0.6 cm)
16 ng/mg Mirtazapine 0.138 ng/mg OH-Risperidone 1.37 ng/mg Risperidone
40 ng/mg Mirtazapine 0.134 ng/mg OH-Risperidone 4.1 ng/mg Risperidone
6 Black 19.9 mg (1.5 cm)
14.8 ng/mg Mirtazapine 1.26 pg/mg Risperidone 6.58 ng/mg Quetiapine
43.2 ng/mg Mirtazapine 0.022 ng/mg Risperidone 33 ng/mg Quetiapine 7 Black 33.6 mg (0.6 cm) 0.08 ng/mg Mirtazapine 0.016 ng/mg Amfetamine 0.3 ng/mg Mirtazapine Negative Amfetamine
8 Black 33.4 mg (0.6 cm)
3.7 ng/mg Amfetamine 0.067 ng/mg Codeine 18.9 ng/mg Mirtazapine Negative Aripiprazole Negative DehydroAripiprazole
0.015 ng/mg Amfetamine 1.225 ng/mg Codeine 41.4 ng/mg Mirtazapine Positive Aripiprazole Positive DehydroAripiprazole
9 Grey 80 mg (~1.5 cm) 0.015 ng/mg Amlodipine Negative Amlodipine
27 mg (1 cm) 1st
4.52 ng/mg Amfetamine 6.46 ng/mg MDMA 0.258 ng/mg MDA 0.143 ng/mg MDEA 2.68 ng/mg Cocaine 28.42 ng/mg Benzoylecognine 0.644 ng/mg Ecognine methyl ester 10* Dark Brown
35 mg (2 cm) 2nd
[image:8.595.70.531.356.727.2]Figure 2. Real samples: comparison of results for methanolic and alkaline extraction (Drug-Case No.).
It was seen from the stability results that digestion with NaOH reduces the stability of most of the analytes whereas methanolic incubation has no such effect on stability as the great majority of drugs showed >90% stability with or without blank hair.
Some method validation steps have been carried out on the methanolic method, such as recovery, LOD/LOQ, matrix effect and selectivity. Absolute recovery experi- ments showed that all the analytes have a recovery rang- ing between 58.4% and 119.3% with a CV from 0.2 to 13.4% after excluding the results of two drugs. Amisul- pride and citalopram gave low recoveries (12.9% - 29.8%, CV 2.5% - 34.7%). During the matrix effect study five different sources of hair have been incorpo- rated (different colours and ethnicities). Results showed that all the drugs have ME ranging between 91.4 and 115.6% (CV 3.2% - 11.1%) except 7-aminoclonazepam and amisulpride (ME 77% and 49.1%, CV 18.4% and 26.8%, respectively). The selectivity study also showed no major problem affecting the method selectivity as no analyte eluted in the same retention time and window of the other analytes and no false positive from blank hair.
Last but not least, analysis of authentic hair samples from a group of subjects taking basic or weak basic drugs revealed the usefulness of the proposed method at least
for the detection of basic drugs in hair. To further exam- ine the extent of extraction the same samples were di- gested with 1 M NaOH after the methanolic extraction to compare the extractability of both methods on the ad- ministered drugs in a way by using the exact same sam- ples. Results revealed that the methanolic method was able to extract most of the investigated drugs from hair samples, but the downside about it is the fact that it only extracts part of the incorporated drug in hair. In addition, this part or this percentage of the incorporated drug var- ied between the investigated compounds. Results showed that 99% to 100% of detected amfetamine from authentic hair samples was extracted by the methanolic method as shown in Figure 3, while less than 1% was revealed by
Amfetamine (136/91) Amfetamine-D11 (147/98) Aripiprazole (448/176)
Bromperidol-IS (420/165) Codeine (300/165) Codeine-D3 (303/165)
Dehydroaripiprazole (446/285) Mirtazapine (266/195) OH-Risperidone (427/207)
[image:10.595.76.520.95.665.2]Quetiapine (384/253) Risperidone (411/191) Sulpiride (342/214)
Figure 3. Some of the real sample chromatograms, between brackets are precursor ion/product ion.
its metabolite showed a 50/50 detection in both methods. Quetiapine as well showed like pattern to risperidone and mirtazapine with a 77% - 93% found with the alkaline
digestion method.
maybe powdering the samples to ensure complete release of the entrapped compounds. Although some drugs have been extracted or revealed only by methanolic method without digestion, like sulpiride and amlodipine, it does not mean that the percentage of recovery was really 100%. It is likely that these drugs were not stable under NaOH digestion which may have led to their degradation and disappearance. High pH possibly has caused hy- drolysis to both amlodipine’s ester moiety and sulpride’s amide type link.
In conclusion, the methanolic method is capable of ex- tracting most basic drugs in hair samples but only part of the total incorporated drug. As all the drug in the real samples were detected by the methanolic method ex- cept one drug, aripiprazole. Therefore, these results sug- gest that a combination of both methods (methanolic and alkaline extractions) in hair sample processing for the detection of basic and weak basic drugs seems to provide better extraction yield than either method alone. How- ever, not all basic drugs are suitable for alkaline diges- tion. A further study with more real samples is needed and preferably in comparison with other hair extraction techniques, such as powdering the hair and other diges- tion methods.
4.1. Limitations
Ideally, the method should be applied to more samples especially from subjects taking the same drugs as the drugs used in the method development. Unfortunately, only those patients who were studied agreed to partici- pate. Also, the access time on the LCMSMS was very limited and optimization of every variable was not feasi- ble. Moreover, the method is intended to analyse basic drugs in general and basic drugs are very common so it is almost impossible to include all of them. Alkaline diges- tion has limited application to only analytes stable under basic conditions, while methanolic extraction showed partial extraction ability even after 18 hours of incuba- tion.
4.2. Ethical Notes
Collection of hair samples from patients was performed after receiving the written approval of the health research ethics committee in ministry of health, Kuwait and in- formed consent was also signed by patients after expla- nation of the study and its aim.
REFERENCES
[1] I. M. Kempson and E. Lombi, “Hair Analysis as a Bio-monitor for Toxicology, Disease and Health Status,” Che- mical Society Reviews, Vol. 40, No. 7, 2011, pp. 3915- 3940. doi:10.1039/c1cs15021a
[2] P. Kintz, “Analytical And Practical Aspects of Drug Test-ing in Hair,” CRC Press, New York, 2007.
[3] F. Pragst and M. A. Balikova, “State of the Art in Hair Analysis for Detection of Drug and Alcohol Abuse,”
Clinica Chimica Acta, Vol. 370, No. 1-2, 2006, pp. 17-49.
doi:10.1016/j.cca.2006.02.019
[4] R. Smolders, K. W. Schramm, M. Nickmilder and G. Schoeters, “Applicability of Non-Invasively Collected Matrices for Human Biomonitoring,” Environmental Health, Vol. 8, No. 1, 2009, p. 8.
doi:10.1186/1476-069X-8-8
[5] F. Musshoff and B. Madea, “New Trends in Hair Analy-sis and Scientific Demands on Validation and Technical Notes,” Forensic Science International, Vol. 165, No. 2-3,
2007, pp. 204-215. doi:10.1016/j.forsciint.2006.05.024 [6] M. Villain, M. V. C. Concheiro and P. Kintz, “Screening
Method for Benzodiazepines and Hypnotics in Hair at pg/mg Level by Liquid Chromatography-Mass Spec-trometry/Mass Spectrometry,” Journal of Chromatogra-phy B, Vol. 825, No. 1, 2005, pp. 72-78.
doi:10.1016/j.jchromb.2004.12.036
[7] M. Laloup, M. Ramirez Fernandez Mdel, G. De Boeck, M. Wood, V. Maes and N. Samyn, “Validation of a Liq-uid Chromatography-Tandem Mass Spectrometry Method for the Simultaneous Determination of 26 Benzodiazepi-nes and Metabolites, Zolpidem and Zopiclone, in Blood, Urine, and Hair,” Journal of Analytical Toxicology, Vol.
29, No. 7, 2005, pp. 616-26.
[8] F. Musshoff and B. Madea, “Analytical Pitfalls in Hair Testing,” Analytical and Bioanalytical Chemistry, Vol.
388, No. 7, 2007, pp. 1475-1494. doi:10.1007/s00216-007-1288-x
[9] F. J. Couper, I. M. McIntyre and O. H. Drummer, “Ex-traction of Psychotropic Drugs from Human Scalp Hair,”
Journal of the Forensic Science, Vol. 40, No. 1, 1995, pp.
83-86.
[10] M. Josefsson, R. Kronstrand, J. Andersson and M. Roman, “Evaluation of Electrospray Ionisation Liquid Chroma-tography-Tandem Mass Spectrometry for Rational De-termination of a Number of Neuroleptics and Their Major Metabolites in Human Body Fluids and Tissues,” Journal of Chromatography B, Vol. 789, No. 1, 2003, pp. 151-
167. doi:10.1016/S1570-0232(03)00207-1
[11] J. Villamor, A. Bermejo, P. Fernandez and M. Tabernero, “TECHNICAL NOTE: A New GC-MS Method for the Determination of Five Amphetamines in Human Hair,”
Journal of Analytical Toxicology, Vol. 29, No. 2, 2005,
pp. 135-139.
[12] R. Gottardo, F. Bortolotti, G. De Paoli, J. P. Pascali, I. Miksík and F. Tagliaro, “Hair Analysis for Illicit Drugs by Using Capillary Zone Electrophoresis-Electrospray Ionization-Ion Trap Mass Spectrometry,” Journal of Chromatography A, Vol. 1159, No. 1-2, 2007, pp. 185-
189. doi:10.1016/j.chroma.2007.01.0118
No. 1, 2012, pp. 68-81.
[14] M. K. K. Nielsen, S. S. Johansen, P. W. Dalsgaard and K. Linnet, “Simultaneous Screening and Quantification of 52 Common Pharmaceuticals and Drugs of Abuse in Hair Using UPLC-TOF-MS,” Forensic Science International,
Vol. 196, No. 1-3, 2010, pp. 85-92. doi:10.1016/j.forsciint.2009.12.027
[15] S. Hegstad, H. Z. Khiabani, L. Kristoffersen, N. Kunøe, P. P. Lobmaier and A. S. Christophersen, “Drug Screening of Hair by Liquid Chromatography-Tandem Mass Spec-trometry,” Journal of Analytical Toxicology, Vol. 32, No. 5, 2008, pp. 364-372.
[16] C. Hartmann, J. Smeyers-Verbeke, D. Massart and R. McDowall, “Validation of Bioanalytical Chromatogra- phic Methods,” Journal of Pharmaceutical and Biomedi-cal Analysis, Vol. 17, No. 2, 1998, pp. 193-218. doi:10.1016/S0731-7085(97)00198-2
[17] F. T. Peters, O. H. Drummer and F. Musshoff, “Valida-tion of New Methods,” Forensic Science International, Vol. 165, No. 2-3, 2007, pp. 216-224.
doi:10.1016/j.forsciint.2006.05.021
[18] B. K. Matuszewski, M. L. Constanzer and C. M. Chavez- Eng, “Strategies for the Assessment of Matrix Effect in Quantitative Bioanalytical Methods Based on HPLC-
MS/MS,” Analytical Chemistry, Vol. 75, No. 13, 2003, pp. 3019-3030. doi:10.1021/ac020361s
[19] A. Pelander, J. Ristimaa, I. Rasanen, E. Vuori and I. Ojanperä, “Screening for Basic Drugs in Hair of Drug Addicts by Liquid Chromatography/Time-of-Flight Mass Spectrometry,” Therapeutic Drug Monitoring, Vol. 30,
No. 6, 2008, pp. 717-724.
doi:10.1097/FTD.0b013e3181897cfa
[20] M. Villain, “Determination of Bromazepam, Clonazepam and Metabolites after a Single Intake in Urine and Hair by LC-MS/MS: Application to Forensic Cases of Drug Fa-cilitated Crimes,” Forensic Science International, Vol.
145, No. 2-3, 2004, pp. 123-130.
[21] R. Stanaszek and W. Piekoszewski, “Simultaneous De-termination of Eight Underivatized Amphetamines in Hair by High-Performance Liquid Chromatography-At- mospheric Pressure Chemical Ionization Mass Spec-trometry (HPLC-APCI-MS),” Journal of Analytical Toxicology, Vol. 28, No. 2, 2004, pp. 77-85.
[22] R. Kronstrand, I. Nyström, J. Strandberg and H. Druid, “Screening for Drugs of Abuse in Hair with Ion Spray LC-MS-MS,” Forensic Science International, Vol. 145,