Static Security Constrained Generation Scheduling Using
Sensitivity Characteristics of Neural Network
M. R. Aghamohammadi*
Abstract: This paper proposes a novel approach for generation scheduling using sensitivity characteristic of a Security Analyzer Neural Network (SANN) for improving static security of power system. In this paper, the potential overloading at the post contingency steady-state associated with each line outage is proposed as a security index which is used for evaluation and enhancement of system static security. A multilayer feed forward neural network is trained as SANN for both evaluation and enhancement of system security. The input of SANN is load/generation pattern. By using sensitivity characteristic of SANN, sensitivity of security indices with respect to generation pattern is used as a guide line for generation rescheduling aimed to enhance security. Economic characteristic of generation pattern is also considered in the process of rescheduling to find an optimum generation pattern satisfying both security and economic aspects of power system. One interesting feature of the proposed approach is its ability for flexible handling of system security into generation rescheduling and compromising with the economic feature with any degree of coordination. By using SANN, several generation patterns with different level of security and cost could be evaluated which constitute the Pareto solution of the multi-objective problem. A compromised generation pattern could be found from Pareto solution with any degree of coordination between security and cost. The effectiveness of the proposed approach is studied on the IEEE 30 bus system with promising results.
Keywords: Generation Scheduling, Neural Network, Overloading, Sensitivity, Static Security.
1 Introduction1
Secure operation of a power system requires that all forms of security constraints be met during possible operating conditions. These include static constraints such as thermal limits of lines and dynamic constraints such as voltage and load-angle stability limits. Alleviation of emergency line overloading is a critical problem in power system operation. Hence an effective control action strategy is necessary to reduce the line overloads to the security limits in the minimum time. Power system security is affected by many factors. The generation pattern is one of the most dominating factors. A poorly scheduled generation pattern can reduce system security. With open access transmission in deregulated environment, poorly scheduled generation patterns and load patterns from competitive bidding, will be seen more and more often. These patterns might
Iranian Journal of Electrical & Electronic Engineering, 2008. Paper first received 19th November 2007 and in revised form 2nd
March 2008.
* M. R. Aghamohammadi is with the Department of Electrical Engineering, Iran Dynamic Research Center, Power and Water University of Technology, Tehranpars, Tehran, Iran.
E-mail: [email protected].
cause many security problems. When any potential insecurity due to a credible contingency is detected, preventive control has to be applied. One form of preventive control is generation rescheduling. The major issues in generation rescheduling are determination of the amount of generation change and the choice of generators. However, on the other hand it is well understood that generation pattern has also a dominating effect on the system economy. In order to compromise both security constraints and economy, it is necessary to find a generation pattern satisfying both security and economy requirements.
There are a significant number of literatures on preventive generation rescheduling to improve system security. In [1], a scheme for rescheduling pool generation and adjusting contract-transactions for enhancing dynamic security is presented. The procedure is based on the transient energy margin concept and brings together both technical and economic considerations. In [2], an efficient security-constrained unit commitment approach with ac constraints that obtains the minimum system operating cost while maintaining the security of power systems is presented. In [3], a method for rescheduling the real power outputs
of the generators for enhancing power system voltage stability is proposed. A regression-based method is proposed for computing sensitivities of the voltage stability margin with respect to generator outputs. In [4], the idea of coherent behavior of generators is used to find a new generation configuration with better stability behavior. In [5], an on-line decision aid tool for generation rescheduling, using Artificial Intelligence techniques, combining a knowledge base, heuristic rules, and classical algorithms is presented. There are a significant number of literatures on preventive security dispatch that is based on the optimal power flow (OPF) [4]. The main objective of this type of preventive control is enhancing static security, that is, the avoidance of voltage and line flow violations in the post-fault steady state condition. The constraints used in the OPF are line flow limits or angle separation limits imposed by stability consideration [4]. The optimal power flow program does consider both economic dispatch and security, but it requires heavy computations duty.
In the conventional approach such as OPF, system security is incorporated as inequality constraints into the generation cost minimization which are formulated as NLP or LP problems [6, 7]. However, low ability of these methods for flexible handling of security constraints within the optimum solution is a challenging feature of these methods [6, 9]. Artificial Neural Networks (ANN) hasbeen widely used in power system problems. An interesting feature of ANN is its ability for constructing a functional relationship between power system security which is a highly nonlinear characteristic, with system operating condition [10, 11]. Sensitivity analysis of system security with respect to input pattern is another attractive feature of ANN which appears as main motivation for application of ANN in solving complex security problems [10].
In this paper, a new method for generation scheduling amid alleviating line overloading which is one aspect of static security, is presented. In this method, the problem of generation scheduling amid improving static security is handled in a new approach in which, contrary to conventional methods, security is treated as a separate objective function for maximization. By this way the cost-security problem which is a complex conventional optimization problem is converted into an unconstrained minimization problem for two separate objective functions cost and security. In this paper, Neural Network is employed to construct a function for system security in term of pre contingency load/generation pattern. This functional treatment of system security by ANN provides one a fast means for easy handling and flexible incorporation of security constraints within generation scheduling. The main outstanding feature of this approach is sensitivity analysis of the input/output of SANN as a powerful tool to derive sensitivity of system security with respect to generator outputs for modification of generation patterns, which could be
considered as the main contribution of this paper. Using security analysis, different system security level in terms of generation patterns could be found and final generation pattern can be obtained very quickly with any degree of coordination between cost and security from the Pareto solution.
2 Security-Constrained Generation Scheduling Following a line outage the MW flow of other lines change and some lines may become overloaded. Generation rescheduling is one of the preventive strategies for reducing this risk of overloading. But the rescheduling should not increase any new risk of overloading for other line outages. The generation pattern with the minimum risk of post outage overloading with respect to all single line outages is referred as the most secure pattern. However, economic characteristics of generating units dictate another generation pattern which may differ from the secure one. Thus, coordination of cost and security features appears as an operation problem for such systems. The conventional approaches dealing with this matter, are mainly optimal power flow (OPF) in which economy is treated as an objective function and security as constraint condition within an optimization problem [6, 7].
Fig. 1 Shows the conceptual procedure of such methods for searching the generation pattern with a desirable degree of coordination between economy and security. For finding such generation pattern the process can be carried out as follows. First, for a given load pattern, based on an initial security level µ0, the security
constrained cost minimization problem is solved which results in a generation pattern with a corresponding degree of coordination between cost and security. Then, in order to find a generation pattern with higher security, the security level is increased to µ>µ0
(strengthening). If a desirable generation pattern can be found the process stops, otherwise the security level is decreased (relaxing) and process continues to find proper generation patterns [9], the major difficulties encountered by this approach are as follows.
1. The security level µ resulting in the desirable degree of coordination is not known a prior, so the process should be continued until such security level µ can be found.
2. Finding a desirable coordinated solution by this approach (especially nonlinear OPF) is a time consuming process which imposes a huge computational burden on the system dispatcher especially for on line application.
In order to overcome the difficulties facing by the conventional approaches, this paper proposes a new approach for security constrained generation scheduling based on ANN and its sensitivity characteristics.
Fig. 1 Conceptual structure of conventional approaches.
Fig. 2 shows the conceptual structure of the proposed approach in which economy and security aspects are treated separately but coordinated in two paths by two individual objective functions.
Fig. 2 conceptual structure of the proposed approach.
In the security path, by using SANN and its input/output sensitivity analysis [16] several generation patterns with different security level are obtained. Risk and security bear one concept with two opposite meaning which are used exchangeably in this paper. Meanwhile in the economic path, the generation cost of those patterns is evaluated. Finally, based on system requirement a desirable degree of coordination between cost and security is adopted and a final solution from different generation patterns is found. Comparing the proposed
approach to the conventional ones, the SANN based generation scheduling method can search any desirable generation pattern very fast, because it can elaborate several generation patterns with different security level very easily by using SANN's sensitivity. Furthermore, due to the separate evaluation of cost and security, final coordinated solution can be flexibly compromised according to system operation requirement. In other words, at the expense of a long training time for SANN at the off line, it would be able to create various generation patterns with different security levels in an on line environment.
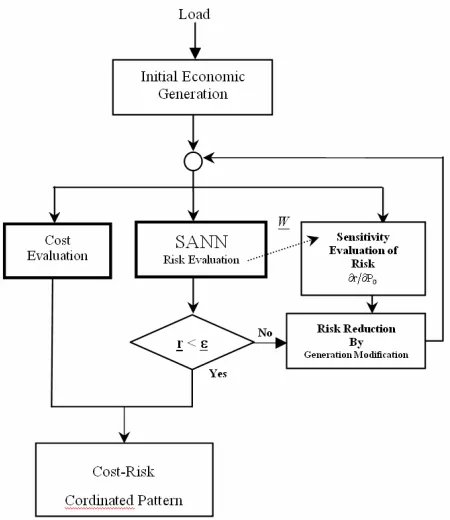
3 Generation Scheduling Using ANN's Sensitivity Fig. 3 illustrates the conceptual structure of the proposed approach. This approach consists of five main parts as follows.
1. Calculating initial economic generation pattern, 2. Risk evaluation by Security Analyzer Neural
Network (SANN),
3. Risk reduction by means of generation rescheduling using input/output sensitivity analysis of SANN,
4. Cost evaluation for each obtained pattern,
5. Coordination of cost and security for final solution.
Fig. 3 Structure of the proposed approach.
The process of the proposed approach is as followed. For a forecasted load pattern at t=t0+ ∆t, first initial economic generation pattern is computed as P . Then G0 SANN evaluates system security associated with this pattern by evaluating corresponding risk indices(r , kk =0,1,..., m). Where rk shows total potential line overloading caused by the single outage of line #k, while r0 represents system potential for overloaded at
the base case with no outage. If the risk indices show any potential for overloading, then it emerges necessary to reduce these risks by rescheduling generation pattern using input/output sensitivity of ANN [16]. After each
step of modification a new generation pattern is obtained whose security and generation cost are evaluated in parallel by the SANN and cost function respectively. Since the direction of modification determined by the SANN's sensitivity is to reduce the system risk, thus every new pattern will have a lower risk of overloading compared to the previous ones. On the other hand, since the initial pattern has the minimum cost, thus every new pattern will have a different cost greater than the economic one. Finally from several generation patterns with different cost and security level a coordinated solution is selected.
Sensitivity analysis of risk indices with respect to generators output gives us useful information about correctability of the overloading created by the line outages. For example, if the risk index of line k shows a potential for creating overloading, but with low sensitivity with respect to generators output, then it can easily be understood that the overloading caused by the outage of line #k has a poor correctability. In such cases, proper relaxation of the risk indices of such lines, directs the process of generation rescheduling in a more effective way to reach to an optimum solution.
3.1 Risk Indices
As it is mentioned before, ANN evaluates the risk indices associated with line outages. In this paper, based on the concept of performance Index (PI), for each line k, a risk index rk is introduced which can measure the
potential overloading caused by the outage of line k. The sensitivity of these indices plays an important role in the proposed algorithm for generation rescheduling. Thus, as much as meaningful construction of risk indices is a vital requirement. In this paper, for the purpose of simplicity and easy interpretation, the risk index associated with the outage of line k is defined as the total normalized line overloading created by the outage of that line. First, with respect to the outage of line #k, for each line #i a degree of overloading ovik is
defined as follows;
k max
P -Pi i k max
= if P P
k Pmax i i
ovi i i=1,..,m, k=1,..,m
k max
= 0 if P P
i i
≥
≤
(1)
where:
m : number of system lines
Pik : active power flow of line #i after outage of line #k
Pimax : thermal power limit of line #i in MW
OVik : degree of overloading of line #i due to outage of
line k
Then the risk index rk associated with the outage of line
k which constitutes the output of ANN is evaluated as follows:
k
m k i i k
r
OV
for all k
1,...,m
≠
=
= ∑
(2)Also for the base case condition (no outage) by using base case overloading OVi0 from equations (1) and
defining equation (3), a corresponding base risk index r0
is defined which shows the potential of system for being overloaded at the no outage condition.
m 0
0 i
i=k
r =
∑
OV
(3)where, OVi0 represents the degree of overloading of line
#i at the normal operating condition without any outage. A zero value for rk means no risk of overloading at the
post outage condition of line #k. However, higher value of rk shows higher risk of overloading due to the outage
of line #k.
Also a total risk index Rs is defined as in (4) which represents global system security with respect to all single line contingencies.
S
m k k=0
R =
∑
r
(4)It should be noted that the proposed risk index may mask detailed information about line overloading, but as far as we are concerned with overload alleviation in the system, this risk index and its sensitivity could give us a proper guideline for generation rescheduling to increase system security.
3.2. Process of Generation Scheduling The calculating process of the proposed approach can be explained through the following steps.
STEP (1): Initial Economic Generation Pattern
First, by means of Economic Load Dispatch (ELD) based on equal incremental cost and under the generator output constraints and load-generation balance, the economic generation pattern is evaluated as follows.
( )
mi=1
min : C t =
∑
F (Pi Gi) (5)( )
min* max*
S.t.: P <P t <P i=1,..,NG
i Gi i (6)
( )
dPmin* min i
i i o dt
-P =max. {P ,PGi t - | .∆t} (7)
( )
dPmax* max i
Pi =min.{Pi ,PGi to - | .∆t}+
dt (8)
where:
PGi (t) : output of generator # i at t=to+∆t
PGi (to) : output of generator # i at t=to
dPi/dt
|
+ : up rate limit for output of generator #i (MW/min)dPi/dt
|
−:down rate limit for output of generator #i (MW/min)Pmaxi : maximum generation limit of generator #i
Pmini : minimum generation limit of generator #i
Fi : cost function of generator #i
NG : number of generating units
At this step a relaxation factor
ε
is set and initialized for all risk indices as follows.k
ε =0, k=0,1,....,m (9)
STEP (2-A): Risk Evaluation by SANN
SANN evaluates system risk indices for the following input vector.
P={Q , P ..,P ,...,P }n 2
load i (10)
where Pi is the net injection power (p.u. MW) at bus #i and n is the total number of load/generation buses. Qload is total system reactive power load (p.u. Mvar). By presenting input vector P to the SANN, risk indices and active power loss are evaluated in the output vector as follows.
1
o k m
r={P ,r ,r ,....,r ,....,r }
loss (11)
Ploss is system active loss (p.u. MW) which is used for
evaluation of slack generation. Noting that, m is the number of lines whose outage effects is supposed to be considered in the process of security constrained generation rescheduling by SANN. These lines could be all system lines or only those lines whose outage effects are recognized to be critical.
STEP (2-B): Sensitivity Evaluation of SANN
Sensitivity of risk indices with respect to the output of all pair (i, j) of generating units are evaluated as follows.
( )
k ki j
dr dr
Srij k = - i=1,..,m, j=1,..,m
dP dP (12)
where drk/dPi and drk/dPj are sensitivities of risk index
rk with respect to generating units i and j respectively
(Appendix A).
STEP (3-A): Base Case Risk Reduction
If ro> εo,base case risk should be alleviated by the following process. Select a pair of units (i, j) such that ro
has the most negative sensitivity with respect to them
(
( )
)
min
Srij 0 <0 . However, if modification of this pair causes another big risk index to increase, then another pair should be selected. Modify the output of units i and j by the step size
α
MW as follows.( )
( )
PG t =PG t +α
i i (13
( )
( )
PGj t =PGj t -α (14)
Generation constraints of Eqs. (6) to (8) are checked. In the case of any violation, the output of the violated unit is set as follows.
max
x x
min
x x
or
max
PG =P if PG >Px x x= i j
min PG =P if PG <Px x
(15)
Modify the output of another unit such that
∆PG +∆PG =0.0i j
STEP (3-B):
Line Risk Reduction by Generation Rescheduling (a)- If rk< εk for all line outages, there is no need for generation modification and process of rescheduling is finished, otherwise modify generators output as follows. (b)- select line #k with the maximum risk index rk (rk> εk).
(c)- select a pair of units (i, j) such that rk has the most negative sensitivity with respect to them (Srij(k)<0).
However, if modification of this pair causes another big risk index to increase, then another pair should be selected.
(d)- If all pairs of units failed to reduce the risk index rk, then the criticality of line #k is realized to be irremediable and set its relaxation factor εk to rk, and repeat the process from (a).
(e)- modify units i and j by the step size α as Eq. 13 and 14.
(f)- Generation constraints of Eq. 6 to 8 are checked. In the case of any violation, set the output of the violated unit by Eq. 15, and modify another unit by
PGi PGj 0.0
∆ + ∆ =
STEP (4): Cost Evaluation
The generation cost of the modified generation pattern created in STEP (3-A) and (3-B) is evaluated by using proper cost function.
STEP (5): Cost-Risk Coordination
At the end of the process where several generation patterns with the different corresponding risk index Rs and cost have been found, a final solution can be
obtained by desirable degree of coordination between cost and risk through minimization of a coordinating function f as follows.
( )
cmin : f P .C .R
G = β + γ S (16)
where f is coordinating function and PCG is the
coordinated generation pattern which minimizes f, C and Rs are normalized cost and security index. β and γ are weighting factor for cost and risk index Rs in the final solution respectively. These factors could be adopted based on system operation policy for coordinating between security and cost.
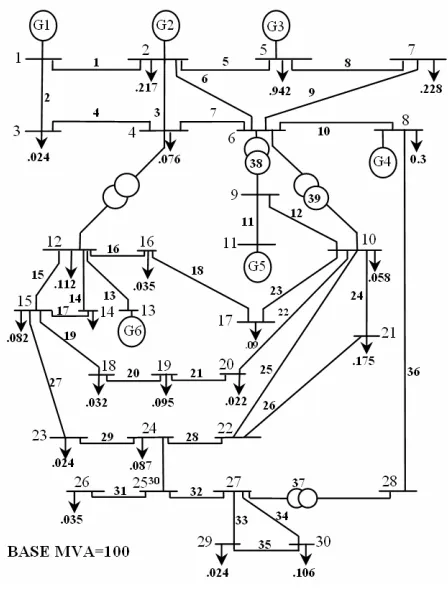
4. Simulation Study by the Proposed Approach In order to demonstrate the effectiveness of the proposed approach, IEEE 30 bus system is considered as our test system. First a three-layered back propagation ANN is adopted and trained separately as off-line, and then is put in the working mode of the Fig. 3.
Fig. 4 IEEE 30-bus system.
4.1. Training of SANN 4.1.1. Training Data
For training of ANN, three load levels 90%, 100% and 110% are selected. Fig. 4 shows IEEE 30-bus system with the 100% load level (MVA Base=100) on its buses [15]. In the feasible range of generators (Pmax, Pmin) 50 generation patterns are uniformly created. Then by
combining three load levels and 50 generation patterns, 150 load/generation patterns are created. For each pattern, load/generation of buses besides system total reactive load is used as input vector of SANN.
For each load/generation pattern, at the pre contingency condition by AC load flow simulation, all line power flows are calculated from which by using equations (1) and (3), base case risk index ro is evaluated. Then for
each line outage (line #k), single contingency analysis is carried out and post outage line power flow are computed by AC load flow calculation. By using Eq. (1) and (2), the risk indices of all lines (rk) are evaluated.
For each pattern, these risk indices besides evaluated system active loss are taken as corresponding output vector of SANN. Since the outage of lines #11, #13 and #31 are equivalent to load/generation outage, and also outage of lines #33, #34 and #35 have no effect on other line flows, thus their outages are not considered [7]. In order to include the effect of voltage drop on the risk indices, especially at the heavy load condition, during training data preparation, the limits of all reactive power devices and also transformer tap changer are included in the load flow simulation.
150 patterns are divided into two training and test groups each containing 75 patterns. The training/test patterns are elaborated in such way that they contain both secure and insecure states of the system with respect to the single outage of all lines. In the other words, they almost cover secure and insecure space of the system.
4.1.2 Structure of SANN
According to the number of load/generation buses and the number of lines whose single outage contingencies are considered in the process of security constrained generation rescheduling, a three-layered back propagation ANN with the following structure is adopted.
Input layer: 24 neurons Hidden layer: 17 neurons Output layer: 36 neurons
The number of hidden neurons has been determined by experiment. For this purpose, for different number of hidden neuron in the range of 10 to 40, the training and test error of SANN for 10000 epoch of training is calculated and taken as a performance index. Then the minimum number of neuron which results in minimum training/test error is adopted for hidden layer. Fig. 5 shows the variation of training /test error of SANN after 10000 training epoch with respect to the number of hidden neurons.
By 40000 epoch of training, the training error (mean square) reached to 0.0018. Then SANN is tested by the 75 unseen test patterns with the test error of 0.0019. After training and test, SANN is put in the working mode of the proposed approach.
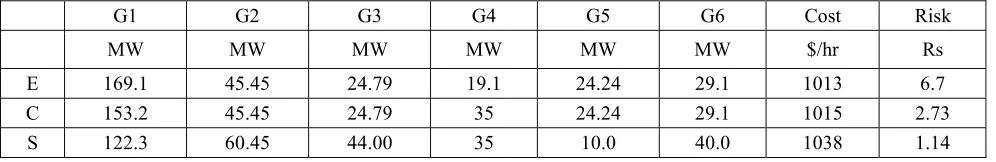
4.2. Case Study for 110% Load Level The proposed approach is tested for a load level of 110% (311.74MW) on IEEE 30-bus system. The system-load data are taken from [15]. Table 1 shows the evaluated generation patterns and their associated cost and risk index Rs.
In table 1, E, S and C refer to the Economic, Secure and Coordinated generation pattern respectively. Rs is the system total risk calculated by Eq. (4). The initial economic solution is obtained by ELD which has the minimum cost but high risk of overloading. The most secure generation pattern is obtained by the sensitivity analysis of SANN through 16 iterations of rescheduling
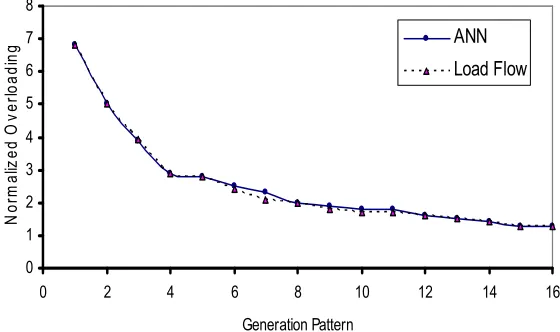
process, it has the minimum risk of overloading but with high generation cost. Figs. 6 and 7 show system generation cost and risk Rs for 16 generation patterns created through the STEP (3-A) and (3-B) of the proposed generation scheduling approach. The modification step size α is 5 MW.
At the end of rescheduling process the risk indices of lines #10, #36 and #37 are found uncorrectable with the relaxation factors of 0.23, 0.41 and 0.41 respectively. It is because generators #4, #5 and #6 are reached to their upper/lower limits and could no further contribute in risk reduction of these lines.
0 0.01 0.02 0.03 0.04 0.05 0.06
0 5 10 15 20 25 30 35
No of Hidden neurons
M
ea
n
s
q
u
ar
e
er
ro
r
Training Error
Test Error
Fig. 5 Variation of training/test error for 10000 epoch training.
Load = 311.74 MW
1010 1015 1020 1025 1030 1035 1040 1045
0 2 4 6 8 10 12 14 16
Generation pattern
C
o
s
t
$
/h
r
Fig. 6 Variation of generation cost during generation rescheduling.
Table 1. Generation patterns and their cost and risk index Rs.
G1 G2 G3 G4 G5 G6 Cost Risk
MW MW MW MW MW MW $/hr Rs
E 169.1 45.45 24.79 19.1 24.24 29.1 1013 6.7
C 153.2 45.45 24.79 35 24.24 29.1 1015 2.73
S 122.3 60.45 44.00 35 10.0 40.0 1038 1.14
In Fig. 7, the dotted line shows system total risk Rs evaluated by the conventional line outage contingency analysis using AC load flow calculation. Close coincidence of these two results confirm the accuracy and capability of the proposed SANN for risk evaluation.
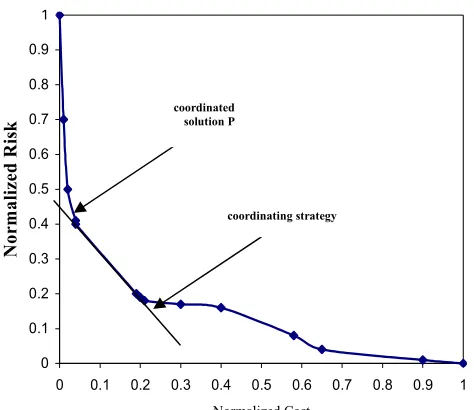
Fig. 8 shows the Pareto solution obtained by the proposed approach for the various generation patterns with different level of cost and risk Rs. In this figure for the coordination purpose, cost and risk in Eq. (16) are normalized as follows.
min min
max min max min
^ C - C ^ Rs - Rs
C = Rs =
C - C Rs -Rs (17)
where Cmin, Rsmin, Cmax and Rsmax are minimum and maximum values for cost and system risk respectively in Figs. 6 and 7. As it can be seen, using the Pareto solution of Fig. 8, for a desirable coordinating strategy
( )
β γ, , a coordinated solution PcG can be found very easily. Noting that practical determination of weighting factors β and γ in Eq. (15) depends on the policy of the electric power companies for compromising system cost with security. In this paper, for the weighting factors given by Eq. (18), a coordinated solution is obtained which is the 5th generation pattern of the Pareto solution and the coordinated solution shown in table 1.β = γ = 0.5 (18)
4.3. Generation scheduling for load increase pattern
In this case, the proposed approach is tested for generation scheduling during a load increase pattern of 5.66 MW/min. Load pick up capability of units are
adopted as in appendix B. Figs. 9 and 10 show risk index Rs and generation cost, associated with the generation patterns evaluated during load increase. The economic solutions are obtained by ELD. The secure solutions are computed by the proposed approach. As it can be seen, by the proper modification of economic patterns, system security is increased at the expense of cost increase. Also for each load level, according to the coordinating parameters of Eq. 18, a coordinated solution is found which lies between economic and secure solutions. As it can be seen for coordinated solution by small increase in system risk Rs compared to the most secure pattern, generation cost has decreased close to the economic pattern.
5. Conclusions
In this paper, a novel approach for static security constrained generation scheduling in power system is presented. In this approach, functional representation of system security by means of neural network provides us a very fast and reliable tool for system security evaluation and involvement into generation scheduling. ANN performs as a functional representation of system risk for overloading. Sensitivity analysis of risk indices with respect to generation pattern extracted by ANN is the most interesting feature of this approach which performs as a powerful tool for security constrained generation rescheduling. Also sensitivity of risk indices indicates the degree of correctability of post outage overloading associated with line outages. As a result of this functional treatment of system security, it is easily possible to involve security constraints with flexible relaxation into the generation scheduling. Also flexible coordination of cost and security with the desirable coordination policy is possible. Although, the proposed risk indices does not give us a detail information about overloaded lines, however as far we are concern with overload alleviation, these indices and their sensitivities can perform efficiently.
0 1 2 3 4 5 6 7 8
0 2 4 6 8 10 12 14 16
Generation Pattern
N
o
rm
a
liz
e
d
O
v
e
rl
o
a
d
in
g ANN
Load Flow
Fig. 7. Variation of system total risk during generation rescheduling.
0 0.1 0.2 0.3 0.4 0.5 0.6 0.7 0.8 0.9 1
0 0.1 0.2 0.3 0.4 0.5 0.6 0.7 0.8 0.9 1
Normalized Cost
N
o
rm
a
li
ze
d
R
is
k
Fig. 8 Pareto solution for generation rescheduling.
0 0.5 1 1.5 2 2.5 3 3.5 4 4.5 5
250 260 270 280 290 300 310 320 Load (MW)
R
S
-
N
o
rm
a
liz
e
d
O
v
e
rl
o
d
in
g
Economic
Secure
Coordinated
Fig. 9 System total Risk during load-pickup by 3 types of generation pattern.
800 850 900 950 1000 1050 1100
250 260 270 280 290 300 310 320
Load (MW)
c
o
s
t
($
/h
r)
Economic Secure Coordinated
Fig. 10 Generation cost during load- pickup by 3 types of generation pattern.
coordinating strategy
coordinated solution P
In this paper, ANN is primarily trained to evaluate the effect of load/generation pattern on line overloading. But the effect of other control actions like phase shifter, HVDC line and load shedding can be included by proper modeling of bus injection change in the training data. Application of ANN in spite of aforementioned advantageous imposes a long time for data preparation and its training on this approach. But it can be justified by spending a long time at the off-line for fast operation in on-line. Power system topology dependency of ANN is another shortage of this approach, but a robust ANN with respect to system topology which is under investigation by the authors can improve this limitation.
References
[1] Kumar A. David and Xujun Lin, “Dynamic Security Enhancement in Power-Market Systems,” IEEE Transactions on Power Systems, Vol. 17, No. 2, pp. 431–438, May 2002.
[2] Yong Fu, Shahidehpour M., and Zuyi Li, “Security-Constrained Unit Commitment With AC Constraints,” IEEE Transactions on Power Systems, Vol 20, Issue 3, pp: 1538-1550, Aug. 2005.
[3] Chakrabarti S. and Jeyasurya B., “Sensitivity-based Generation Rescheduling for Multicontingency Voltage Stability Enhancement,” Power Engineering Society General Meeting, 2006. IEEE, Issue 6, pp. 18-22, June 2006.
[4] Ding-HehKuo A. B., “A Generation Rescheduling Method to Increase the Dynamic Security of Power Sysyem,” IEEE Transactions on Power Systems, Vol. 10, No. 1, pp. 68–76, Feb. 1995.
[5] Jourdin P., Vintache P., Heilbronn B., Lagrange V., Cartignies E., Millot P., “Description of an On-Line Decision-Aid Tool For Generation-Load Balance Control,” IEEE Transactions on Power Systems, Vol. 9, No. 1, pp. 241–247, Feb. 1994. [6] Stott B., Alsac O., and Monticeilli A. J., “Security
analysis and Optimization,” Proc of the IEEE, No. 12, Vol. 75, pp. 1623-1644, Dec. 1987. [7] Monticelli A., Pereira M. V. F. and Granville S.,
“Security constrained Optimal Power Flow with Post-Contingency corrective Rescheduling,” IEEE Trans. Power System, Vol. 2, pp. 175–180, Feb. 1987.
[8] Crisan O. and Mohtadi M. A. “Efficient identification of binding inequality constraints in the optimal flow approach,” IEE Proc.-C, Vol. 139, No. 5, pp. 365–370, Sept. 1992.
[9] Almeida F. D., Galiana F. D.,and Soares S. “A General Parametric optimal Flow,” IEEE Trans. Power system, Vol. 9, No. 1, Feb 1994. and PICA Conference, 1993. Conference Proceedings, pp. 66-73, May 1993.
[10] Fidalgo J. N., Pecas Lopes J. A., Miranda V., and Almeida L. B., “Fast Assessment of Transient Stability Margins by a Neural Network Approach,” Proc. 10th PSCC, Avignon, pp. 1029– 1035, August 30, 1993.
[11] Saitoh H., Shimotori Y., and Toyoda J., “Neural Network Based Preventive Control Support System for Power System Stability Enhancement,” proc. of the 1st International Forum on ANNPS, pp. 432-438, Seattle, Washington July 23-26, 1991.
[12] Aghamohammadi, M. R., Saitoh H., and Toyoda J., “Enhancement of Neural Network based contingency analysis by power network reduction,” Trans IEEJ, Vol. 114-B, No. 6, pp. 586-594, 1994.
[13] Aghamohammadi M. R., Saitoh H., and Toyoda J., “Contingency-constrained generation scheduling based on line index extracted by Neural Network,” International conference of ISAP'94, France, Montpellier, pp. 593-600, Sept. 5-9, 1994.
[14] Zurada J. M., Introduction to Artificial Neural Network, West Publishing Company, 1992. [15] Leondes C. T., Control and dynamic system,
Academic Press, California, part 2 of 4, pp. 329-332, 1991.
[16] Aghamohammadi M. R. and Mohammadian M., “Sensitivity characteristic of neural network as a tool for analyzing and improving voltage stability,” Transmission and Distribution Conference 2002 Asia pacific IEEE/PES, Volum 2, pp. 1128–1132, 6-10 Oct. 2002.
Appendix A
For a three layer back propagation ANN, the sensitivity of kth output neuron (rk) with respect to ith input neuron (Pi) can be evaluated from Eq. (A1) derived based on the chain rule [9].
k k
i
dΦ NH
dr dr h
= W2 . W1
kh hi
dP dσk h=1∑ dψh (A1)
where: σ ,r
k k : Input and output of the k
th
output neuron.
ψ ,Φ
h h: Input and output of the h
th
hidden neuron.
W2
kh : The connecting weight from k
th
output neuron
to the hth hidden neuron. W1
hi : The connecting weight from h
th
hidden neuron
to the ith input neuron.
NH : The number of neurons at hidden layer.
Appendix B
Table B1: Generation characteristics
Cost parameter (MW) Mvar (MW/min.)
Unit AP BP CP Pmax Pmin Qmax dp/dtl+ dP/dtl-
1 20 1.0 .005 200 50 100 8 -8 2 40 1.6 .012 80 20 50 4 -4 3 60 1.6 .022 50 15 30 2 -2 4 100 2.5 .005 35 10 25 1.5 -1.5 5 25 2.4 .006 30 8 20 1.0 -1.0 6 120 2.4 .005 40 12 25 1.2 -1.2
where the cost function of unit #i is as follows.
Fi=. (1000APi + BPi . Pi + CPi. Pi2)
$
MWh (B1)Mohammad Reza Aghamohammadi
was born in Iran on August 5, 1955. He received his B.Sc. degree from Sharif University of Technology in 1979, M.Sc. degree from Manchester University (UMIST) in 1985 and his Ph.D. from Tohoku University, Japan in 1994.
His research interest includes application of Neural Network for power system security assessment and operation.