San Francisco Crime Visualization
Darshan Shah
Department of Information Science and Technology Rochester Institute of Technology
Rochester, New York, USA
Ryan Leonard
Department of Information Science and Technology Rochester Institute of Technology
Rochester, New York, USA
ABSTRACT
The purpose of this analysis was to visualize San Francisco crime data from 2003 to 2015 over space and time. The city was divided by police districts and then analyzed with the main focus on violent crimes. Geospatial analysis like Hotspot and Tracking Analysis were performed along with statistical data exploration to gain insights. The tools used for the analysis were ArcGIS Pro, ArcMap, and Tableau. Insights such as trends in the crime rate over the years, which day of the week is criminally more active, which police districts are prone to violent crimes and also hotspots where the crime rate is high than usual were few of the insights achieved after the analysis. The conclusions obtained were consistent with information derived from the literature regarding why the regions with hotspots were found to have a considerable amount of criminal activity.
Keywords
Crime visualization, geospatial analysis, hotspots, statistical data exploration, ArcGIS, Tableau.
1.
INTRODUCTION
As reported by Neighborhood Scout (2014), San Francisco, California is determined to be safer than only 3% of all US cities [1]. The chances of being a victim of a violent crime in San Francisco are 1 in 139 while in the state of California in entirety; the chance is only 1 in 225. This leads to the presumption that San Francisco’s violent crime problem is a topic worth exploring. This analysis utilizes open source crime data from San Francisco to perform violent crime analysis over space and time using geographic visualization software. Four regions and five types of violent crime were chosen as the focus of this analysis. In part, these selections were made as a result of preliminary data analysis which will be discussed later in this paper. Hotspot analysis, as well as tracking analysis, were used in the geographic visualization component of this study. The scope of this paper is data visualization and interpretation. However, this work could be used to aid other tasks related to crime analysis such as crime classification by offering notable trends and patterns within the data. The ideas learned from this paper can also be applied to other cities apart from San Francisco or also to other countries.
This paper seeks to improve the understanding of criminal behavior over space and time in San Francisco. In particular, violent crime has been chosen to be the focus due to the information provided by Neighborhood Scout and also preliminary data analysis was conducted, and it was found that violent crimes were major types of crimes occurring in San Francisco. The primary question to be answered is whether or not there are meaningful cyclical patterns of violent crime through space and time within different areas in San Francisco. The secondary question is whether or not particular crimes are more prone within certain geographic regions. Another question was which are safe and dangerous
areas in San Francisco along with which days are more criminally active.
2.
RELATED WORK
Using crime data from 2015, Venturini and Baralis (2016) found that occurrences of vehicle theft in San Francisco were more likely in different geographic areas depending on the day of the week [2]. While vehicle theft is not considered to be a violent crime, one could hypothesize that there would be similar findings across different types of crimes including those considered violent. McDowal, Loftin, and Pate (2012) consider the popular theory that the number of violent crimes is positively correlated with the temperature and thus are more likely to occur during warmer months (nationwide) [3]. The authors conclude that there is evidence to support this as a general guideline however it is noted that, for most crimes, the patterns of behavior differed between geographic areas. This along with the findings of Venturini and Baralis (2016) suggest that spatial-temporal analysis of crime should continue to be an area of focus.
To emphasize the value of this type of analysis, Wu (2016) found that it was possible to classify the type of crime committed by using spatial-temporal data from San Francisco [4]. While the author was only able to reach a classification accuracy of 28.51%, there are presumably ways to increase the accuracy through improved methodology. In this instance, the dataset was the same as the one selected for this project. The author visualized the number of occurrences of the most common crimes over a 12-month span (aggregated over the years 2003-2015) using line charts. Heat maps were also used to visualize particular crimes over the days of the week and hours in each day. Additionally, the author did use geographic visualizations to show which areas experienced more instances of particular crimes.
Herrmann (2015) used New York City violent crime data and noted that hotspots shifted spatially over time [5]. This adds complexity to the issue and highlights the need for visual analysis over both space and time. The author notes that it is often possible to identify patterns of crime within a hotspot over time but adds that effective understanding of crime within a region requires detailed analysis of each hotspot rather than the region as a whole. The concept of shifting hotspots can reasonably lead one to the conclusion that the aggregated type of analysis done by Wu (2016) is inadequate. This could be one of the causes of such a poor classification accuracy.
Francisco crime data would likely be a further improvement if modern visualization techniques are used. To further justify the decision of the authors to focus on specific regions of San Francisco, Weisburd, Bernasco, and Bruinsma (2009) argue that the analysis of crime over vast geographic areas is misguided [7].
According to the authors, social, environmental factors of any narrowed geographic area affect the criminal behavior within the region. Also, it is suggested that it is easier to examine the significance of crime patterns on a smaller scale. In conjunction, Bernasco and Block (2011) studied crime patterns in Chicago and suggest that crime analysis should not be done on a per-block basis [8]. The argument is that individual blocks often have a modest population and therefore do not allow for a comprehensive view of crime patterns. According to the authors, groups of blocks or regions
are more appropriate for this type of analysis which is consistent with work reported in this paper.
3.
DATASET EXPLORATION
[image:2.595.46.514.263.538.2]The original dataset consisted of 878,049 records spanning from 2003 to 2015. It is notable that 2015 is incomplete and therefore data from this year is not used in the tracking analysis. The attributes included are Date/Time, Category (of crime), Description (of crime), Day of Week, Address, Police District (pdDistrict), Resolution, and X/Y Coordinates. A detailed description of each attribute is mentioned in Table 1. For our analysis, the relevant attributes are Date, Category, Police District, and the geospatial coordinate attributes, X and Y.
Table 1. Dataset Attributes
Column name
Type Description
Dates Date/time The date and time of the crime. Example: 2011-01-01 00:01:00
Category String There are 39 unique categories of crime. Example: Assault.
Descript String There are total 879 descriptions of the crime occurred.
Example: GRAND THEFT FROM LOCKED AUTO
Day of
Week
String The day of the crime. Example: Friday
Address String Address where the crime occurred. Example: 800 Block of BRYANT ST
X Decimal Longitude coordinates of the crime location.
Range: -122.5136 to -120.5000
Y Decimal Latitude coordinates of the crime location.
Range: 37.70788 to 90.0000
PdDistrict String The Police district that applies to the crime location. There are total ten police districts. Example: Bayview
Resolution String There are 15 types of resolutions about what action was taken for that particular crime with ‘None’ as the dominant type.
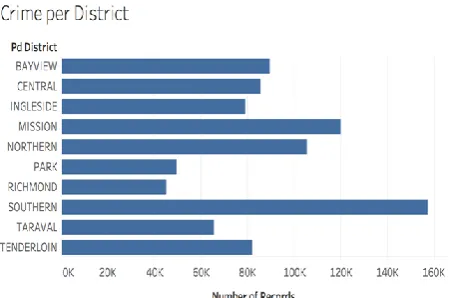
[image:2.595.48.523.269.530.2]After dividing the data by police district, the number of crimes per district can be viewed in Figure 1. Concerning this visualization, data from all years are aggregated.
Figure 1: Number of crime per police district
[image:2.595.57.282.590.739.2]offenses. The reason for this crime selection is the perceived level of violence of the chosen crimes. This leaves the subset at 58,025 records which is a suitable number for the processing capability of ArcGIS. There are significantly more occurrences of assault than there are of the other four chosen crimes. It makes intuitive sense that there are fewer instances of serious violent crimes such as kidnapping then there are of less serious crimes such as vandalism.
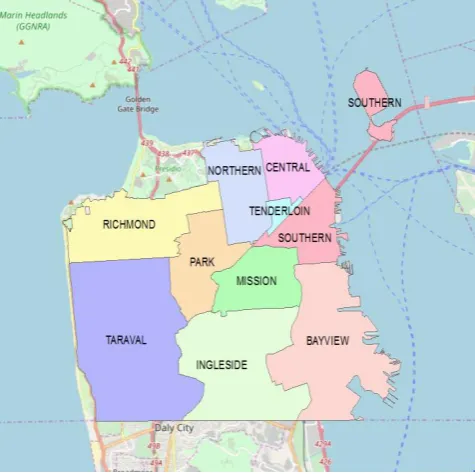
[image:3.595.317.555.73.310.2]ArcGIS Pro was chosen as the tool for the geographic visualization and analysis. In preparation, a shape file was used to place a layer over the San Francisco map depicting the police district areas (See Figure 3). Later discussion explains the methodology behind the hotspot and tracking analyses.
Figure 2: Frequency of each crime over the four police districts
Figure 3: San Francisco Police Districts
4.
METHODOLOGY
4.1
Hotspot Analysis
The initial step was to project all of the data onto the map. This includes data from all years and instances of all five chosen crimes. This alone is not useful as there are too many points, many of which overlap one another. Because of this, integration was used to aggregate all crimes that occurred within a radius of 300 meters into single points. At this point, the issue is that there is no indication of how many original points are included in each integrated point. For this purpose, the size of each of the points was weighted (ICOUNT) using the Collect Events method. The larger the point, the greater the number of crimes that have occurred within the 300meter radius. Next, the incremental spatial analysis was attempted to test whether or not there was significant autocorrelation anywhere on the map. Unfortunately, there was no significant variance or peak value found. The reason for this is almost certainly the large size of the dataset and the proximity of the points. Nonetheless, hot spot analysis and inverse distance weighted interpolation (IDW) was performed to generate the hotspot map.
Due to the previously noted limitations caused by the quantity and proximity of the data points, an optimized hotspot analysis was conducted. Data for each of the four police districts were split into their own separate excel files. A geodatabase was created which stored the four feature classes, each representing one of the police districts: Northern, Southern, Bayview, and Mission and each excel file were loaded to the respective Feature class. Next, each feature class files were used as input feature and the count incidence with hexagon grid option was selected with the police district shapefile as a bounding polygon. Each file generated individual hot spots.
[image:3.595.58.287.240.584.2]hypothesis that crimes today are more likely to occur in the hotspots discovered in this analysis.
4.2
Tracking Analysis
In an attempt to test the validity of the hotspot analysis, tracking analysis was employed. The goal in using tracking analysis is to spot trends in crime over both space and time. Data from all years were used excluding 2015 because data from only half of the year was collected. First, a video was produced that depicted the occurrences of all five crimes over time where each second is representative of a year. This visualization was overbearing and did not allow the viewer to discern any trends or patterns. As a result, five more videos were made, one for each crime.
5.
RESULTS
After performing the statistical and geospatial analysis, the results and insights obtained were divided into three major categories. The first category consisted of the results obtained from statistical analysis obtained from Tableau. The second category consisted of the results obtained from the hotspot analysis followed by third category depicting insights from Tracking analysts.
5.1
Statistical analysis
According to Figure 1 and 3., which shows crime per district and the location of each region on the map respectively, it can be said that the east coast of San Francisco’s (Richmond, Park, and Taraval ) is significantly safer than the east coast (Southern, Mission, etc.). For example, Southern has four times the amount of crimes as Richmond. Thus, for any future visits to San Francisco, it's highly recommended to stay on the eastern part of San Francisco.
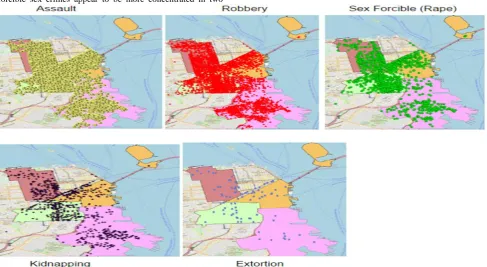
Further, the crimes based on their geographical location (longitude and latitude) were visualized to investigate any patterns of crime as seen in Figure 6 and found that assault is the most common crime and it is difficult to discern any patterns of this crime. However, instances of robbery and forcible sex crimes appear to be more concentrated in two
[image:4.595.331.531.212.409.2]locations. The first is in the center area between Mission, Northern, and Southern. The second is in the center of Bayview area. As for kidnapping and extortion, there were not enough instances of these crimes to see any clear patterns. Moreover, location-based patterns were more investigated by visualizing crimes per block as seen in Figure 5. It was found that one block has significantly more crimes than any other block (800 Block of Bryant Street). According to Bansal (2013), this area is known for having a considerable amount of crime [9]. Furthermore, Fagan (2018) notes that there is a large population of homeless people living in that location which may explain the higher crimes rate [10].
Figure 5: Crimes per Block
[image:4.595.56.544.475.742.2]To investigate crimes over time, three more visualizations were created. The first of the three visualizations was the number of crimes of entire the 12 years from 2003 to early 2015. Figure 7 shows the accumulated crimes for each year in all four regions. As spike in crime was observed in 2006 and 2008. According to Frieden (2006), 2006 had the largest spike in violent crimes since 1991, and the reasons behind this spike are not clear, and it may be a one-year anomaly [11]. Colvin (2013) posits that the crime spike in 2008 was a result of the start of the Great Recession [12].
Figure 7: Crimes per district overtime
[image:5.595.54.300.181.394.2]Secondly, crimes by month were visualized as seen in Figure 8. Two spikes in May and October were observed as well as and a significant decrease in the number of crimes in August. A concrete explanation for this behavior was not found. A possible explanation was that the crimes increase in May since it is at the beginning of the summer and generally the number of crimes increase over the summer due to the weather being warmer. As for October, it may be related to the holiday season being near which is commonly thought of as being responsible for an increase in crime.
Figure 8: Crimes over months
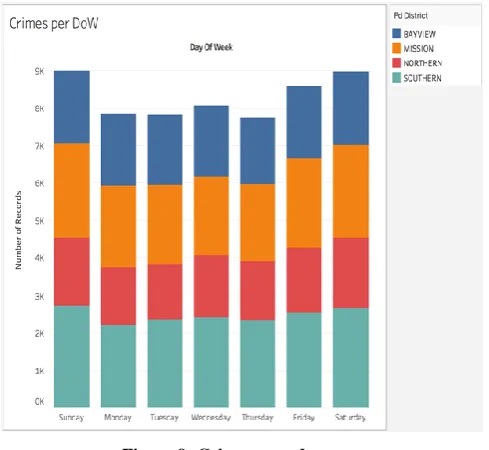
Thirdly, crimes are visualized over the days of the week as seen on Figure 9. It was observed that the crime rate on weekends is much higher than on weekdays.
Figure 9: Crimes over days
5.2
Hotspot Analysis
[image:5.595.316.550.369.583.2]According to the output of the original hot spot analysis (See Figure 10.), it was discovered that only four hotspots were found and a couple of them were not even in the police districts that were being analyzed.
Figure 10: Original hot spot analysis
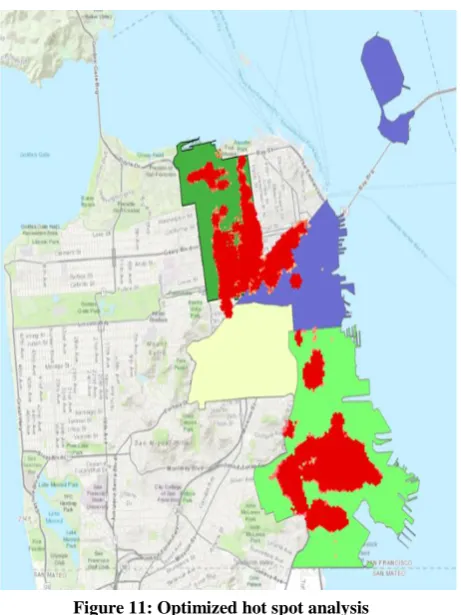
[image:5.595.55.282.516.696.2]Figure 11: Optimized hot spot analysis
The results suggest that, for the Bayview district, the center and some part of the northern region; for the Northern district,
southern and eastern areas; for the Southern district, north-western area were more accident-prone (hotspots). However, due to the limitation of the hot spot analysis and data being cluttered, no hot-spot was found for Mission district.
To investigate the reason for these regions being hotspots, more research was undertaken. Bundy (2011) emphasizes that the Bayview district is one of the most violent districts in San Francisco [13]. The author suggests that the level of violence has negatively affected the standard of living of residents of the district. Also, Vega (2008) argues that much of the violence in Bayview is often a result of gang activity as well as drug dealing [14]. According to The San Francisco Indicator Project, industrial areas of the city often have a smaller number of residents and as a result, often have higher crime rates relative to more populated areas [15]. Bayview is said to have industrial areas which could be a partial explanation to the hotspot analysis results. Furthermore, the southern district is stated to have a high crime rate when considering the relative number of residents.
5.3
Tracking Analyst
During tracking analysis of the five crimes between the year 2003 and 2015, it was found that there is a drastic increase in the number of crimes. Also, it was noticed that the crimes are getting more scattered in all the four police districts when all the 12 years were analyzed rather than being centered within some locations in each police district. An example of the increasing number of crimes is shown in Figure 12 which is a
Figures 12: 2007 and 2008 Crimes Tracking Analyst
visualization of all the crimes in 2007 and a visualization of all the crimes in 2008. The reason behind the increasing of crimes in 2008 may have been related to the 2008 recession as suggested by Colvin (2009) [12]
6.
CONCLUSION
The Golden Gate City, San Francisco, is one of the largest cities in the United States. It is common that large cities suffer from a high amount of crime and reports show that this observation applies to San Francisco as well. In this work, an investigation into crime in San Francisco was conducted using
a dataset of crimes reported between 2003 and 2015. Five major observations were made in the analysis
First, through the analysis of crimes per district, it was observed that the West Coast of San Francisco is much safer than the east coast. In fact, the Richmond district, which is on the West Coast, is four times safer than the Southern district, which is a region on the East Coast.
more crimes than all of the other regions due to having a large homeless camp in the area.
Third, through the analysis of crimes over time, it was noted that the economic performance could have a significant effect on crime rate as a spike was observed in 2008, which matches the famous 2008 recession. Moreover, it was observed that the crime rate spiked in May, presumably due to people leaving for the summer, and October, presumably due to Robberies happening before the Christmas holiday season. Also, it was observed that crimes occur more often over the weekend than during weekdays, which makes sense as most people spend their time away from home during the weekends.
Fourth, through Hotspot analysis, three major hotspot areas were located. The first is in the intersection area of the Northern district and Southern district. The other two areas are both in the Bayview district. Through investigating those hotspot areas, it was found that Bayview is one of the most dangerous areas in San Francisco due to high gang activity and drug business in the area, which explains why this district has two hotspot areas.
Fifth, the results of the hotspot analysis are visually inconsistent with the results of the tracking analysis. The Mission Police District was found to have no notable hotspots while the tracking analyst shows a considerable amount of crime in this district. This district also has the second highest number of crime occurrences according to the dataset. This is likely due to the integration of points and non-variance in the hotspot analysis. As per the literature, it is also possible that hotspots shift over time
7.
LIMITATIONS AND FUTURE WORK
The processing capability of the geographic analysis software used was not suitable for particularly large datasets. It would have been preferable for instances of murder to be included in the dataset as well. The dataset is comprised of crimes that occurred between the year 2003 and 2015. It would have been preferred to have more recent data. A large number of data points demanded that they need to be integrated for hotspot analysis. It is not clear which value for integration is the most appropriate. With an extended amount of time, this study could be replicated using different police districts. About hotspot analysis, more work is being done to study shifting hotspots.
8.
REFERENCES
[1] Neighborhood Scout. (2014). San Francisco, CA crime analytics. Retrieved March 15, 2018, from
https://www.neighborhoodscout.com/ca/san-francisco/crime
[2] Venturini, L., & Baralis, E. (2016). A spectral analysis of crimes in San Francisco. Urban GIS '16 Proceedings of the 2nd ACM SIGSPATIAL Workshop on Smart Cities and Urban Analytics. Retrieved from https://doi.org/10.1145/3007540.3007544
[3] Mcdowall, D., Loftin, C., & Pate, M. (2012). Seasonal cycles in crime, and their variability. Journal of Quantitative Criminology, 28(3), 389-410 Retrieved from https://doi.org/10.1007/s10940-011-9145-7
[4] Wu, X. (2016). An informative and predictive analysis of the San Francisco Police Department Crime Data. ProQuest Dissertations Publishing. Retrieved from ProQuest database.
[5] Herrmann, C. R. (2015). The dynamics of robbery and violence hot spots. Crime Science, 4(1), 1-14. https://doi.org/10.1186/s40163-015-0042-5
[6] Wheeler, A. P. (2016). Tables and graphs for monitoring temporal crime trends. International Journal of Police Science & Management, 18(3), 159-172. https://doi.org/10.1177/1461355716642781
[7] Weisburd, D., Bernasco, W., & Bruinsma, G. (2009). Putting crime in its place: Units of analysis in geographic
criminology. Retrieved from
http://www.springer.com/gp/book/9780387096872 [8] Bernasco, W., & Block, R. (2011). Robberies in Chicago:
A block-level analysis of the influence of crime generators, crime attractors, and offender anchor points. Journal of Research in Crime and Delinquency, 48(1),
33-57. Retrieved from
https://doi.org/10.1177/0022427810384135
[9] Bansal, M. (2013, June 6). Students Use Big Data to Pinpoint City Block Hit by Crime Every 3 Hours.
Retrieved from Forbes website:
https://www.forbes.com/sites/sap/2013/06/06/students- use-big-data-to-pinpoint-city-block-hit-by-crime-every-3-hours/
[10] Fagan, K. (2018, April 25). SF mayor vows that clearing homeless tents from the Mission just a start. Retrieved from San Francisco Chronicle website: https ://www.sfchronicle.com/bayarea article/ SF-mayor-vows-that-clearing- homeless -tents-from-12864999.php [11] Frieden, T. (2006, June 12). Violent crime takes first big
jump since '91. Retrieved from CCN.com website: http://www.cnn.com/2006/LAW/06/12/crime.rate/ [12] Colvin, R. (2009, January 27). U.S. recession fuels crime
rise, police chiefs say. Retrieved from Reuters website: https://www.reuters.com/article/us-usa-economy-crime/ u-s-recession-fuels-crime-rise-police-chiefs-say-idUSTRE50Q6FR20090127
[13] Bundy, T. (2011, August 6). A Neighborhood Is Shaken by a Violent Death. Retrieved from The New York
Times website:
https://www.nytimes.com/2011/08/07/us/07bcbayview.ht ml?pagewanted=all
[14] Vega, C. M. (2008, January 15). Guns, crack cocaine fuel homicides in S.F. - 98 killings in 2007. Retrieved from
San Francisco Gate website:
https://www.sfgate.com/bayarea/article/Guns-crack-cocaine-fuel-homicides-in-S-F-98-3232877.php [15] Department of Public Health, City and County of San
Francisco. (2014). The San Francisco Indicator Project. Retrieved from The San Francisco Indicator Project website: