RESEARCH ARTICLE
EFFECTIVE METHOD FOR LOAD RESTORATION
*Gnanambigai, S., Anisha, K. and Rathinakumar, M.
Department of Electronic and Electrical Engineering, SCSVMV University, Enathur
ARTICLE INFO ABSTRACT
In our country power demand is a major problem so we are going to introduce an algorithm based on genetic algorithm is proposed to solve service restoration problem in power distribution systems with priority customers. In genetic algorithm new solutions are found in every next generation with probability of getting the better solution till the optimal solution is not found. Service restoration problem is formulated as multi objective multi-constraint combinatorial optimization problem . The integer permutation scheme is used to generate the offspring in genetic algorithm. Integer permutation does not allow the hamming cliff problem. In case of partial restoration, including micro grid action that increases the power transfer capacity reduces out-of-service area. The operating time of manual and automatic controlled switches is significantly different. Therefore both type of switches are considered separately. The comprehensive simulation results of proposed method including three phase and load side fault are presented for 5 bus test systems.
Copyright, IJCR, 2013, Academic Journals. All rights reserved.
INTRODUCTION
Faulted events are unavoidable in the huge and complex electrical power distribution systems. These faults affect the system’s reliability and customer’s satisfaction. So the reduction in the effect of fault is necessary to maintain the system’s reliability and customer’s satisfaction by restoring the service quickly in the area left unsupplied due to fault. After occurrence of the fault, the operator finds the location of fault, isolate the fault and then restore the service to the healthy components of the out of service area. To meet the service restoration, the alteration of topological structure of distribution system is done by changing the status of switches in distribution system satisfying electrical and structural constraints. For the modern day distribution system, it is hard to implement service restoration solely depending on experimental rules by human operators. To reduce the out of service area as efficiently as possible and the burden of operators, a computer aided decision supports assist the operators. The researchers have developed many methods to solve the service restoration problem in distribution systems.
Heuristic techniques have been developed using heuristic rules. Because heuristic techniques rely on the knowledge of operator of distribution systems, a compromise between knowledge acquisition and performance of the solution is made. Expert systems have been developed to quickly determine restoration plans and build look-up tables for distribution personal. Fuzzy set theory, network reduction technique and the ranking based search method have also been developed. The petri-net approach has been developed. In the knowledge or the configuration of the concern system in the form of graphic representation is expressed through a structured model. In genetic algorithm is used to solve the service restoration problem. Before automation in distribution systems, only manual controlled switches were used in distribution system. After development of automatic controlled switches for the purpose of automation, these manual controlled switches started to be replaced by automatic controlled switches.
*Corresponding author: [email protected]
As a result, three categories of presently existing distribution systems can be seen. 1. Those have only manual controlled switches. 2. Those have both manual and automatic controlled switches. 3. Those have automatic controlled switches only. The operating time of both types of switches is different. Therefore, both type of switches should be considered separately. Sometimes service restoration for whole out of service area is not possible because power flow in the feeders goes beyond their power transfer capacity. Including the micro grids can increase the power transfer capacity of the feeder and, therefore, enhances the chances of full service restoration. If full service restoration is not possible with capacitor control action also, including capacitor control action is definitely helpful to reduce out of service area. The distribution systems are required to operate in radial fashion for proper relay coordination and ease of fault location etc. So the structure of distribution system should remain radial after service restoration also. In any distribution system, there are always some loads, which are of highest priority (e.g. hospital). In the event of partial service restoration, the supply must be restored to highest priority customers and this fact should be reflected in the final solution of service restoration problem. Here we are going to solve the load restorations problem using conventional genetic algorithm. During the optimization process of genetic algorithm, there is high probability of generation of better solution at every next generation. The string is represented by status of switches. In this work the original configuration is included in the initial population. Inclusion of original configuration in initial population reduces time to reach at optimal solution drastically. In this method, the following points are considered.
1. Manually controlled switch operation and remotely controlled switch operations are considered separately.
2. Priority customers are considered
3. Out-of - service, number of manual switch operation, number of remotely controlled switch operation and losses are minimized.
4. Voltage, current, reliality of the network and supply to priority customers are taken as the constraints.
ISSN: 0975-833X
International Journal of Current Research
Vol. 5, Issue, 04, pp.987-991, April,2013
INTERNATIONAL JOURNAL
OF CURRENT RESEARCH
Article History:
Received 16th January, 2012 Received in revised form 11th February, 2013 Accepted 29th March, 2013 Published online 13th April, 2013
Key words:
5. To restore the service to the out of service area, grid control switches are also considered along with tie switches and sectionalizing switches. In fact, this work is extension of method. In method, remotely switches and manual switches are not considered separately and priority customers are also not considered.
Problem formulation
Now we are solving the restoration as a objective, multi-constrained combinatorial optimization problem. The out-of-service area, number of manually controlled switch operation, number of remotely controlled switch operation and losses are taken as the objective functions. Minimization of the out of service area, the minimization of number of manually controlled switch operation, the minimization of number of remotely controlled switch operation, and the minimization of the losses are kept on first, second, third and fourth preference respectively.
The objective functions and constraints considered are described as follows:
Objective Functions:
1) Minimization of out-of-service area: Min F1( X)
b
F1( X) = TL- Σ Lj
j=1
Where, TL is total pre-fault load on the network. X is switch state vector of network under consideration for service restoration.
X= [SW1,SW2,……….SWNs]
SWj = status of jth switch. Close switch is represented. by 1 and open
switch is represented by 0.
NS = total number of switches in the network.
b = Number of energized buses after service restoration.
L j = load on jth energized bus after service restoration.
2) Minimization of number of manually controlled switch operation: Min 2 F(X)
Nm
F2(X) = Σ[SWAj – SWARj]
j=1
Nm is number of manually controlled switches.
SWM j = status of jth manual controlled switch in network just after
fault.
SWMR j = status of jth manual controlled switch in the restored
network.
The operating time of remotely controlled switch is negligible in comparison to manually controlled switch. If a solution A has number of manual switch operation lesser and number of remotely controlled switch higher in comparison to another solution B, solution A will take lesser time to operate the switch in comparison solution B because the operating time of remotely controlled switch is negligible in comparison to manually controlled switch. Therefore, the decision at first should be taken based on number of manually controlled switch. If number of manually controlled switch is same then decision should be taken based on remotely controlled switches. Therefore, minimization of number of manually controlled switch is kept on second preference and minimization of number of remotely controlled switch is kept on third preference. The remaining last objective function i.e losses is kept at fourth preference.
3) Minimization of number of remotely controlled switch:
Min F3 (Ẋ)
Na
F3(Ẋ) = Σ = [SWAj-SWARj]
Na is number of remotely controlled switches.
SWAj = status of jth remotely controlled switch in network just after
fault.
SWARj = status of jth remotely controlled switch in the restored
network.
4) Minimize the losses:
Min F4 (X)
F4 (X) = losses in the restored network which can be calculated with
help of load flow.
Constraints
1) Radial network structure should be maintained.
2) Bus voltage limit should not be violated. Vmin <Vj <V max
V min = minimum acceptable bus voltage.
Vj = voltage at j
th
bus. Vmax = maximum acceptable bus voltage.
3) Feeder line current should not be violated. I min <I j <I max
I min = minimum acceptable line current.
I j = current in jth line.
I max =maximum acceptable line current.
4) Higher priority customers should always be supplied. Fitness function: The fitness function FF is defined as
FF = c1 F1 + c2 F2 + c3 F3 + c4 F4 + c5 C1 + c6 C2 + c7 C3
Where, c1 ,c2 ,c3 ,c4 , c5 ,c6 and c7 are weighting factors.
C1 , C2 and C3 are voltage, current and priority customer constraints
violation respectively.
All terms in fitness function are to be minimized for a better solution. Therefore, lower value of fitness function is better value of fitness function and will give better solution.
Brief Description of Genetic Algorithm
Genetic Algorithms are general-purpose search techniques inspired by theory of evolution. GA has been proved a power full technique to
solve constrained multi-objective combinatorial optimization
problem. Generally, it works in three different stages: (1) Generation of initial solutions of a problem. The initial solutions are encoded. The encoded solution is called string and a set of strings is called population (2) Evolution of fitness function: In this stage, the fitness function of each string is calculated based on which the inferiority or superiority of a solution is decided. (3) Generation of new strings: New strings are generated with help of three type of GA operators. (a) Crossover: Crossover operator selects two strings within
population and a crossover site and then performs a swapping
operation of the string bits to the right hand side of the crossover site of both strings. (b) Mutation: It is used to explore some of the invested points in the search space by randomly flipping a bit in the population of strings. A very low probability is assigned to its activation. (c) Selection: It is used to make one or more copies of any string that posse a superior fitness function for mating pool. There is a high probability of the better solution(s) generated due to crossover and mutation operation.
Implementation of Genetic Algorithm in Load restoration problem
A. Representation of string
“OFF” is considered. The string for this configuration is shown below:
String=[1 0 1 0 0 1 1 1]
Indices of this string represent the switch number. For example fourth element of string is switch number 4 and this element is status of switch number 4 i.e. “0” means switch number 4 is“OFF”. Before GA is implemented in service restoration problem, the original distribution network is mapped to a graph. From this network mapping, we get - (a) downstream zones of each switch (b) load on each zone (c) switches around each zone (d) total zones. Zone is defined as the area surrounded by switches (close and open both).
B. Binary encoding scheme
Binary encoding scheme faces some difficulties. First, hamming cliffs difficulty associated with certain strings (like 11111110 and 00000001) from which a transition to a neighboring solution requires alteration of many bits. Second difficulty faced by it is the inability to achieve any arbitrary precision in the optimal solution. Third, to solve the real parameter optimization problem, conversion from real parameter to binary parameter is required and hence extra computational burden increases to get binary encoded strings. That is why the other encoding scheme is needed otherwise it is best encoding scheme. First two difficulties, in general, come only if the problem variables and solution space is continuous. In load restoration problem, objectives and parameters are integer, so first two difficulties are not faced. Hamming cliffs may be faced, if the original configuration (string) is like the form of shown above. Third difficulty does not arise, because variables themselves generate binary encoded string and hence there is no need of conversion from real parameter to binary parameters. Moreover, binary encoding scheme has powerful searching mechanism in solution space. In light of above discussion, binary encoding scheme is the best encoding scheme for restoration problem.
C. Generation of initial strings
The initial strings which make initial population, less by one than population size are generated randomly. It is simplest method and no knowledge about the network is required. Mostly, the solution of service restoration problem is found near the original configuration. So to keep a good string in population, one string made by original configuration is included with randomly generated strings. It gives good spread of solutions in initial string, besides a good string is included in population. Hence, chances of reaching on optimal solution in short time enhance. Even in worse case also i.e. optimal solution is very far from original configuration, inclusion of original configuration in initial string will give at least good spread of solutions called diversity and this worse case will be tackled by other randomly generated string as usual to reach at optimal point. Diversity helps to reach more close to global solution. So, this type of generation of initial strings is always beneficial. The faulted zone is isolated by making the element in all strings, corresponding to switches around the faulted zone,“0”.
D. Checking for radiality
To check the radiality of distribution system a breadth wise visit on zones through close switches, starting from root switch is made. During this process of visit, if two visits are reaching on the same switch, a loop is made. To maintain the radiality, this loop is broken by opening the switch on which two visits is reaching. During the visit of configuration the visited zones and switches are collected.
E. Fitness function evaluation
For fitness function evaluation of a string, existing zone and existing switches in the string under consideration, are found from visited zones and visited switches in the string. Then after, existing buses and existing lines are found with help of existing zones. With help of (1)
out-of-service area in terms of load is calculated. Using (2) a number of manually switch operations is calculated. Using (3) a number of remotely switch operations is calculated. To calculate losses, voltage violation and current violation, AC load flow after deleting non-existing lines & buses and adding non-existing lines & buses in input data, is run. After knowing the value of all above parameters, fitness function is calculated with help of (7).
F. String Operation
The integer permutation scheme is used to generate the offspring from the parents. Mutation is not applied. After generating the offspring, mating pool is got with help of ranking selection operator. During the generation of offspring, same string may be generated many times, but load flow is done only once when it is generated first time and stored for future. It saves a lot of computational burden because in last generations many same strings are generated even in same population.
G. Partial restoration
Partial restoration is done automatically by the algorithm itself if required.
H. GA algorithm for service restoration
Steps-1. Input line data, bus data, network mapping, original configuration and higher priority customers. 1. Enter faulted zone and tripped switch. 3. Find switches around faulted zone from network mapping. 4. Find “out of service area” from network mapping. “out of servicearea”=load at down stream side of tripped switch. 5. Find network configuration after fault by opening tripped switch in original configuration. 6. Generate the initial string called parents Po of size N as told above in “Generation of initial strings”. N is population size. 7. Open the switches around faulted zone and close root switch in case of open, in each string of Po, to keep the faulted zone isolated and to connect at least one zone with supply respectively.
8. Check the radiality of Po and modify the string to maintain radiality, if string(s) is not radial as told above in “Radiality checking”.
9. Evaluate the parents Po as told above in “String evaluation”. 10. Check for stopping criteria. If achieved take out the string having best objective function, as a restoration plan, Else go to step 12. 11. Perform selection, crossover on Po to generate new parents Po. Go to step 7 with new parents Po. Test System: The proposed methodology has been applied on three practical distribution systems and one real system of Chambal in India. All test systems are of different size.
Following are the parameters of the test systems
1. Switches - 10, buses - 13, nominal voltage -11 load -26.52. 2. switches -14, buses - 10, nominal voltage -13.8, load -2.2. 3. switches -37, buses -32, nominal voltage -12.66, load -5.6. 4. switches-75, buses-173, nominal voltage-33, load-169.327. The voltage is in KV and load is in MVA.
RESULTS AND DISCUSSION
The algorithm developed has been implemented on four
uncompensated distribution systems and one Compensated
by comparing objective functions kept at third preference i.e. number of remotely controlled switch operation. If the solutions have same number of remotely controlled switch operation also then the comparison is made by comparing the objective function kept at fourth preference i.e. losses. In any above comparison, if it is found that a solution has a smaller value of objective function than other then the solution is declared superior and there is no need to make further comparison to find the superiority of the solution. However due to the constraint of space, the results of only system-2 shown in figure 1 are described in detail in this paper. Pre-fault configuration is included in initial population in the proposed methods. A fault “A” shown in system-2 in figure 1 is assumed. The out-of-service area at downstream side of switch tripped due to this fault is shown in closed curve in Figure 1.
Table 1. Detail of different test systems
SL.
Description
No. of No. of
Systems No. of
nominal load
No. buses switches
voltage(KV) points
1 System-1 13 10 11 12
2 System-2 10 14 13.8 19
3 System-3 32 37 12.66 31
4 System-4 173 75 33 88
5 System-5 16 19 11 13
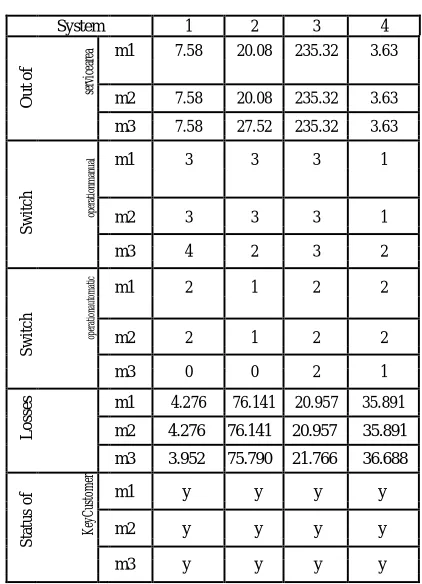
[image:4.595.321.540.77.649.2]NOTE: In tables II to V- a) in first row 1, 2, 3 and 4 represent system-1, system-2, system-3 and system-4 respectively, b) msystem-1, m2 and m3 represent proposed method, method and method respectively, c) y and n represent key customer is supplied and not supplied respectively. After the isolation of fault, the load points left unsupplied can be supplied with help the configuration A got after closing switches s14 or configuration B got after closing s12, as it is apparent from the Figure 1. The switch s12 is automatic controlled and its operating time is 50 seconds. The switch s14 is manual controlled and its operating time is in the range of 1200-1500 seconds depending on from the location of which switch the operator came to operate this switch. The network configuration after service restoration done by and is same shown in Figure 2 i.e. configuration B. The out-of-service (objective function kept at first preference) area Substation Figure 2. Network after service restoration energized by configuration A and B and is same but number of manual switch operation (objective function kept at second preference)
Table 2. Single fault full load restoration
System 1 2 3 4
o
f
se
rv
ic
e
m1 4.8 8.76 52.38 0.0
a
re
a m2 4.8 8.76 52.38 0.0
O
u
t
m3 4.8 8.76 52.38 2.875
S
w
it
c
h
o
p
er
at
io
n m1 2 1 1 0
m
a
n
u
a
l
m2 2 1 1 0
m3 3 2 2 2
S
w
it
c
h
o
p
er
at
io
n m1 2 1 1 2
a
u
to
m
a
ti
c
m2 2 1 1 2
m3 1 0 0 0
m1 11.56 39.987 21.55 37.680
L
o
ss
es
m2 11.56 39.987 21.55 37.680
m3 10.644 38.872 20.543 36.732
S
ta
tu
s
o
f
K
ey
C
us
to
m
er
m1 y y y y
m2 y y y y
[image:4.595.326.537.477.769.2]m3 y y y y
Table 3. Single fault partial load restoration
System 1 2 3 4
O
u
t
o
f
se
rv
ic
ea
re
a m1 7.58 20.08 235.32 3.63
m2 7.58 20.08 235.32 3.63
m3 7.58 27.52 235.32 3.63
S
w
it
c
h
op
er
at
io
nm
an
ua
l m1 3 3 3 1
m2 3 3 3 1
m3 4 2 3 2
S
w
it
c
h
op
er
at
io
na
ut
om
at
ic
m1 2 1 2 2
m2 2 1 2 2
m3 0 0 2 1
L
o
ss
e
s m1 4.276 76.141 20.957 35.891
m2 4.276 76.141 20.957 35.891
m3 3.952 75.790 21.766 36.688
S
ta
tu
s
o
f
K
ey
C
us
to
m
er
m1 y y y y
m2 y y y y
[image:4.595.40.273.480.586.2]Table 4. Multi-fault full service restoration
System 1 2 3 4
Number of faults 2 3 4 4
O
u
t
o
f
se
rv
ic
ea
re
a m1 7.82 220.74 328.87 8.02
m2 7.82 220.74 328.87 8.02
m3 7.82 293.19 328.87 8.02
S
w
it
c
h
op
er
at
io
nm
an
ua
l
m1 4 4 5 2
m2 4 4 5 2
m3 4 3 6 2
S
w
it
c
h
op
er
at
io
na
ut
om
at
ic
m1 0 1 3 2
m2 0 1 3 2
m3 0 1 2 2
L
o
ss
e
s
m1 7.050 37.652 16.759 33.162
m2 7.050 37.652 16.759 33.162
m3 7.050 28.768 16.112 32.754
S
ta
tu
s
o
f
K
ey
C
us
to
m
er
m1 y y y y
m2 y n n n
m3 y n n n
Table 5. Multi-fault partial service restoration
System 1 2 3 4
Number of faults 2 3 4 4
a
re
a
m1 11.05 241.72 751.22 11.32
o
f
m2 11.05 241.72 751.22 11.32
O
u
t
se
rv
ic
e
m3 11.05 360.36 956.25 13.55
S
w
it
c
h
o
p
er
at
io
n
m
a
n
u
a
l
m1 2 4 6 3
m2 2 4 6 3
m3 3 3 7 4
S
w
it
c
h
o
p
er
at
io
n
a
u
to
m
a
ti
c
m1 2 2 3 2
m2 2 2 3 2
m3 1 2 0 0
L
o
ss
e
s m1 3.241 42.860 9.166 31.276
m2 3.241 42.860 9.166 31.276
m3 2.926 31.383 6.253 28.428
S
ta
tu
s
o
f
C
u
st
o
m
er m1 y y y y
K
ey m2 y n n n
[image:5.595.324.542.80.181.2]m3 y n n n
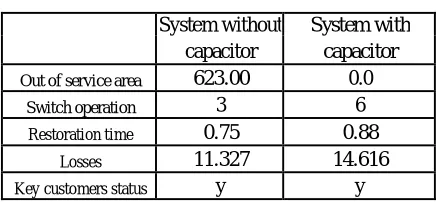
Table 6. Effect of capacitor switch action on service restoration (Single fault partial service restoration)
configuration A is higher than that in on figuration B by one. Although the losses (objective function kept at fourth reference) in the configuration A is lesser than in the configuration B but still configuration B is superior than A because configuration A has 1 higher manually controlled switch operation than configuration B. The solution given by proposed method is configuration A. Table II to V show that solution given by proposed method is superior than solution given by and from these tables it can be seen that the proposed method always takes care of priority customer and method and do not take care of priority customers. In addition, the result in tables shows that the proposed method uses the remotely controlled switch to restore the out of service area if possible. On the other hand, method and are not able to differentiate the remotely controlled switches and manually controlled switches. Table VI shows that in case of partial restoration, capacitor switch operation is helpful to reduce out of service area.
Conclusion
An algorithm based on conventional genetic algorithm, is. developed to solve the service restoration problem in distribution system. In the developed algorithm priority customers are considered due to which priority customers always remain energized. Manually controlled switch operation and remotely controlled switch are considered separately. Considering capacitor switch
REFERENCES
[1] K. Akoi, H. Kuwabara T. Satoh M. Kanezashi, “Outage state optimal load allocation by automatic sectionalizing switches operation in distribution systems,” IEEE trans. Power delivery. 1987,vol. 2, no.4, pp. 1177-1185
[2] K.Akoi, H. Kuwabara T. Satoh M. Kanezashi, “Voltage drop constrained restoration of supply by switch operation in distribution system,” IEEE trans. Power delivery. 1988 vol. 3, no. 3, pp. 1267-1279.
[3] K. Akoi, H. Kuwabara T. Satoh M. Kanezashi, “A new algorithm for service restoration in distribution systems,” IEEE trans. Power delivery. 1989 vol. 4, no. 3, pp.1832-1839. [4] C. C. liu S. J. Lee, S.S. Venkata “An expert system operational
aid for restoration and loss reduction of distribution systems,” IEEE trans. Power syst.1988 vol. 3, no. 2, pp. 619-626
[5] C. E. Lin et al., “A distribution system outage dispatch by data
base method with real time revision,” IEEE trans. Power Delivery, vol. 4. Jan. 1989.
[6] Imamura et al., “An application of fuzzy reasoning for service
restoration” (in Japanese) Trans. IEE Jpn., vol. 4, July 1989.
[7] H. Mori et al., Parallel simulated annealing for power system
decomposition,” IEEE trans. Power system vol. 4, May 1994. [8] Yogendra Kumar, Biswarup Dass, Jayadev Sharma,” Genetic
algorithm for supply restoration in distribution system with priority customers. June 2006.
System without
System with
capacitor
capacitor
Out of service area
623.00
0.0
Switch operation
3
6
Restoration time
0.75
0.88
Losses
11.327
14.616
Key customers status