Semi-Supervised Classification in Educational Data
Mining: Students’ Performance Case Study
Nur Uylaş Satı
Mugla Sitki Kocman University Bodrum Vocational School of Maritime, Turkey
ABSTRACT
Semi-supervised learning is one of the significant field in machine learning or data mining. It deals with datasets that have many unlabeled and a few labeled samples. In this study we aim to predict students’ success in educational institutes by use of semi-supervised classification methods in the well- known machine learning tool WEKA. The methods are explained in detail and for every method, implementations are done on a special dataset called “Students’ performance”. The effectiveness of the methods are tried to be increased by using attrbibute selection functions in data selection and transformation processes. The performance of the algorithms are stated by accuracy results presented in tables and figures.
General Terms
Machine Learning, Data Mining, Classification, Algorithms
Keywords
Semi-Supervised Learning, Educational Data Mining, Mathematical Programming, Collective Classfication
1.
INTRODUCTION
Machine learning is programming computers to optimize a performance criterion using example data or past experience and data mining is application of machine learning methods to large datasets [1].
In data mining applications the main aim is analyzing data from different perspectives and summarizing it into useful information that can be used to improve the process, to increase the revenue, to cut the costs, or etc. based on the defined problem. Main data mining tasks are Classification where the subject is classifying future data into known classes by mining patterns; Association rule mining where the aim is mining any rule of the form XY, where X and Y are sets of data items; Clustering where we identify a set of similarity groups in the data; Deviation detection where we discover the most significant changes in data; Data visualization that uses graphical methods to show patterns in data. A more detailed survey about data mining can be found in [2]. All the methods that is used for these tasks have three different types called supervised, semi- supervised and unsupervised based on the datasets that is used for training. Respectively in supervised data mining, dataset is composed of labeled data, in semi- supervised, it consists of both labeled and unlabeled data and in unsupervised data mining, the whole dataset is composed of
mining studies from 2010 to 2017. In this survey paper, the end objectives of EDM applications were emphasized and the applications in categories with similar purposes were grouped [4].
One of commonly objective in EDM is student modeling. In student modeling, prediction of performance and characteristic and prediction of undesirable behaviours are aimed. A detailed study that includes applications aiming all the objectives can be found in [4].
The most widely used methods for predicting student performance and characteristics is classification and regression. There can be found various classification techniques used in EDM. In [5] comparative analysis were made on classification algorithms on student’s dataset and J48 was found as the best algorithm in terms of accuracy values. In [6] C4.5 algorithm is found as the highly used method by researchers for prediction of student’s performance. Also in [7] found C4.5 gives higher accuracy and lowest absolute errors. In [8] the algorithms CHAID and CART were applied to get two decision trees classifying succesful and unsuccesful students. The obtained accuracy values were respectively 59.4 and 60.5. In [9] the best accuracy values of implementations on predicting students’ performance was found in Multi Layer Perceptron algorithm. In the implemantations stated in the literature mostly machine learning tool WEKA was used. The latest used classification algorithms in WEKA for EDM is mentioned by Rajeshinigo and Jebamalar in 2017 [10]. In all above given papers, supervised classification in EDM was discussed. Whereas most of the datasets obtained from educational institutes can have a few labeled and many unlabeled data. In these supervised techniques the whole unlabeled data are not used and turn to dust. In this study, to utilize these unlabeled data, Semi- supervised data classification, one of significant data mining technique, that uses datasets consists of both labeled and unlabeled data, will be examined for predicting the labels (classes) in other words to predict future performance of students.
Semi-supervised classifcation techniques can be thought as a combination of unsupervised and supervised techniques and it aims to utilize from both of them. Much used semi supervised learning methods have different types called as self-training, co-training, transductive support vector machines, and graph-based methods. Self training is a wrapper method around a supervised classifier. To apply self-training, for each instance x to be classified, besides its predicted class label, the classifier must be able to output a certainty score, i.e., an estimation of how likely the predicted class label is correct [11]. Transductive support vector machines (TSVMs) use each labeled and unlabeled data in training phase and it searches a reliable separating hyperplane. In co-training, proposed by Blum and Mitchell in 1998, two classifiers are trained. It uses the predicitons of each classifier on unlabeled examples to augment the training set of the other [12]. Graph based methods use nodes and edges to model the whole dataset as a graph. Nodes represents labeled and unlabeled datasets and edges defines the similarities between points. These methods fundamentally predicts a function on the graph such that it should be close to the given labels on the labeled examples, and also it should be smooth on the whole graph [13].
Semi-supervised learning is a type of machine-learning technique specially useful when a limited amount of labelled data exists for each class [14]. In particular, collective classification is an approach that uses the relational structure of the combined labelled and unlabelled data-sets to enhance the classification accuracy [15].
In this study we will use Semi-Supervised Learning and Collective Classification package in the well-known machine learning tool WEKA [16]. The used algorithms in WEKA package are explained in detail in below subsections.
2.1.1
LLGC
LLGC (Learning with local and global consistency), was presented in 2003 by Zhou and his friends [17]. It is a collective classifier that generates a smooth classifier function for labeled and unlabelled data.It pre-processes the data with the following filters:
- weka.filters.unsupervised.attribute.ReplaceMissingValues - weka.filters.unsupervised.attribute.NominalToBinary - if -N 0 then weka.filters.unsupervised.attribute.Normalize - if -N 1 then weka.filters.unsupervised.attribute.Standardize LLGC algorithm is accesible in fuctions folder in Semi-Supervised Learning and Collective Classification package in WEKA machine learning tool.
2.1.2
Collective IBk
It uses internally WEKA’s classic IBk algorithm to determine the optimal k for the adjacency on the training set. The experimenter chooses one of the search methods, naive list search or KDTree to find the adjacents. The whole adjacents in an adjacency are arrayed in terms of their distance to the test instance they refer to. The adjacencies are arrayed according to their ‘rank’ that means the different occurrences of the two classes in the adjacency. For each unlabelled test instance with the highest rank, the class label is identified by majority vote or by the first class. This is done until no further unlabelled test instances remain. The categorization ends by obtaining the class label of the instance that is about to be classified [18, 19]. Collective IBk algorithm states in lazy folder in Semi-Supervised Learning and Collective Classification package in WEKA machine learning tool.
2.1.3
Yatsi
“Yet another two stage idea” was defined in 2006 by Driessens and his friends [20]. It is a collective classifier that uses the given classifier to train on the training set and labeling the unlabeled data. The chose of classifier and nearest neighbour search algorithm is made by the experimenter. It is the commonly used collective classifier in meta folder of Semi-Supervised Learning and Collective Classification package in WEKA machine learning tool.
2.1.4
Collective Tree
Collective tree algorithm uses RandomTree classifier in WEKA, it divides the attribute such that it splits the current subset of all instances into two halves. The process ends if one of the conditions is met: Only training instances would be wrapped. Only test instances in the leaf would be wrapped. Only training instances of one class would be wrapped [19].
3.
DATASET PREPARATIONS
In this study we use “Students’ Perfomance Dataset” obtained from UCI Machine Learning Repository [21]. This dataset presents student success in secondary education of two Portuguese schools. The attributes of data identify student grades, demographic, social and school related features and it was gathered by using school reports and questionnaires. Two datasets are presented in terms of the success in two distinct subjects: Mathematics (mat) and Portuguese language (por). In our experiments we use the one related with Mathematics subject.
3.1
Data Selection and Transformation
Figure 1. Screen shot of attribute selection in Weka tool
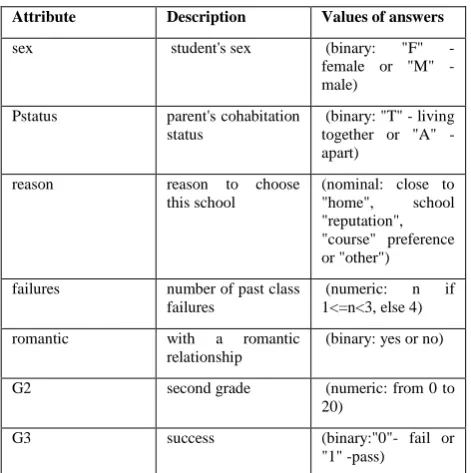
Table 1. Dataset attributes
Attribute Description Values of answers
sex student's sex (binary: "F" - female or "M" - male)
Pstatus parent's cohabitation status
(binary: "T" - living together or "A" - apart)
reason reason to choose
this school
(nominal: close to "home", school "reputation", "course" preference or "other")
failures number of past class failures
(numeric: n if 1<=n<3, else 4)
romantic with a romantic relationship
(binary: yes or no)
G2 second grade (numeric: from 0 to
20)
between them and also it uses BestFirst for the search method that searches the space of attribute subsets by greedy hillclimbing augmented with a backtracking facility. After this implementation, the most effective 6 features on the label G3 are taken as attributes and the labels are determined by the grades G3<60 as fail and G3>60 as pass. The obtained results after attribute selection implemantation are shown in Figure 1 and the used dataset attributes are given in Table 1.
In transformation process, G3 is identified as the label of the student and represented by “0” for the students that fail the math course by getting grades less than 60, and “1” for the students that pass the math course by getting greater than or equal to 60.
4.
RESULTS AND FINDINGS
In this section to validate the performance of the algorithms in Semi-Supervised Learning and Collective Classification package in WEKA that is presented in Section 2, numerical implemantations are performed on the presented UCI dataset in Section 3.
[image:3.595.48.284.469.706.2]tei= the number of testing instances
accuracy value= 100 cci
tei
[image:4.595.314.539.69.255.2]
Table 2. The accuracy results of implementations on the rearranged dataset after attribute selection
Percentage of Labeled instances
LLGC Collective Ibk
Yatsi Collective Tree
5% 81.33% 29.33% 83.21% 94.93%
10% 81.12% 41.40% 90.14% 84.78%
15% 80.95% 30.05% 90.17% 87.20%
20% 81.01% 33.22% 91.13% 90.82%
[image:4.595.49.288.147.256.2]Obtained results are given in above Table 2. The below Figure 2 line chart shows the graphical represantation of Table 2.
Figure 2. Graphical illustration of accuracy results on the rearranged dataset after attribute selection
Along these implementations, to see the efficieny of attribute selection, we applied the same algorithms on the original dataset with 32 attributes and one success label (G3). Obtained results are shown in Table 3 and Figure 3.
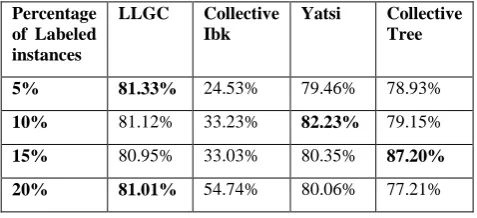
Table 3. The accuracy results of implementations on the original dataset
Percentage of Labeled instances
LLGC Collective Ibk
Yatsi Collective Tree
5% 81.33% 24.53% 79.46% 78.93%
10% 81.12% 33.23% 82.23% 79.15%
15% 80.95% 33.03% 80.35% 87.20%
[image:4.595.53.288.292.467.2]20% 81.01% 54.74% 80.06% 77.21%
Figure 3. Graphical illustration of accuracy results on the original dataset
In the above implementation results, it is seen that the worst accuracy results are obtained in Collective IBk both for the original dataset and the rearranged one with less numbers of attributes according to the attribute selection. The best accuracy results on the rearranged dataset is obtained by Collective Tree and YATSI algorithms while for the original dataset the besties are obtained by LLGC, Collective Tree and YATSI. In the Table 2 and 3 the best results are written in bold.
On the original dataset applications, the best result is taken when we identify the percent of “Random Split” as 5% in the evaluation process but for the rearranged dataset we obtained it on 15% percent. Therefore we cannot tell a fixed value for the percent or a specific algorithm to get the best result, it is up to the used dataset.
The following Table 4 shows the best accurcy results obtained for both of the original and rearranged datasets by determining the used algorithm.When we comment on the results, we can say that attribute selection is effective on getting better results. Such that the best accuracy results of algorithms are obtained in the implementations on the rearranged dataset.
Table 4. The best accuracy results of implementations on the original and rearranged datasets
Percentage of Labeled Instances
Original dataset Rearranged dataset
Algorithm Accuracy Algorithm Accuracy
5% LLGC 81,33% Collective
Tree
94,93%
10% YATSI 82,23% YATSI 90,14%
15% Collective
Tree
87,20% YATSI 90,17%
20% Collective
IBK
81,01% YATSI 91,13%
5.
CONCLUSIONS
In this paper, we aim to use semi-supervised classification techniques in WEKA for educational data mining. Supervised classification is commonly used in educational data mining but in the literature there are not sufficient semi-supervised 0
10 20 30 40 50 60 70 80 90 100
5% 10% 15% 20%
LLGC
Collecti ve IBk
Yatsi
Collecti ve Tree
0 10 20 30 40 50 60 70 80 90 100
5% 10% 15% 20%
LLGC
Collecti ve Ibk
Yatsi
[image:4.595.309.550.561.696.2] [image:4.595.48.287.573.682.2]classification researches for the datasets obtained from educational institutes. Whereas, most of the educational datasets consists of many unlabeled instances and they need a prestudy before application of supervised classification techniques.
In Section 2, the commonly used semi-supervised classification techniques in WEKA tool is explained in detail. In Section 3, the used dataset for implementations is proposed with the whole descriptions of attributes and the work in data selection and tranformation process. In Section 4, the results obtained after implementations are presented both using tables and figures. Also interpretations on the results are made. Attribute selection process is so effective on getting high accuracy results. According to the obtained results Collective Tree and YATSI algorithms are seen as the most effective algorithms in Semi-Supervised Learning and Collective Classification package in the well-known machine learning tool WEKA.
As a future work these algorithms can be applied on other educational datasets and also different attribute selection functions can be experienced. Different techniques for semi-supervised classification in EDM can be defined to make better predictions.
6.
REFERENCES
[1] Alpaydın, E. 2004. Introduction to machine learning. Second Edition. The MIT Press. Cambridge. Massachusetts. London. England.
[2] Han, J., Pei, J., Kamber, M. 2011. Data Mining: Concepts and Techniques. 3rd Edition. The Morgan Kaufmann Series in Data Management Systems Morgan Kaufmann Publishers.
[3] Anuradha, C., Velmurugan, T., and Anandavally, R. 2015. Clustering Algorithms in Educational Data Mining: A Review. International Journal of Power Control and Computation. Vol.7. No. 1. Pp. 47-52. [4] Bakshinategh, B., Zaiane, O. R., ElAtia, S. and Ipperciel,
D. 2017. Educational Data Mining Applications and Tasks: A survey of the last 10 years. Education and Information Technologies, Springer Science Business Media, New York.
[5] Sumitha, R. and Vinothkumar. 2016. Prediction of Students Outcome Using Data Mining Techniques. International Journal of Scientific Engineering and Applied Science. Vol. 2. Issue. 6.
[6] Shariri, A. M., and Husain, W. 2015. A review on Predicting Student’s Performance Using Data Mining Techniques. Elsevier. Volume 72. Pp. 414-422.
[7] Hamid, A. and Amin. 2014. A Comparative Analysis of Classification Algorithms for Students College Enrollment Approvel Using Data Mining. Workshop on Interaction Design in educational Environments, ISBN:978-1-4503-3034-3.
[8] Kovacic, Z. J. 2010. Early Prediction of Students Success: Mining Student Enrollment Data. Proceedings of Informing Science & IT Education Conference. [9] Ramesh, V. 2013. Predicting Student Perfomance: A
Statistical and Data Mining Approach. International Journal of Computer Applications. Vol 63. No. 8. [10] Rajeshinigo, D. and Jebalamar, A. J. 2017. Educational
Mining: A Comparative Study of Classification Algoirthms Using WEKA. International Journal of Innovative Research In Computer and Communication Engineering. Vol 5. Issue 3. Pp. 5583-5589.
[11] Zhu, X. 2007. Semi- Supervised Learning Literature Survey. Computer Sciences TR 1530 University of Wisconsin – Madison, Last modified on December 14. [12] Zhou, Z. and Li, M. 2007. Semisupervised Regression
with Cotraining-Style Algorithms. Journal IEEE Transactions on Knowledge and Data Engineering archive. Volume 19 Issue 11, November, Pp 1479-1493. [13] Zha, Z. J., Mei, T., Wang, J., Wang, Z. and Hua, X. S.
2009. Graph-based semi-supervised learning with multiple labels. J. Vis. Commun. Image R. 20, Pp. 97– 103.
[14] Chapelle, O., Schölkopf, B. and Zien, A. 2006. Semi-supervised learning. MIT Press.
[15] Neville, J. and Jensen, D. 2003. Collective classification with relational dependency networks. In Proceedings of the Workshop on Multi-Relational Data Mining (MRDM).
[16] Garner, S. R. 1995. Weka: The waikato environment for knowledge analysis. In Proc New Zealand Computer Science Research Students Conference, pages 57-64, University of Waikato, Hamilton, New Zealand.
[17] Zhou, D., Bousquet, O., Lal, N. T., Westor, J. and Schölkopf, B. 2003. Learning with local and global consistency, Max Planck Institute for Biological Cybernetics, technical Report No:TR-112, June.
[18] Aha, D., Kibler, D. and Albert, M. K. 1991. Instance-based learning algorithms. Machine Learning. 6:37-66. [19] Laorden, C., Sanz, B., Santos, I., Galan-Garcia, P. and
Bringas, P. G. 2013. Collective classification for spam filtering. Logic Journal of the IGPL 21 (4), 540-548. [20] Driessens, K., Reuteman, P., Pfahringer, B. and Leschi,
C. 2006. Using Weighted Nearest Neighbor to Benefit from Unlabeled Data. In: Proc. 10th Pacific-Asia Conference on Knowledge Discovery and Data Mining, pp. 60–69.