Performance Upgradation through Task Allocation of
Distributed Networks
Kapil Govil
School of Engineering & Technology, ITM University Gwalior
ABSTRACT
Normally the distributed network has to execute the tasks that shall be the more than the number of processors. The assignment problem is a case of linear programming helps to solve the problems related to tasks and processors. The problem of execution of “m” tasks to “n” processors (m > n) in a distributed networks is addressed here through a new modified tasks allocation policy for distributed networks. The model, presented in this paper allocates the tasks or modules to the processor to increase the performance and to reduce the execution time. This paper reduces the problem of allocation of tasks where number of processors is less than the number of tasks. The example mentioned in the paper has three tasks and solved it in such a way that the task t1 processed with minimum time, the task t2 with minimum cost while the task t3 with maximum reliability. In this problem, the tasks are fused (or clubbed) with another task(s) on the basis of minimum communication cost to form a balanced allocation.
Keywords
Allocation, Cost, Distributed Network, Performance, Processor, Reliability, Task, Time.
1.
INTRODUCTION
Such type of research problems in which the performance of the distributed systems is to be upgraded, requires either processing time or cost to be minimized or reliability to be maximized by deciding the strategy of allocation of tasks to the processors of the distributed systems. These problems may be categorized as static (15, 16, 17, 19, 29) and dynamic (2, 14, 18, 19, 26, 27) in nature. Some of the other related methods have been reported in the literature, such as, Integer programming (7, 23), Branch and Bound technique (28), Matrix Reduction technique (11, 30, 31), Reliability Optimization (1, 12, 20, 21, 24), Load Balancing (2, 9, 10) and Modeling (3, 6, 8). The series parallel redundancy-allocation problem has been studied with different approaches, such as, Dynamic programming (4, 10, 13), Integer programming (7, 23), and Heuristic techniques (5, 22, 25).
2.
OBJECTIVE
The objective of the present research paper is to enhance the performance of the distributed systems by using the proper utilization of its processors. A set of tasks have to be processed by the processors of the network, while each of the task have the modules and the number of modules are more than the number of processors of the network. The processing of a task is means that all of its modules get processed. Performance is the measure in term of either time or cost or reliability of the modules of a task that have to process on the processors of the system and these have to be optimally processed i.e., either time or cost to be minimized or reliability to be maximized.
3.
TECHNIQUE
To evaluate the optimal time or cost or reliability for each task through optimal allocation, initially it has to concentrate on those (m-n) modules that have the highest probability of data transfer with the remaining n modules. Each of these (m-n) modules (say mik) of every task is treated as a candidate to be fused with any one (say mil) out of the remaining n modules with which it has the highest communication. Further, all the elements of kth row and lth row are to be added in case of time and cost while in case of reliability these rows have to multiply. This will reduces the effectiveness matrix for each task in to a square matrix. Now the problem remains to determine the optimal time or cost or reliability through the allocation strategy by considering either task processing based on time or cost or reliability for all modules to individual processor(s) for each task. For allocation purpose a modified version of row and column assignment method proposed by Kumar et al (17) is employed which allocates all the modules of a task to a processor optimally. The functions for obtaining the overall assignment execution time [Etime], execution cost [Ecost], and execution reliability [Ereliability] are as follows:
ij ij
n
j n
i
x
PT
Ptime
1 1
(1)
ij ij n j n i
x
EC
Pcost
1 1
(2)
ij ij n j n i
x
ER
elibility
1 1
Pr
(3)
Where, xij=
otherwise
,
0
processor
to
if
,
1
i
thtask
is
assigned
j
th
4.
ALGORITHM
Step 1: Start algo
Step 2: Read the number of tasks in m Step 3: Read the number of processors in n Step 4: For I = 1 to n
Step 5: For J = 1 to m
Step 6: Read the value in PTM [I][J]
Step 7: Increase the value of J by 1 Step 8: End of J loop
Step 9: Increase the value of I by 1 Step 10: End of I loop
Step 11: For I = 1 to n
Step 13: Read the value in CM [I][J] Step 14: Increase the value of J by 1 Step 15: End of J loop
Step 16: Increase the value of I by 1 Step 17: End of I loop
Step 18: For I = 1 to n
Step 19: For J = I to n
Step 20: If CM[I][J] == 1 then
Step 21: Store the value of P1[I] to 1
Step 22: Store the value of P2[J] to 1
Step 23: Calculate MAT [I][J] = PT/C/RM[P1[I]] + PT/C/RM [P2[J]] Step 24: End of if statement
Step 25: Increment the value of J by 1 Step 26: End of J loop
Step 27: Increase the value of I by 1 Step 28: End of I loop
Step 29: For I = 1 to n
Step 30: If P1[I] ==0 then
Step 31: Store the value of T1[I] by P1[I] Step 32: End of if statement
Step 33: Increase the value of I by 1 Step 34: End of I loop
Step 35: For I = 1 to n
Step 36: If T1[I] !=0 then
Step 37: Calculate MAT [T1[I]] = PT/C/RM [T1[I]] + PT/C/RM[T1[I+1]]
Step 38: End of if statement Step 39: Increment the value I by 1 Step 40: End of I loop
Step 41: Count the zero(s) in each row
Step 42: Mark the row(s), which have single zero Step 43: Mark the column, which have single zero
Step 44: Go to the row(s), which have more than one zero. Now select any one zero and
cross the leading zero(s), which are in same row and column
Step 45: Mark the assignments Step 46: Count the total assignment
Step 47: If total number of assignment < order of matrix Step 48: Go to Step 52
Step 49: Else
Step 50: Go to Step 59 Step 51: End of if statement
Step 52: Mark the rows for which assignment have not been made
Step 53: Mark column that have zeros in marked rows Step 54: Mark rows that have assignment in marked column
Step 55: Repeat Step 53 & Step 54 until chain of marking ends
Step 56: Draw the minimum number of lines through unmarked rows and marked columns to cover all zeros
Step 57: Select the smallest element of the uncovered elements and replace it by zero. Also add this element to positions at which lines intersect to each other only Step 58: Go to Step 42
Step 59: State processing time Step 60: End algo
5.
IMPLEMENTATION
Consider an example consisting of a set T = {t1, t2, t3} of 3
tasks each of them having sets M1= {m11, m12, m13 m14, m15}
of 5 modules, M2= {m21, m22, m23 m24} of 4 modules and M3=
{m31, m32, m33 m34, m35, m36} of 6 modules respectively. The
three processors are available in the distributed network to process the tasks that are represented by the set P = {p1, p2,
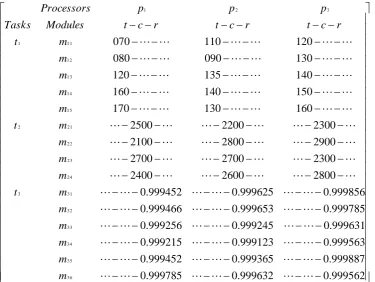
p3}. The processing time (t), cost (c) and reliability (r) of each
999562
.
0
2200
100
999632
.
0
2000
080
999785
.
0
2700
130
999887
.
0
2100
110
999365
.
0
2000
070
999452
.
0
1800
120
999563
.
0
2300
120
999123
.
0
3600
120
999215
.
0
1200
070
999631
.
0
2200
150
999245
.
0
2800
150
999256
.
0
2400
080
999785
.
0
2200
080
999653
.
0
3000
140
999466
.
0
2900
110
999856
.
0
1800
090
999625
.
0
1600
130
999452
.
0
2100
110
999874
.
0
2800
190
999632
.
0
2600
100
999532
.
0
2400
110
999652
.
0
2300
120
999632
.
0
2700
200
999523
.
0
2700
180
999412
.
0
2900
140
999652
.
0
2500
150
999856
.
0
2100
160
999785
.
0
2300
150
999632
.
0
2200
140
999652
.
0
2500
170
999631
.
0
2200
110
999235
.
0
2300
070
999863
.
0
2400
120
999687
.
0
2700
120
999520
.
0
3000
120
999632
.
0
2000
070
999631
.
0
2100
150
999541
.
0
2800
150
999235
.
0
2800
080
999120
.
0
2800
080
999632
.
0
2700
140
999632
.
0
2100
110
999635
.
0
2500
090
999420
.
0
2400
130
999856
.
0
2300
110
3 6 3 5 3 4 3 3 3 2 3 1 3 2 4 2 3 2 2 2 1 2 1 5 1 4 1 3 1 2 1 1 1 3 2 1m
m
m
m
m
m
t
m
m
m
m
t
m
m
m
m
m
t
r
c
t
r
c
t
r
c
t
Modules
Tasks
p
p
p
Processors
The communication period amongst the modules of each task has also been considered and it is mentioned in the following matrices, namely, CM ( , ):
For task t1, the matrix CM (1, ) is as:
0
2
0
5
4
0
8
7
2
0
3
9
6
1
0
1 5 1 4 1 3 1 2 1 1 1 5 1 4 1 3 1 2 1 1m
m
m
m
m
m
m
m
m
m
;For task t2, the matrix CM (2, ) is as:
0
6
0
8
7
0
5
4
2
0
2 4 2 3 2 2 2 1 2 4 2 3 2 2 2 1m
m
m
m
m
m
m
m
;For task t3, the matrix CM (3, ) is as:
0
1
0
3
2
0
4
5
1
0
5
6
8
4
0
6
9
7
3
2
0
3 6 3 5 3 4 3 3 3 2 3 1 3 6 3 5 3 4 3 3 3 2 3 1m
m
m
m
m
m
m
m
m
m
m
m
999562
.
0
999632
.
0
999785
.
0
999887
.
0
999365
.
0
999452
.
0
999563
.
0
999123
.
0
999215
.
0
999631
.
0
999245
.
0
999256
.
0
999785
.
0
999653
.
0
999466
.
0
999856
.
0
999625
.
0
999452
.
0
2800
2600
2400
2300
2700
2700
2900
2800
2100
2300
2200
2500
160
130
170
150
140
160
140
135
120
130
090
080
120
110
070
3 6 3 5 3 4 3 3 3 2 3 1 3 2 4 2 3 2 2 2 1 2 1 5 1 4 1 3 1 2 1 1 1 3 2 1
m
m
m
m
m
m
t
m
m
m
m
t
m
m
m
m
m
t
r
c
t
r
c
t
r
c
t
Modules
Tasks
p
p
p
Processors
The task t1 has five modules, so that on the basis of highest communication, the modules m11 & m14 and m12 & m15 are fused together to reduce the effectiveness matrix square. The task t2 has four modules, so that on the basis of highest communication, the modules m21 & m24 are fused together to
reduce the effectiveness matrix square. The task t3 has six modules, so that on the basis of highest communication, the modules m31 & m35, m32 & m32 and m34 & m36 are fused together to reduce the effectiveness matrix square. The resulting matrix is as:
999193 . 0 998877 . 0 999041 . 0 999348 . 0 998776 . 0 998681 . 0 999743 . 0 998990 . 0 998904 . 0 2300 2700 2700 5700 5400 4500 2300 2200 2500 140 135 120 290 220 250 270 250 230 3 6 * 3 3 3 4 * 3 2 3 5 * 3 1 3 2 3 2 4 * 2 2 2 1 2 1 3 1 5 * 1 2 1 4 * 1 1 1 3 2 1 m m m m m m t m m m m t m m m m m t r c t r c t r c t Modules Tasks p p p Processors
[image:4.595.112.488.78.360.2]The results of the allocations based on time for the task t1 are obtained after implementing the row & column assignment process as suggested by Kumar et al (17), are mentioned below in the Table 1;
Table 1. Time based Allocation for task t1
140 590 220 * 230 * 3 13 2 15 12 1 14 11 p m p m m p m m Etime Time Processors Modules
The results of the allocations based on cost for the task t2 are obtained after implementing the row & column assignment process as suggested by Kumar et al (17), are mentioned below in the Table 2;
Table 2. Cost based Allocation for task t2
[image:4.595.141.453.436.618.2]The results of the allocations based on reliability for the task
t3 are obtained after implementing the row & column assignment process as suggested by Kumar et al (17), are mentioned below in the Table 3;
Table 3. Reliability based Allocation for task t3
999193 . 0 *
9966876 .
0 998776
. 0 *
998904 . 0 *
3 3 6
3 3
2 3 4
3 2
1 3 5
3 1
p m
m
p m
m
p m
m
ility Ereliab y
Reliabilit s
Processor Modules
Thus the complete results for the above mentioned example obtained and are mentioned in the Table 4.
Table 4. Optimal Allocation Table
9966876 . 0 *
* *
9000 *
590 *
*
3 6 3 3 3 4 3 2 3 5 3 1 3
2 3 2 1
2 4 2 2 2
1 3 1 5 1 2 1 4 1 1 1
3 2
1
m m m m m m t
m m
m m t
m m m m m t
ty Ereliabili Ecost
Etime p
p p
Tasks
Optimal Optimal
Optimal Processors
6.
CONCLUSION
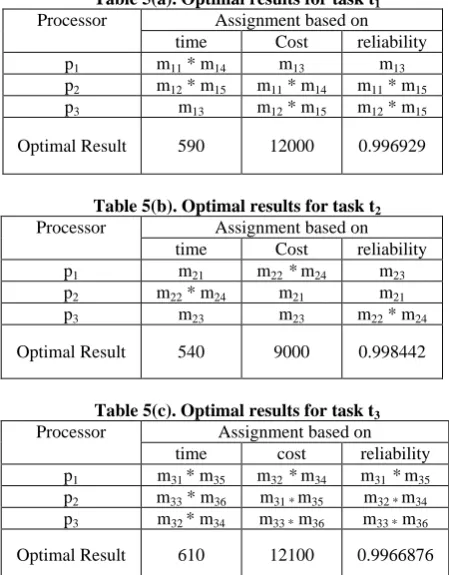
This paper chooses the problem, in which the numbers of module of the tasks are more than the number of processors of the distributed system. The model addressed in this paper is based on the consideration of processing time, cost and reliability of the module of the tasks to the various processors. The communication period amongst the module of the tasks is also used. The method is presented in algorithmic form and implemented on the several sets of input data to test the performance and effectiveness of the algorithm. As it is the common requirement for any assignment that the tasks have to be processed either with minimum time or minimum cost or maximum reliability. The example mentioned in this paper has three tasks and solved it in such a way that the task t1 processed with minimum time, the task t2 with minimum cost while the task t3 with maximum reliability. The optimal results are mentioned in Table 4 of the previous section. The Table 5(a), 5(b) and 5(c) shows the optimal results as obtain after implementing the present algorithm for all three options viz. time, cost, and reliability for each and every task.
Table 5(a). Optimal results for task t1 Processor Assignment based on
time Cost reliability p1 m11 * m14 m13 m13
p2 m12 * m15 m11 * m14 m11 * m15
p3 m13 m12 * m15 m12 * m15
Optimal Result 590 12000 0.996929
Table 5(b). Optimal results for task t2 Processor Assignment based on
time Cost reliability p1 m21 m22 *m24 m23
p2 m22 * m24 m21 m21
p3 m23 m23 m22 * m24
Optimal Result 540 9000 0.998442
Table 5(c). Optimal results for task t3 Processor Assignment based on
time cost reliability p1 m31 * m35 m32 *m34 m31 *m35
p2 m33 * m36 m31 * m35 m32 * m34
p3 m32 * m34 m33 * m36 m33 * m36
Optimal Result 610 12100 0.9966876
7.
TIME COMPLEXITY
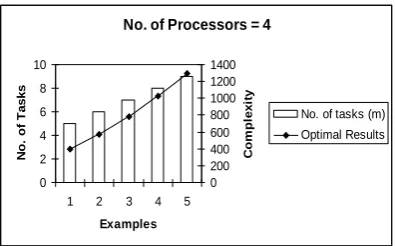
[image:5.595.264.541.60.763.2]It is known that the analysis of an algorithm is mainly focuses on time complexity. Time complexity is a function of input size „n‟. It is referred to as the amount of time required by an algorithm to run to completion. The time complexity of the above mentioned algorithm is O (m2n2). By taking several input examples, the above algorithm returns results as mentioned in Table 6.
Table 6. Time Complexity No. of
processors (n)
No. of tasks (m)
Optimal Results
3 4 144
3 5 225
3 6 324
3 7 441
3 8 576
4 5 400
4 6 576
4 7 784
4 8 1024
4 9 1296
5 6 900
5 7 1225
5 8 1600
5 9 2025
5 10 2500
The graphical representations of the results are shown by Fig 1, 2 and 3.
Fig 1: Graphical representation of results where n=3 No. of Processors = 3
0 2 4 6 8 10
1 2 3 4 5 Examples
N
o
.
o
f
T
a
s
k
s
0 200 400 600 800
C
o
m
p
le
x
it
y
[image:5.595.343.515.337.564.2] [image:5.595.48.273.467.755.2] [image:5.595.322.535.591.716.2]Fig 2: Graphical representation of results where n=4
Fig 3: Graphical representation of results where n=5
8.
COMPLEXITY COMPARISION
[image:6.595.322.535.89.329.2]The performance of the algorithm is compared with the algorithm suggested by Richard et al (28). Following Table 7 shows the time complexity comparison between algorithm (28) with present algorithm.
Table 7. Complexity Comparison Processors
n
Tasks m
Time Complexity
of algorithm (28) O(nm)
Time Complexity
of present algorithm O(m2n2)
3 4 81 144
3 5 243 225
3 6 729 324
3 7 2187 441
3 8 6561 576
4 5 1024 400
4 6 4096 576
4 7 16384 784
4 8 65536 1024
4 9 262144 1296
5 6 15625 900
5 7 78125 1225
5 8 390625 1600
5 9 1953125 2025
5 10 9765625 2500
[image:6.595.66.266.228.334.2]From the Table 7 it is clear that present algorithm is much better for optimal allocation of tasks that upgrade the performance of distributed system. The graphical representation of the data as mentioned in Table 7 is shown through Fig 4, 5 and 6.
Fig 4: Graphical representation of data where n=3
Fig 5: Graphical representation of data where n=4
Fig 6: Graphical representation of data where n=5
9.
REFERENCES
[1] Anapathur, Ramesh, V., Twigg, David W., Sandadi, Upender R. and Sharma, Tilak C. 2002. Reliability Analysis of System with Operation Time Management, IEEE Transactions on Reliability, 51, 39-48.
[2] Bahi, Jacques, Couturier, Raphaël and Vernier, Flavien. 2005. Synchronous distributed load balancing on dynamic networks, Elsevier Inc., 65(11), 1397-1405.
[3] Bierbaum, Rene L., Brown, Thomas D. and Kerschen, Thomas J. 2002, Model-Based Reliability Analysis, IEEE Transactions on Reliability, 51, 133-140.
[4] Chiu, Steve C., Liao, Wei-keng, Choudhary, Alok N. and Kandemir, Mahmut T. 2005. Processor-embedded distributed smart disks for I/O-intensive workloads: architectures, performance models and evaluation. Elsevier Inc., 65(4), 532-55.
[5] Coit, D.W. and Smith, A.E. 1996. Reliability Optimization of Series Parallel Systems using a Genetic
No. of Processors = 4
0 2 4 6 8 10
1 2 3 4 5
Examples
N
o
.
o
f
T
a
s
k
s
0 200 400 600 800 1000 1200 1400
C
o
m
p
le
x
it
y
No. of tasks (m) Optimal Results
No. of Processors = 5
0 2 4 6 8 10 12
1 2 3 4 5 Examples
N
o
.
o
f
T
a
s
k
s
0 500 1000 1500 2000 2500 3000
C
o
m
p
le
x
it
y
No. of tasks (m) Optimal Results
No. of Processors = 3
1 10 100 1000 10000
1 2 3 4 5
Examples
C
o
m
p
le
x
it
y
Algorithm (28)
Present algorithm
No. of Processors = 4
1 10 100 1000 10000 100000 1000000
1 2 3 4 5
Examples
C
o
m
p
le
x
it
y
Algorithm (28)
Present algorithm
No. of Processors = 5
1 100 10000 1000000 100000000
1 2 3 4 5
Examples
C
o
m
p
le
x
it
y
Algorithm (28)
[image:6.595.58.277.422.652.2]Algorithm, IEEE Transactions on Reliability, 45, 254-260.
[6] Contreras, Javier, Losi, Arturo, Russo, Mario and Wu, Felix F. 2000. DistOpt: A Software Framework for Modeling and Evaluating Optimization Problem Solutions in Distributed Environments”, Elsevier Inc., 60(6), 741 – 763.
[7] Ensink, Brian, Stanley, Joel and Adve, Vikram. 2003. Program Control Language: a programming language for adaptive distributed applications, Elsevier Inc., Vol. 63(12) 1082 –1104.
[8] Fitzgerald, Kent, Latifi, Shahram and Srimani, Pradip K. 2002. Reliability Modeling and Assessment of the Star-Graph Networks, IEEE Transactions on Reliability, 51, 49-57.
[9] Grosu, Daniel and Chronopoulos, Anthony T. 2005. Noncooperative load balancing in distributed systems. Elsevier Inc., 65(9), 1022-1034.
[10] Iqbal, Saeed and Carey, Graham F. 2005. Performance analysis of dynamic load balancing algorithms with variable number of processors. Elsevier Inc., 65(8), 934-948.
[11] Jan, Gene Eu and Lin, Ming-Bo. 2005. Concentration, load balancing, partial permutation routing, and superconcentration on cube-connected cycles parallel computers. Elsevier Inc., 65(12),1471-1482.
[12] Kandemir M., Ramanujam J. and Choudhary A. 2000. Compiler Algorithms for Optimizing Locality and Parallelism on Shared and Distributed-Memory Machines, Elsevier Inc., 60(8), 924 – 965.
[13] Kuang, Hairong, Bic, Lubomir F. and Dillencourt, Michael B. 2005. PODC: Paradigm-oriented distributed computing. Elsevier Inc., 65(4), 506-518.
[14] Kumar, Avanish. 1999. Optimizing for the Dynamic Task Allocation, in proceedings of the „III Conference of the International Academy of Physical Sciences, 1999 Allahabad, 281-294.
[15] Kumar, Avanish. 2001. An Algorithm for Optimal Index to Tasks Allocation Based on Reliability and cost, in proceedings of „International Conference on Mathematical Modeling‟ 2001Roorkee, 150-155.
[16] Kumar, V. Singh, M. P. and Yadav, P.K. 1995. An Efficient Algorithm for Allocating Tasks to Processors in a Distributed System, in proceedings of the „19th National system conference, SSI‟, 1995 Coimbatore, 82-87.
[17] Kumar, V. Singh, M.P. and Yadav, P.K. 1995. A Fast Algorithm for Allocating Tasks in Distributed Processing System, in proceedings of the „30th Annual Convention of CSI‟, 1995 Hyderabad, 347-358.
[18] Kumar, V. Singh, M.P. and Yadav, P.K. 1996. An Efficient Algorithm for Multi-processor Scheduling with Dynamic Reassignment, in proceedings of the „6th
National seminar on theoretical Computer Science‟, 1996 Banasthally Vidyapeeth, 105-118.
[19] Kwok,Yu-Kwong, Maciejewski, Anthony A., Siegel,Howard Jay, Ahmad, Ishfaq and Ghafoor, Arif. 2006. A semi-static approach to mapping dynamic iterative tasks onto heterogeneous computing systems, Elsevier Inc., 66(1), 77-98.
[20] Lin, Min-Sheng 2002. A Linear-time Algorithm for Computing K-terminal Reliability on Proper Interval Graphs, IEEE Transactions on Reliability, 51, 58-62.
[21] Lyu, Michael R., Rangarajan, Sampath and Moorsel, Aad P. A. Van. 2002. Optimal Allocation of test Resources for Software Reliability growth modeling in Software Development, IEEE Transactions on Reliability, 51, 183-192.
[22] Mitchell D. Theys, Howard Jay Siegel and Edwin K. P. Chong. 2001. Heuristics for Scheduling Data Requests Using Collective Communications in a Distributed Communication Network Elsevier Inc., 61(9), 1337 – 1366.
[23] Muhammad K. Dhodhi, Imtiaz Ahmad, Anwar Yatama and Ishfaq Ahmad 2002. An Integrated Technique for Task Matching and Scheduling onto Distributed Heterogeneous Computing Systems Elsevier Inc., 62( 9), 1338 – 1361.
[24] Ormon, Stephen W., Cassady, C. Richard and Greenwood, Allen G. 2002. Reliability Prediction model to Support Conceptual Design, IEEE Transactions on Reliability, 51, 151-157.
[25] Painton, L. and Campbell, J. 1992. Genetic Algorithm in Optimization of System Reliability, IEEE Transactions on Reliability, 44, 172-178.
[26] Palmer, J. and Mitrani, I. 2005. Optimal and heuristic policies for dynamic server allocation, Elsevier Inc., 65(10), 1204-1211.
[27] Ravindran, Binoy, Devarasetty, Ravi K. and Shirazi, Behrooz. 2002. Adaptive Resource Management Algorithms for Periodic Tasks in Dynamic Real-Time Distributed Systems, Elsevier Inc., 62(10) 1527 – 1547.
[28] Richard R.Y., Lee, E.Y.S. and Tsuchiya, M. 1982. A Task Allocation Model for Distributed Computer System, IEEE Transactions on Computer, 31, 41-47.
[29] Singh, M.P., Kumar, V. and Kumar, A. 1999. An Efficient Algorithm for Optimizing Reliability Index in Tasks-Allocation, Acta Ciencia Indica, xxv(m), 437-444.
[30] Ucar, Bora, Aykanat, Cevdet, Kaya, Kamer and Ikinci, Murat. 2006. Task assignment in heterogeneous computing systems. Elsevier Inc., 66(1),32-46.