Accepted
Article
This article has been accepted for publication and undergone full peer review but has not
DR. DANILO SILVA ALMEIDA (Orcid ID : 0000-0002-9115-8940) Article type : Research Paper
Can tropical grasses grown as cover crops improve soil
phosphorus availability?
DANILO S.ALMEIDA1*,DANIEL MENEZES-BLACKBURN2,3,KASSIANO F.ROCHA1,MURILO DE SOUZA1,HAO ZHANG2,PHILIP M.HAYGARTH2,CIRO A.ROSOLEM1
1
São Paulo State University, Department of Crop Science, Botucatu, 18610-307, Brazil
2
Lancaster University, Lancaster Environment Centre, Lancaster, LA1 4YQ, UK
3
Sultan Qaboos University, Department of Soils, Water and Agricultural Engineering, PO Box 34, Al-khod 123, Sultanate of Oman
*Corresponding Author: Danilo S. Almeida (E-mail: [email protected])
Running Title: Tropical grasses and soil phosphorus availability
Summary
Accepted
Article
palisade grass (Urochloa brizantha), and Guinea grass (Megathyrsus maximus) were grown in soils with contrasting P status. Soybean was grown after grasses to assess soil P bioavailability. Hedley P fractionation, microbial biomass P, phytase-labile P, and diffusive gradient in thin films were determined, before and after cultivation. It was found that grasses re-mobilized soil P, reducing the concentration of recalcitrant P forms. The effect of grasses on changing the P desorption kinetics parameters did not directly explain the observed variation on P bioavailability to soybean. Grasses and microorganisms solubilize recalcitrant organic P (Po) forms and tropical grasses grown as cover crops increased P bioavailability to
soybean mainly due to the supply of P by decomposition of grass residues in low-P soil. However, no clear advantages in soybean P nutrition were observed when in rotation with these grasses in high-P soil. This study indicates that further advantages in soybean P nutrition after tropical grasses may be impeded by phytate, which is not readily available to plants.
Keywords: Urochloa ruziziensis, Urochloa brizantha, Megathyrsus maximus, Cover crops, Phosphorus pools, Organic phosphorus.
Introduction
Phosphorus (P) uptake by cash crops has been observed to increase after growing cover crops, such as Lablab purpureus and Lupinus albus, due to release of P by the straw decomposition (Horst et al., 2001) or due to an increase in soil P bioavailable pools (Calegari
Accepted
Article
soil layers (Almeida & Rosolem, 2016). Cover crops may increase soil P availability to subsequent cash crops through an increase in the labile P, decrease of soil organic P (Po),
increase of P desorption kinetics, or by a simple release of readily available P during its decomposition and mineralization.
Organic acids exuded by roots may compete with P for adsorption sites and complex metals, inducing P desorption and solubilization in soil, and may also act as energy source to microorganisms (Hinsinger, 2001). Soil microbial biomass plays two main roles on soil P dynamics, not only as a main driver in mineralization of recalcitrant Po, but also in the
inorganic P (Pi) immobilization (Richardson et al., 2001). The Po is mainly composed of
orthophosphate monoesters (Stutter et al., 2015), which can be classified as labile monoesters such as the breakdown products of DNA, and non-labile monoesters such as inositol phosphates (Shears & Turner, 2007). Phytate is an inositol phosphate that can account for more than 70% of total Po (Canellas et al., 2004), being the least bioavailable Po form due to
its strong affinity to soil particles and fast precipitation as insoluble forms (Berg & Joern, 2006).
Accepted
Article
A closer look into P dynamics in the rhizosphere of tropical grasses is needed to achieve a better understanding of the potential of these grasses in inducing P cycling. The objective of this study was to evaluate the effect of tropical grasses on soil P dynamics and availability to soybean as a subsequent crop, to test the hypothesis that introducing grass species in the cropping system may affect soil P availability to soybean according to soil P concentration. Namely, this work aims to unravel how different cover crop grasses will affect: a) soil P pool distribution; b) Pi lability and desorption kinetics; and c) Po dynamics,
especially those involving phytate.
Materials and methods
The approach used a greenhouse experiment with soil taken from plots of a long-term experiment in Botucatu, Brazil (22º50′00″ S; 48º25′31″ W; altitude of 806 m), where soybean
[Glycine max (L.) Merrill] had been cropped since 1998. The soil is a Rhodic Hapludox (Soil Survey Staff, 2014) with 67% sand and 21% clay. For the experiment, soil was collected from the 0–0.20 m depth, and accommodated in 9 L plastic pots.
The experimental design was a 2 × 3 factorial in randomized complete blocks, and two control treatments, with eight replications. The treatments consisted of two soil P levels, three grass species, and non-cultivated controls without grasses. The soil P levels were characterized as low, for the soil that did not have P fertilizer added; and high, which had received a total of 305 kg/ha of P as triple superphosphate (TSP) from 2001 to 2014. The grass species were ruzi grass [Urochloa ruziziensis (R. Germ. and C.M. Evrard) Morrone and Zuloaga], palisade grass [U. brizantha (A. Rich.) R.D. Webster], and Guinea grass [Megathyrsus maximus (Jacq.) B.K. Simon and S.W.L. Jacobs].
Accepted
Article
Conducting the experiments
Five grass plants were grown in pots for 60 days and then desiccated with glyphosate, simulating the usual desiccation management in field. Pots from four replicates were disassembled to evaluate grass shoots, roots, and rhizosphere soil, while the pots from remaining four replicates were maintained intact after grass desiccation. Rhizosphere soil was considered the soil adhered to the roots, and was gently separated by hand-shaking. Fifteen days after desiccation, grass shoots from the intact pots were chopped into pieces and accommodated on the soil surface, and 6 seeds of soybean were sown. After thinning, two soybean plants were grown per pot up to flowering.
Soil chemical characterization
For all soil analyses, soil samples were air-dried and passed through a 2-mm sieve. The soils were initially analyzed for chemical characterization (Table 1). Soil available P was extracted using pearl resin (Resin–P), as well as calcium (Ca), magnesium (Mg), and potassium (K), according to Raij et al. (2001). Soil pH in CaCl2, soil organic matter (SOM), potential acidity
(H+Al), and cation exchange capacity (CEC) were determined according to Raij et al. (2001).
Phosphorus fractionation
Soil P fractionation was performed according to the method of Hedley et al. (1982) with the modifications proposed by Condron & Goh (1989). Briefly, 0.5 g of air-dried soil was subjected to the following sequential extraction: anion exchange resin (AER) strips; sodium bicarbonate (NaHCO3), 0.5 mol/L; sodium hydroxide, 0.1 mol/L (0.1 NaOH); hydrochloric
acid, 1 mol/L (HCl); and sodium hydroxide, 0.5 mol/L (0.5 NaOH). After extraction, 0.1 g of the soil was subjected to digestion (HNO3 + HClO4) for the extraction of residual P. In acid
Accepted
Article
were analyzed: AER–P, HCl–P, and Residual–P, respectively. The alkaline extracts were divided into two aliquots. In the first aliquot of each alkaline extract, the following inorganic P (Pi) fractions were obtained: NaHCO3–Pi, 0.1 NaOH–Pi, and 0.5 NaOH–Pi. The second
aliquot was subjected to digestion with ammonium persulfate and sulfuric acid in an autoclave to determine the total P (Pt) content. The molybdate unreactive P was calculated as
the difference between Pt and Pi and was here termed as organic P (Po). Thus, the following
extracted P fractions were obtained: NaHCO3–Pt, NaHCO3–Po, 0.1 NaOH–Pt, 0.1 NaOH–Po,
0.5 NaOH–Pt, and 0.5 NaOH–Po. An analytical triplicate was used throughout the
fractionation analysis. The sum of all extracted P fractions was labeled Total–P. The data was expressed as the change (Δ) for each P fraction between the samples collected before (time 0)
and after grass growth.
Phytase labile phosphorus
Phytase labile P was assayed in soil extracts with 0.25 mol/L NaOH plus 0.05 mol/L ethylenediaminetetraacetic acid (NaOH-EDTA). Samples of 2 g of air dried soil were extracted with 20 mL of extractant on a reciprocal shaker for 16 h. Phytase labile P (PPhy-lab)
was determined using a commercially available phytase (Natuphos, EC 3.1.3.8; BASF SE, Ludwigshafen, Germany). Briefly, soil extracts (100 μL) were combined with 100 μL of
phytase (100 nKat/mL) diluted in a buffer (50 mmol/L acetate, pH 5.5) and incubated at 37ºC for 16 h. Organic P hydrolysable by phytases was inferred by the difference of Pi content
measured after the incubation of samples with phytase and samples with denatured phytase. Similarly, to the fractionation analysis, Pt, Pi and Po extracted by NaOH-EDTA were
also assayed. The difference between NaOH-EDTA–Pt and NaOH-EDTA–Pi corresponds to
NaOH-EDTA–Po. The change (Δ) in these parameters to the initial concentration and the
Accepted
Article
Microbial biomass phosphorus
The microbial biomass P (MBP) was determined according to Stutter et al. (2015) and references cited therein. Samples of 80 g of soil were placed in a container and wetted with ultra-pure Milli-Q (MQ) water to approximately 50% water holding capacity to re-establish microbial activity, and incubated for 72 h. After incubation, the soil slurry was prepared by adding MQ water and mixing the soil until maximum retention was reached. Quadruplicates of soil slurry (1 g of dry weight equivalent) were extracted for 16 h in 10 mL of MQ water with AER strips either with or without addition of 0.4 mL hexanol. After 16 h, the resins were eluted with 0.5 mol/L HCl and the concentration of P was measured. The MBP was estimated as the difference between samples extracted with and without hexanol. A correction factor to account for sorption of P to soil solid phase was determined from soil samples spiked with 20 mg/g of P.
Diffusive gradient and equilibrium in thin films
Soil labile P was measured using diffusive gradient in thin films (DGT) and soil solution P was assessed using diffusive equilibrium in thin films (DET) as in Menezes-Blackburn et al.
(2016b) and references cited therein. A binding layer containing ferrihydrite was used for the DGT test. More information about the preparation of the diffusive and binding layer are published in Menezes-Blackburn et al. (2016b).
The DET devices were deployed in soil slurry prepared as in MBP analysis. On the next day, the DGT devices were deployed for 48 h. The DGT and DET devices were deployed in duplicates for each experimental replicate. The diffusive and binding layers were eluted in 0.5 mL of H2SO4 solution, 0.25 mol/L. The concentration of P in the diffusive layer
Accepted
Article
concentration of labile P (PDGT) at the surface of the DGT devices was calculated using eq. 1
(Zhang & Davison, 1995).
P = ∆ (1)
where M is the accumulated P mass in the binding layer, A is the surface area of the DGT sampling window, t is the deployment time, Δg is the total thickness of the diffusive gel layer
and the filter membrane, and D is the diffusion coefficient of P in the diffusive gel. The PDGT
could be converted to an effective concentration (PE) using eq. 2 (Zhang et al., 2001).
P = (2)
The diffusive only ratio (Rdiff) between PDGT and soil solution P (PDET) was calculated
using a dynamic numerical model (DIFS) (Harper et al., 2000). The ratio (R) of measured PDGT concentration to the PDET was calculated as in eq. 3.
R = (3)
The relative resupply from solid phase (R-Rdiff) was calculated subtracting the Rdiff
from the R ratio. Using the DIFS model, the Tc was also obtained.
Plant analysis
Accepted
Article
Statistical analysis
Data were subjected to ANOVA considering a 2 × 3 factorial in randomized complete blocks, with four replications, and means were compared using Tukey’s test (p < 0.05). To allow a better comparison of the grass effect, the control treatment was not included in ANOVA and Tukey’s test. Instead, a second ANOVA was performed, considering a 2 × 4 factorial in randomized complete blocks, with four replications, and Dunnett’s test (p < 0.05) was used to compare the significance of the difference between different treatments and the respective controls. All the statistical analyses were performed using SAS software (SAS Inst., North Carolina, U.S.).
Results and discussion
Soil phosphorus pools: distribution and availability
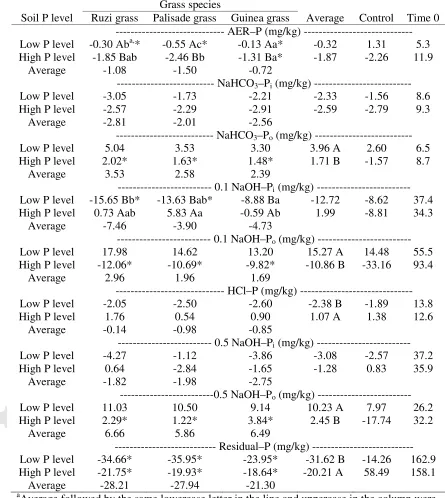
The calculated change (Δ) in soil P concentrations in each pool before and after grass cultivation can be interpreted as a decrease in the P pool (negative Δ values). This indicates
that P was transferred to other pools or taken up by the grasses, while an increase in the P pool (positive Δ values) indicates that P was accumulated into this pool (Table 2). Great changes in P pools were observed, since the Δ was obtained from the rhizosphere soil, a
particular region where the effect of roots and microorganisms is much higher than in the bulk soil.
Growing grasses depleted Pi in the firsts extracts of the sequential fractionation
(AER–P, NaHCO3–Pi) (Table 2), which are considered the most available soil P fractions
Accepted
Article
of sorption and desorption processes, which transfer Pi between the solid and solution phases.
The control treatment with low P level had a small increase in AER–P; possibly, this was a consequence of the MBP mineralization (Macklon et al., 1997).
The sum of Po fractions extracted with NaHCO3, 0.1 and 0.5 NaOH accounted for
46% to 56% of total soil P fractions when Residual–P was not considered. Organic P accounted for approximately 60% and 54% of total soil P extracted with NAOH-EDTA, for soils with low and high P levels, respectively. The high proportions of Po in the soil suggest
the importance of the mobilization of this fraction to improve plant P nutrition (Rodrigues et al., 2016).
The simple incubation of moist uncultivated soil of the control treatments at greenhouse conditions caused a significant change in Po pools, indicating an active microbial
role in redistributing these fractions. These uncultivated control samples behaved remarkably different at different P levels: while in the low-P soils there was a movement from residual P towards more labile pools, the opposite was observed at high P levels, where P was continuously fixed into this less labile pool (Residual-P). Conversely, the presence of plants changed these trends, causing a depletion of Residual–P and an increase of alkali soluble Po
fractions in the rhizosphere (Table 2). The HCl-extractable P was decreased in the low-P soil and it was increased in the high-P soil compared with the initial concentrations, regardless of the effect of grass cultivation.
Accepted
Article
When grasses were grown, there was an increase in Po pools extracted with
NaHCO3, and 0.5 mol/L NaOH (Table 2), which is in accordance with the observations in
field studies with crop rotations under no-till (Almeida & Rosolem, 2016; Rodrigues et al., 2016), and in pot studies (Horst et al., 2001). However, for soil with high P level, the Po
extracted with 0.1 mol/L NaOH was decreased by the grasses. According to Beck & Sanchez (1994), NaOH-extractable Po is an important source of P in weathered soils that have not had
P fertilizer added, which may have contributed to the decrease of this fraction observed in the soil with high P level in the present study. Studies have shown that phytate content in soils is frequently found to be major fraction of Po and may account for the most part of total Po
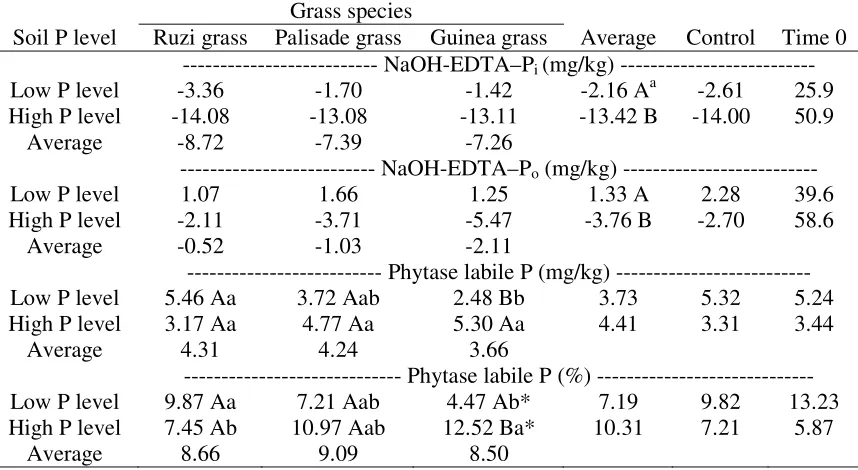
(Canellas et al., 2004), however here the PPhy-lab was approximately 23% and 13% of Po
extracted with NAOH-EDTA in the present study, for the low- and high-P soils, respectively. Chapuis-Lardy et al. (2001) reported that in Cerrado oxisols Po appears to be mainly in form
of stable monoesters in the NaHCO3 and 0.5 NaOH extracts. Therefore, the increase in Po
observed in NaHCO3 and 0.5 NaOH extracted from P fractionation in this experiment may be
related to the increase in PPhy-lab, which is poorly labile.
Since the PPhy-lab increased in all the treatments, soil microorganisms could have
desorbed the recalcitrant Po including phytate, increasing PPhy-lab, where no changes in phytate
content were expected, since no plants were grown. The decrease in the Residual–P and the increase in Po pools is an indication that recalcitrant Po forms from Residual–P changed to
less recalcitrant P forms in the Po pools. These changes could turn phytate or other
recalcitrant organic compounds to forms more accessible by phytases, increasing the PPhy-lab.
Although the interaction of phytate with inorganic soil compounds has been much studied, less is known about phytate interactions with the soil organic compounds (Nanny & Minear, 1994). The increased PPhy-lab could indicate an important possible way to further improve P
Accepted
Article
PPhy-lab pool, possibly even higher increases in soybean P uptake and dry mass could have
been observed.
In the soil with high P level, a possible competition of grass roots with microorganisms occurred, since MBP was lower in the soil cultivated with grasses than in the control (Table 4). The MBP was higher in the high P control than in the low P control, indicating that P is a limiting nutrient for the microbes in these soils.
Inorganic phosphorus lability and desorption kinetics
The low Total–P content observed in the present study is in agreement with the range of Total–P observed in similar weathered soils from Cerrado by Chapuis-Lardy et al. (2001), from 301 to 456 mg/kg in natural and pasture soils, respectively. Because of low Total–P content and high adsorption P capacity, the most labile P pools are low, and the PDET in the
low-P soil was below the limit of detection by the malachite green method (1 µg/L). Since the PDET was not measured, it was not possible to calculate a series of other parameters, such as
Kd, R, R-Rdiff, and Tc, for the soil with low P level. Therefore, Table 5shows only results of
these parameters for soil with high P level.
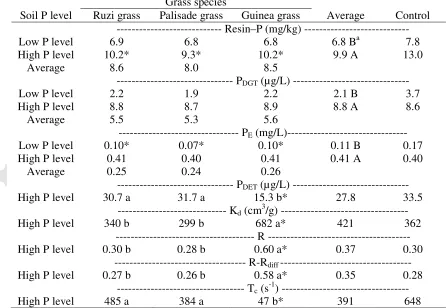
The contrasting differences observed in Resin–P, PDGT, and PE is not a surprise
(Mason et al., 2010). In the present study, P concentration extracted with resin was lower than the control treatment in the high-P soil; however, no differences were related to soybean plants grown on soil previously cultivated or not with grass, in the soil with high P level (Table 5). In soil with a lower P level, Resin–P was also not related with soybean response to P availability. In the high P soil, the results obtained with DGT corresponded with the response of soybean to P, which indicates a higher accuracy of this method to predict P availability than resin (Mason et al., 2010). However, in the low-P soil, PE was negatively
Accepted
Article
contrasting response of soybean plants and PE may be a consequence of the different
mechanisms to induce P mobilization by soybean plants, as root exudation and microbial growth stimulation (Hinsinger, 2001; Richardson et al., 2001), and also due to P release from cover crop residues (Horst et al., 2001).
The calculated ratio (R) between PDGT and PDET resulted in higher values than the
most part of soils analyzed by Menezes-Blackburn et al. (2016b), meaning that in this highly weathered soil, the contribution of Pi diffusion is small compared with the replenishment of
pore water Pi, due to its desorption from the solid phase. The Rdiff is the hypothetical ratio of
the PDGT to the concentration in the soil solution if no resupply occurs (only pore water P
diffusion). Since Rdiff was low, R-Rdiff was the dominant component on plant P
bioavailability. Surprisingly, Tc values were low, and also different from those of the
temperate soil samples analyzed by Menezes-Blackburn et al. (2016b), underlying the importance soil-P buffering capacity in this system. The soil used in this study has a very interesting P desorption behavior, because while soil solution P is low, P resupply to soil solution is fast, evidenced by the high Kd. This suggests that these soils can adsorb a high
amount of P with low energy, despite oxisols being known to have a very high P sorption capacity. Nevertheless, it is worth noticing that the experimental soil has more than 60% of sand particles, which may have contributed to the low P adsorption energy.
As observed by Nunes et al. (2008), Guinea grass has a high P demand. Growing Guinea grass resulted in a lower content of PDET than the other species in the high P soil, and
consequently, P availability was even more dependent from the resupply from the solid phase, and the sorption rate constant was 10 times higher in the soil cultivated with Guinea grass than with the other species. However, the decrease in PDET resulted in an increased
Accepted
Article
Plant growth and phosphorus uptake
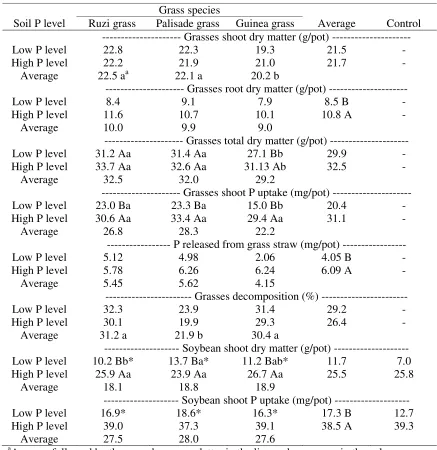
Soil P was a limiting factor only to Guinea grass, which makes sense because ruzi grass and palisade grass are better adapted to P-poor soils (Rao et al., 1996). In the high P soil, the smaller dry mass of Guinea grass compared with ruzi grass and palisade grass was probably due to the lower P uptake (Table 6). The higher demand for P by Guinea grass than the Urochloa species is possibly due to its low capacity to mobilize less labile P forms.
Several plant species have been reported to exude compounds that increase soil P bioavailability into the rhizosphere, due to solubilization and mineralization of Po, such
organic acids and phosphatases (Hinsinger, 2001). It has been reported that ruzi grass and palisade grass are able to exude high amounts of organic acids (Ishikawa et al., 2000) that may stimulate rhizosphere microorganisms (Menezes-Blackburn et al., 2016a). Urochloa species are highly adapted to low soil P fertility, however, the mechanisms responsible need further research. Several soil microorganisms can produce phosphatases, and the relationship between plants and these microorganisms is important in the soil P cycle, in order for plants to acquire P from soil recalcitrant P sources (Richardson et al., 2001). According to Hayes et al. (2000), extractable Po increases with citric acid concentration, which could enhance P
availability in the rhizosphere. Guinea grass seems to not be able to feed rhizosphere microorganisms as the other species, which also accounts for a lower shoot P accumulation in this species. The DIFS derived parameters also reflect the higher P demand by Guinea grass, depleting P in the soil solution, impairing plant P acquisition and P resupply, and eventually limiting the proliferation of microorganisms due to P competition.
Accepted
Article
fallow, as observed by Horst et al. (2001) growing Lablab purpureus. According to Canellas
et al. (2004), the addition of crop residues on the soil surface results in increased soil diester P, which is considered a labile P form. This effect was observed only in the low-P soil, indicating that P fertilizer application created a P sufficiency condition that overcame the effect of grasses in increasing P bioavailability to soybean. In the soil with high P level, even with the P re-mobilization due to grass growth, and the large increase of the Residual–P in the control treatment, soybean P uptake was not affected. The large differences in DIFS derived parameters observed between grass species in the soil with high P level were not reflected in differences in soybean P uptake, since this soil shows a high capacity to resupply P to soil solution.
Almeida & Rosolem (2016) have shown that ruzigrass increases labile soil P forms in the long-term; however, the authors were not able to determine if the increase resulted either from changes in the less labile P pools or by deposition of P from ruzigrass residues. In the present study, analyzing the grasses effects in the short-term, the contribution of P deposition from grass residues seems to be the main factor improving P availability to soybean in low-P soil. A closer look into P dynamics in the rhizosphere of tropical grasses revealed a depletion of labile P forms, which may result in higher P adsorption capacity and lower soil P desorption, as observed by Almeida et al. (2018) and also here through a lower PE concentration in low-P soil. According to Almeida et al. (2018), ruzigrass should result in
the accumulation of recalcitrant Po forms in soil. In the present study, it was observed that
tropical grasses and microorganisms may expose recalcitrant Po forms, resulting in increased
concentration of these Po forms, and showing that a great improvement in P availability may
depend not only on the release of P from grass residues, but also on the mineralization of recalcitrant Po forms such as phytate.
Accepted
Article
Conclusions
The soil P pool distribution is highly affected by tropical grasses grown as cover crops. Ruzi grass, palisade grass or Guinea grass increased P cycling, decreasing the less available P forms, regardless of soil initial P level. Grasses seems to solubilize recalcitrant Po forms,
exposing phytates, and consequently increasing non-labile P concentration. The soil used in this study showed a capacity to resupply P to soil solution quickly, even with a very high P sorption. Nevertheless, changes in P desorption kinetics did not seem to explain the observed differences in P uptake by soybean.
The supply of P by decomposition of grass residues is the key factor to improve soybean P nutrition, and consequently increase soybean yield. When the soil P concentration is higher due to P fertilizer application, no clear advantages in soybean P nutrition were observed when in rotation with these grasses, rejecting the hypothesis that grass species improve the subsequent soybean P uptake in high-P soil.
Acknowledgments
Accepted
Article
References
Almeida, D.S., Penn, C.J. & Rosolem, C.A. 2018. Assessment of phosphorus availability in soil cultivated with ruzigrass. Geoderma, 312, 64-73.
Almeida, D.S. & Rosolem, C.A. 2016. Ruzigrass grown in rotation with soybean increases soil labile phosphorus. Agronomy Journal, 108, 1-9.
Beck, M.A. & Sanchez, P.A. 1994. Soil phosphorus fraction dynamics during 18 years of cultivation on a typic Paleudult. Soil Science Society of America Journal, 58, 1424-1431.
Berg, A.S. & Joern, B.C. 2006. Sorption dynamics of organic and inorganic phosphorus compounds in soil. Journal of Environmental Quality, 35, 1855-1862.
Calegari, A., Tiecher, T., Hargrove, W.L., Ralisch, R., Tessier, D., de Tourdonnet, S., Guimarães, M.d.F. & dos Santos, D.R. 2013. Long-term effect of different soil management systems and winter crops on soil acidity and vertical distribution of nutrients in a Brazilian Oxisol. Soil and Tillage Research, 133, 32-39.
Canellas, L.P., Espíndola, J.A.A., Guerra, J.G.M., Teixeira, M.G., Velloso, A.C.X. & Rumjanek, V.M. 2004. Phosphorus analysis in soil under herbaceous perennial leguminous cover by nuclear magnetic spectroscopy. Pesquisa Agropecuária Brasileira, 39, 589-596.
Chapuis-Lardy, L., Brossard, M. & Quiquampoix, H. 2001. Assessing organic phosphorus status of Cerrado oxisols (Brazil) using 31P-NMR spectroscopy and phosphomonoesterase activity measurement. Canadian Journal of Soil Science, 81, 591-601.
Condron, L.M. & Goh, K.M. 1989. Effects of long-term phosphatic fertilizer applications on amounts and forms of phosphorus in soils under irrigated pasture in New Zealand.
Journal of Soil Science, 40, 383-395.
Cross, A.F. & Schlesinger, W.H. 1995. A literature review and evaluation of the Hedley fractionation: applications to the biogeochemical cycle of soil phosphorus in natural ecosystems. Geoderma, 64, 197-214.
Harper, M.P., Davison, W. & Tych, W. 2000. DIFS - A modelling and simulation tool for DGT induced trace metal remobilisation in sediments and soils. Environmental Modelling & Software, 15, 55-66.
Hayes, J.E., Richardson, A.E. & Simpson, R.J. 2000. Components of organic phosphorus in soil extracts that are hydrolysed by phytase and acid phosphatase. Biology and Fertility of Soils, 32, 279-286.
Hedley, M.J., Stewart, J.W.B. & Chauhan, B.S. 1982. Changes in inorganic and organic soil phosphorus fractions induced by cultivation practices and by laboratory incubations.
Soil Science Society of America Journal, 46, 970-976.
Hinsinger, P. 2001. Bioavailability of soil inorganic P in the rhizosphere as affected by root-induced chemical changes: A review. Plant and Soil, 237, 173-195.
Horst, W.J., Kamh, M., Jibrin, J.M. & Chude, V.O. 2001. Agronomic measures for increasing P availability to crops. Plant and Soil, 237, 211-223.
Ishikawa, S., Wagatsuma, T., Sasaki, R. & Ofei-Manu, P. 2000. Comparison of the amount of citric and malic acids in Al media of seven plant species and two cultivars each in five plant species. Soil Science and Plant Nutrition, 46, 751-758.
Jackson, M.L. 1973. Soil chemical analysis, Prentice Hall of India New Delhi.
Accepted
Article
Mason, S., McNeill, A., McLaughlin, M.J. & Zhang, H. 2010. Prediction of wheat response to an application of phosphorus under field conditions using diffusive gradients in thin-films (DGT) and extraction methods. Plant and Soil, 337, 243-258.
Menezes-Blackburn, D., Paredes, C., Zhang, H., Giles, C.D., Darch, T., Stutter, M., George, T.S., Shand, C., Lumsdon, D., Cooper, P., Wendler, R., Brown, L., Blackwell, M., Wearing, C. & Haygarth, P.M. 2016a. Organic acids regulation of chemical–microbial phosphorus transformations in soils. Environmental Science & Technology, 50, 11521-11531.
Menezes-Blackburn, D., Zhang, H., Stutter, M., Giles, C.D., Darch, T., George, T.S., Shand, C., Lumsdon, D., Blackwell, M., Wearing, C., Cooper, P., Wendler, R., Brown, L. & Haygarth, P.M. 2016b. A holistic approach to understanding the desorption of phosphorus in soils. Environmental Science & Technology, 50, 3371-3381.
Merlin, A., Rosolem, C.A. & He, Z.L. 2015. Non-labile phosphorus acquisition by
Brachiaria. Journal of Plant Nutrition, 39, 1319-1327.
Nanny, M.A. & Minear, R.A. 1994. Organic phosphorus in the hydrosphere. In:
Environmental chemistry of lakes and reservoirs. American Chemical Society, Washington, DC, pp. 161-191.
Nunes, F.N., Cantarutti, R.B., Novais, R.F., Silva, I.R.d., Tótola, M.R. & Ribeiro, B.N. 2008. Atividade de fosfatases em gramíneas forrageiras em resposta à disponibilidade de fósforo no solo e à altura de corte das plantas. Revista Brasileira de Ciência do Solo,
32, 1899-1909.
Raghothama, K.G. & Karthikeyan, A.S. 2005. Phosphate acquisition. Plant and Soil, 274, 37-49.
Raij, B., Andrade, J.C., Cantarella, H. & Quaggio, J.A. 2001. Análise química para avaliação da fertilidade de solos tropicais, Instituto Agronômico, Campinas.
Rao, I.M., Kerridge, P.C. & Macedo, M.C.M. 1996. Nutritional requirements of Brachiaria
and adaptation to acid soils. In: Brachiaria: Biology, Agronomy and Improvement.
(eds J.W. Miles, B.L. Maass & C.B. do Valle), CIAT/EMBRAPA, Cali/Brasília, pp. 53-71.
Richardson, A.E., Hadobas, P.A., Hayes, J.E., O'Hara, C.P. & Simpson, R.J. 2001. Utilization of phosphorus by pasture plants supplied with myo-inositol hexaphosphate is enhanced by the presence of soil micro-organisms. Plant and Soil, 229, 47-56.
Rodrigues, M., Pavinato, P.S., Withers, P.J.A., Teles, A.P.B. & Herrera, W.F.B. 2016. Legacy phosphorus and no tillage agriculture in tropical oxisols of the Brazilian savanna. Science of the Total Environment, 542, 1050-1061.
Roose, T. & Kirk, G.J.D. 2009. The solution of convection–diffusion equations for solute transport to plant roots. Plant and Soil, 316, 257-264.
Shears, S.B. & Turner, B.L. 2007. Nomenclature and terminology of inositol phosphates: clarification and a glossary of terms. In: Inositol phosphates: Linking agriculture and the environment. (eds B.L. Turner, A.E. Richardson & E.J. Mullaney), CAB International, Wallingford, UK, pp. 1-6.
Soil Survey Staff (2014) Keys to soil taxonomy, 12th ed. Keys to soil taxonomy. USDA-Natural Resources Conservation Service.
Stutter, M.I., Shand, C.A., George, T.S., Blackwell, M.S.A., Dixon, L., Bol, R., MacKay, R.L., Richardson, A.E., Condron, L.M. & Haygarth, P.M. 2015. Land use and soil factors affecting accumulation of phosphorus species in temperate soils. Geoderma,
257–258, 29-39.
Accepted
Article
Zhang, H. & Davison, W. 1995. Performance characteristics of diffusion gradients in thin films for the in situ measurement of trace metals in aqueous solution. Analytical Chemistry, 67, 3391-3400.
Zhang, H., Zhao, F.-J., Sun, B., Davison, W. & McGrath, S.P. 2001. A new method to measure effective soil solution concentration predicts copper availability to plants.
Environmental Science & Technology, 35, 2602-2607.
Table 1 Selected chemical characteristics of initial soil samples collected before grasses grown, as a function of soil phosphorus (P) level.
Soil P level Low P
level
High P level Chemical soil characterization
pHa 5.5 5.7
--- mg/kg---
Resin–Pb 8 19
--- g/kg---
SOMc 19 18
--- mmolc/kg ---
H+Ald 12.5 13.2
K 2.0 1.1
Ca 24 22
Mg 0.16 0.14
CECe 39 36
a
Soil pH measured in calcium chloride solution.
b
Phosphorus extracted with pearl resin.
c
Soil organic matter.
d
Potential acidity.
Accepted
[image:20.612.78.523.110.608.2]Article
Table 2 Changes (∆) in soil phosphorus (P) fractions content between soils sampled before (Time 0) and after grasses growth, as a function of soil P level and grass species, and a control treatment with soil kept fallow.
Grass species
Average Control Time 0 Soil P level Ruzi grass Palisade grass Guinea grass
--- AER–P (mg/kg) ---
Low P level -0.30 Aba,* -0.55 Ac* -0.13 Aa* -0.32 1.31 5.3 High P level -1.85 Bab -2.46 Bb -1.31 Ba* -1.87 -2.26 11.9
Average -1.08 -1.50 -0.72
--- NaHCO3–Pi(mg/kg) ---
Low P level -3.05 -1.73 -2.21 -2.33 -1.56 8.6
High P level -2.57 -2.29 -2.91 -2.59 -2.79 9.3
Average -2.81 -2.01 -2.56
--- NaHCO3–Po (mg/kg) ---
Low P level 5.04 3.53 3.30 3.96 A 2.60 6.5
High P level 2.02* 1.63* 1.48* 1.71 B -1.57 8.7
Average 3.53 2.58 2.39
--- 0.1 NaOH–Pi(mg/kg) ---
Low P level -15.65 Bb* -13.63 Bab* -8.88 Ba -12.72 -8.62 37.4
High P level 0.73 Aab 5.83 Aa -0.59 Ab 1.99 -8.81 34.3
Average -7.46 -3.90 -4.73
--- 0.1 NaOH–Po (mg/kg) ---
Low P level 17.98 14.62 13.20 15.27 A 14.48 55.5
High P level -12.06* -10.69* -9.82* -10.86 B -33.16 93.4
Average 2.96 1.96 1.69
--- HCl–P (mg/kg) ---
Low P level -2.05 -2.50 -2.60 -2.38 B -1.89 13.8
High P level 1.76 0.54 0.90 1.07 A 1.38 12.6
Average -0.14 -0.98 -0.85
--- 0.5 NaOH–Pi(mg/kg) ---
Low P level -4.27 -1.12 -3.86 -3.08 -2.57 37.2
High P level 0.64 -2.84 -1.65 -1.28 0.83 35.9
Average -1.82 -1.98 -2.75
---0.5 NaOH–Po (mg/kg) ---
Low P level 11.03 10.50 9.14 10.23 A 7.97 26.2
High P level 2.29* 1.22* 3.84* 2.45 B -17.74 32.2
Average 6.66 5.86 6.49
--- Residual–P (mg/kg) --- Low P level -34.66* -35.95* -23.95* -31.62 B -14.26 162.9 High P level -21.75* -19.93* -18.64* -20.21 A 58.49 158.1
Average -28.21 -27.94 -21.30
a
Average followed by the same lowercase letter in the line and uppercase in the column were not significantly different, as a function of soil P level and grass species (Tukey, p < 0.05); *Indicates a significant difference between each treatment and the control treatment (Dunnett,
Accepted
[image:21.612.94.523.148.383.2]Article
Table 3 Changes (∆) in soil phosphorus (P) concentration extracted with sodium hydroxide and Ethylenediaminetetraacetic acid (NaOH-EDTA), and soil phytase labile P (Pphy-lab)
concentration and changes in percentage of Pphy-lab according to organic P extracted with
NaOH-EDTA (NaOH-EDTA–Po). Changes calculated between soils sampled before (Time 0)
and after grasses growth, as affected by soil P level and grass species, and a control treatment with soil kept fallow.
Grass species
Average Control Time 0 Soil P level Ruzi grass Palisade grass Guinea grass
--- NaOH-EDTA–Pi (mg/kg) ---
Low P level -3.36 -1.70 -1.42 -2.16 Aa -2.61 25.9
High P level -14.08 -13.08 -13.11 -13.42 B -14.00 50.9
Average -8.72 -7.39 -7.26
--- NaOH-EDTA–Po (mg/kg) ---
Low P level 1.07 1.66 1.25 1.33 A 2.28 39.6
High P level -2.11 -3.71 -5.47 -3.76 B -2.70 58.6
Average -0.52 -1.03 -2.11
--- Phytase labile P (mg/kg) ---
Low P level 5.46 Aa 3.72 Aab 2.48 Bb 3.73 5.32 5.24
High P level 3.17 Aa 4.77 Aa 5.30 Aa 4.41 3.31 3.44
Average 4.31 4.24 3.66
--- Phytase labile P (%) --- Low P level 9.87 Aa 7.21 Aab 4.47 Ab* 7.19 9.82 13.23 High P level 7.45 Ab 10.97 Aab 12.52 Ba* 10.31 7.21 5.87
Average 8.66 9.09 8.50
a
Average followed by the same lowercase letter in the line and uppercase in the column were not significantly different, as a function of soil P level and grass species (Tukey, p < 0.05); *Indicates a significant difference between each treatment and the control treatment (Dunnett,
Accepted
[image:22.612.89.523.100.180.2]Article
Table 4 Microbial biomass phosphorus (P), as affected by soil P level and grass species, and a control treatment with soil kept fallow.
a
Different letters in rows indicate significant differences (Tukey, p < 0.05);
*Indicates a significant difference between each treatment and the control treatment (Dunnett,
p < 0.05).
Table 5 Soil available phosphorus (P) extracted with pearl resin (Resin–P), labile P (PDGT)
and effective phosphorus concentration (PE), as affected by soil P level and grass species, and
a control treatment with soil kept fallow. Soil solution P (PDET), resupply potential (Kd), and
response time of the system (Tc) as a function of grass species, and a control treatment with
soil kept fallow, in soil with high P level.
Soil P level
Grass species
Average Control Ruzi grass Palisade grass Guinea grass
--- Resin–P (mg/kg) ---
Low P level 6.9 6.8 6.8 6.8 Ba 7.8
High P level 10.2* 9.3* 10.2* 9.9 A 13.0
Average 8.6 8.0 8.5
--- PDGT (µg/L) ---
Low P level 2.2 1.9 2.2 2.1 B 3.7
High P level 8.8 8.7 8.9 8.8 A 8.6
Average 5.5 5.3 5.6
--- PE(mg/L)---
Low P level 0.10* 0.07* 0.10* 0.11 B 0.17
High P level 0.41 0.40 0.41 0.41 A 0.40
Average 0.25 0.24 0.26
--- PDET (µg/L) ---
High P level 30.7 a 31.7 a 15.3 b* 27.8 33.5
--- Kd (cm3/g) ---
High P level 340 b 299 b 682 a* 421 362
--- R ---
High P level 0.30 b 0.28 b 0.60 a* 0.37 0.30
--- R-Rdiff
---High P level 0.27 b 0.26 b 0.58 a* 0.35 0.28
--- Tc (s-1) ---
High P level 485 a 384 a 47 b* 391 648
a
Average followed by the same lowercase letter in the line and uppercase in the column were not significantly different, as a function of soil P level and grass species (Tukey, p < 0.05); *Indicates a significant difference between each treatment and the control treatment (Dunnett,
p < 0.05). Soil P level
Grass species
Average Control Ruzi grass Palisade grass Guinea grass
--- Microbial biomass P (mg/kg) ---
Low P level 0.63 0.54 0.51 0.57 0.60
High P level 0.70* 0.66* 0.42* 0.72 1.15
[image:22.612.78.524.352.660.2]Accepted
[image:23.612.87.524.133.583.2]Article
Table 6 Grass shoot, root, and total dry matter, grass shoot phosphorus (P) uptake before desiccation, P release from grass straw 60 days after desiccation, and decomposition of grasses straw, as affected by soil P level and grass species. Soybean shoot dry matter and shoot P uptake, as affected by soil P level and grass species, and a control treatment with soil kept fallow.
a
Average followed by the same lowercase letter in the line and uppercase in the column were not significantly different, as a function of soil P level and grass species (Tukey, p < 0.05); *Indicates a significant difference between each treatment and the control treatment (Dunnett,
p < 0.05). Soil P level
Grass species
Average Control Ruzi grass Palisade grass Guinea grass
--- Grasses shoot dry matter (g/pot) ---
Low P level 22.8 22.3 19.3 21.5 -
High P level 22.2 21.9 21.0 21.7 -
Average 22.5 aa 22.1 a 20.2 b
--- Grasses root dry matter (g/pot) ---
Low P level 8.4 9.1 7.9 8.5 B -
High P level 11.6 10.7 10.1 10.8 A -
Average 10.0 9.9 9.0
--- Grasses total dry matter (g/pot) ---
Low P level 31.2 Aa 31.4 Aa 27.1 Bb 29.9 -
High P level 33.7 Aa 32.6 Aa 31.13 Ab 32.5 -
Average 32.5 32.0 29.2
--- Grasses shoot P uptake (mg/pot) ---
Low P level 23.0 Ba 23.3 Ba 15.0 Bb 20.4 -
High P level 30.6 Aa 33.4 Aa 29.4 Aa 31.1 -
Average 26.8 28.3 22.2
--- P released from grass straw (mg/pot) ---
Low P level 5.12 4.98 2.06 4.05 B -
High P level 5.78 6.26 6.24 6.09 A -
Average 5.45 5.62 4.15
--- Grasses decomposition (%) ---
Low P level 32.3 23.9 31.4 29.2 -
High P level 30.1 19.9 29.3 26.4 -
Average 31.2 a 21.9 b 30.4 a
--- Soybean shoot dry matter (g/pot) ---
Low P level 10.2 Bb* 13.7 Ba* 11.2 Bab* 11.7 7.0
High P level 25.9 Aa 23.9 Aa 26.7 Aa 25.5 25.8
Average 18.1 18.8 18.9
--- Soybean shoot P uptake (mg/pot) ---
Low P level 16.9* 18.6* 16.3* 17.3 B 12.7
High P level 39.0 37.3 39.1 38.5 A 39.3