Author Pre-Print – not for distribution
© ACM, 2019. This is the author's version of the work. It is posted here by permission of ACM for your personal use. Not for redistribution. The definitive version was published in the ACM Proceedings of Creativity & Cognition, San Diego, CA, USA — June 23 - 26, 2019, http://doi.acm.org/
10.1145/3325480.3325481
Sketching Sustainability in Computing
Miriam Sturdee, Lancaster University, UK; Samuel Mann, Otago Polytechnic, Dunedin, New Zealand; Sheelagh Carpendale, Simon Fraser University, Burnaby, Canada
[image:1.595.217.379.235.388.2]Keywords: sketchnotes; graphic recording; visual facilitation; attendee-sourcing; sustainability;
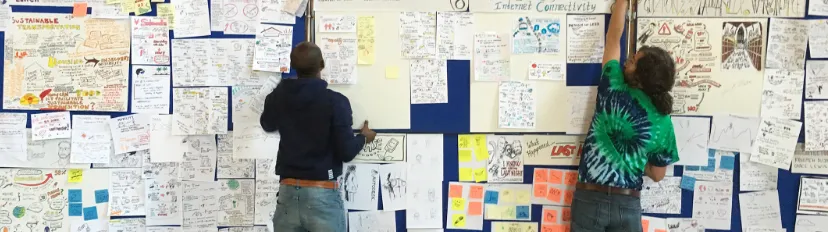
Figure 1: A participant sketches a converstation
Abstract:
We investigate engaging a computer science conference audience in sketching responses to the event as it occurs. In particular, we explore the response to inviting those present to engage in what is essentially an off-line, co-located, attendee-sourcing experience.
Sketchnoting is a popular practice for documenting events, but these sketched records can be limited in scope at multi-track conferences, and paid professionals can be unaffordable at smaller events. Our challenges included: working with an audience with little or no experience of sketching or working with imagery; who were unaware of the possible benefits; and whose attendee engagement was variable -- with individuals often working on laptops rather than actively listening during sessions. In order encourage engagement we hosted a pre-conference workshop, developed a pre-conference-specific set of visual icons, and created prompt materials. This resulted in a remarkable visual record of the event, and also an increase in active listening and engagement.
Introduction:
Sketching is a human activity which visually documents the world around us, produces reflective imagery, and even helps us solve problems [roam2013]. The ability of hand-drawn sketches to capture thought, opinion, and show a record of events is well documented [mendoncca2016, sturdee2018blog, wallace2017]. These types of visuals offer an organic, human response to stimuli, and have been shown to aid recall [paepcke2017sketchnoting], offer opportunities for reflection, analysis and feedback [fernandez2018, walny2011] enhance learning and engagement [paepcke2017sketchnoting] and have additional cognitive benefits that are sometimes lost when we make the move to digital note-taking [goldschmidt2017].
organisers to keep and use for promotion [dean2013], documentary [mendoncca2016, wallace2017] or analysis [fernandez2018].
Computer science, like other academic disciplines, hosts a variety of conferences in order to bring together like-minded researchers, disseminate data from research projects and to form networks and collaborations. At some computing-focused events, hired artists create
sketchnotes to document talks and events, but these images are rarely seen outside of the conference venue, and can only cover one perspective, at any one time. At design
conferences, it is common to see attendees sketching or sketchnoting, and sometimes contributing to a visual record in addition to professional outputs [dingwall2018, wallace2017], whilst at computer science conferences, it is common to see attendees using their phones or laptops rather than actively listening or engaging during sessions. There is a value both in the process and resulting output of sketching and sketchnoting, but this value is not being
leveraged by the research community. It is therefore difficult to create conference-wide subjective visual imagery documenting computing events for further research and
dissemination, and additionally, attendees are not aware of the potential cognitive and social benefits of sketching.
To address both the deficit in visual documentary at computer science conferences, and to encourage sketching and active engagement practices within this community, we hosted a workshop and large-scale, ``offline attendee-sourcing'' visual facilitation at a computer science conference. The workshop gave us the opportunity to train participants in the basics of visual facilitation, create visual prompts for the conference to encourage sketching activity and work out a schedule to ensure coverage of all sessions. By collecting visuals from attendees ``offline'' we attempted to level the field for all those attending the conference -- without the need for digital equipment which can sometimes ``get in the way'' of visual thinking [goldschmidt2017]. We also wished to capitalise on the advantages of graphic recording and sketchnoting of events, and without ``missing'' important messages by allocating the task to one or two individuals who may not be familiar with the subject matter.
Finally, we wanted to create sources of engagement for those attending the conference, and for those who [could not] attend: the creation and sketchnoting process engaged those present, and the results of that process enabled those not present to gain insights which would not be explicit from the text proceedings. The creation process has documented benefits for individual well-being [fuller2011], and visual narratives can enhance
understanding [marquardt2012] as well as emulate the discussions that individuals have whilst in attendance at academic events. We were intrigued to see whether a group who did not commonly utilise visual practice -- in this case, computer scientists -- could produce meaningful, insightful visualizations.
[image:2.595.91.505.624.740.2]This paper describes our specific deployment process for traditional visualisation and resulting experiences at a conference on ICT and Sustainability, with our aims being: 1) The facilitation of enhanced engagement and feedback from conference attendees using visual methods; 2) Increasing ``active engagement'' via sketching; 3) The promotion of visual thinking and sketching skills in computer science; and, 4) The subsequent production of alternative ``visual proceedings'' to document the conference and participant interactions, with the intent to publish as a companion publication to the main proceedings.
Related Work:
We examine the intersection between sketched -- hand-drawn -- output and
crowdsourced/attendee-sourced materials. Crowdsourcing is a typically digital construct, but has the potential to be blended with real-world items to create a hybrid practice, such as in ``Attendee-Sourcing'' [bhardwaj2014], using offline methods. In this section we outline the connections and relevant research.
Sketchnotes, Graphic Recording & Visual Facilitation
Sketchnotes and graphic recordings are visual renderings of events, talks, or even thought processes that utilise imagery alongside creatively rendered text to tell a story or provide documentary evidence in a highly accessible manner. Sketchnotes differ from traditional ``text'' notes in that they specifically include related imagery to enhance particular words or concepts alongside the written word, in comparison to text alone. Sketchnoted images can also be used to analyse responses to academic work [fernandez2018], enhance critical thinking and help individuals gain confidence in creating visuals [paepcke2017sketchnoting], provide a method for collaborative ideation [paepcke2017], and assist with visual thinking in across disciplines [dean2013, marquardt2012]. Sketchnotes have also been shown to increase retention and recall due to ``active'' listening [dimeo2016] -- and within this context it could be seen as a positive activity for conference goers in order to increase engagement [sturdee2018blog] (Figure 1). Individuals may also be familiar with the paradigm of visual facilitation from time at school, the whiteboards and blackboards used in teaching to describe and elaborate concepts are both exemplars [gross2015]. Visual facilitation also persists into the workplace, with benefits ranging from increased group cohesion to furthering discursive intercourse [eppler2013]. Although facilitators in this area may sketch to outline concepts, they are also adept at drawing-out thoughts from others, and enabling visual thinking in groups [gross2015]. It should therefore be possible to facilitate image-making from larger gatherings, in the nature of attendee-sourcing.
Attendee-Sourcing / Crowdsourcing Engagement:
In the context of this paper, we situate our method as a form of ``attendee-sourcing'' or ''community-sourcing'' as opposed to crowdsourcing, that is, the large scale collection of items from a conference, in real time, for a specific purpose, similar to methods employed by Bhardwaj et al. [bhardwaj2014] and Kim et al. [kim2013]. This form of sourced material within Human Computer Interaction (HCI) differs from crowdsourcing using technology, which can be loosely defined as the human-based collection and/or analysis of data that would be difficult to generate from small groups, or by using a computer [howe2006]. It can also refer to studies where researchers require a large amount of users for a task [kittur2008], or need to solve large-scale complex scientific problems -- such as with citizen science [simpson2014].
Although crowdsourcing suggests the gathering of a large number of people, most projects rely on distributed individuals, and the information sourced is almost entirely computational -- that is, research does not focus on gathering physical objects in real time. There are bodies of work that do focus on real-time gatherings of individuals however, such as in the conference setting [huron2013bubble, sopan2012], or at other large scale events such as music concerts [frommgen2016]. At conferences, social media can provide a good indication of levels of interest in different topics (e.g. the Twitter ``back-channel'' [mccarthy2005, parra2016]), and also allows for post-hoc analysis of this data [webb2016], although attendees can also be actively [disengaged] whilst working with screen based media, working, or only half-listening during speaker presentations. Huron et al. state that ``the speaker is no longer the only information channel'' [huron2013bubble], and the conference attendees regularly engage in debate between themselves, regarding the topics they have witnessed [sopan2012] -- with researchers actively utilising this resource for analysis.
contribute to on-line visualizations, then it may also be possible to gather visual data in real-time using [off-line] methods.
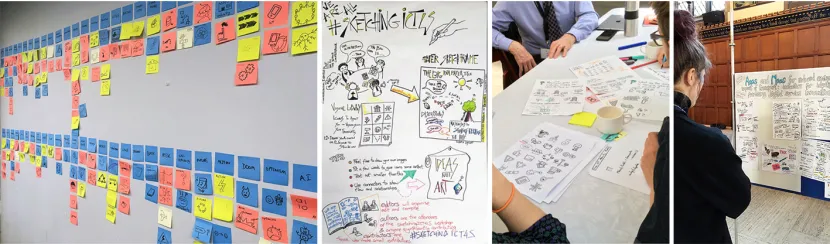
Figure 3: Left: Visual icon library in progress -- concept sketches are posted below the theme; Middle Left: Collaboratively produced instructions for conference attendees displayed at the registration desk; Middle Right:
Participant sketching and icon stickers; Right: An attendee surveys some of the generated sketches
CrowdSourcing & Sketching:
People naturally sketch when trying to explain concepts [roam2013, walny2015]. A related concept that is almost universal in application is the sticky-note, although that has also been digitised to some extent, as researchers attempt to capitalise on the immediacy of the sketched, or noted, concept [morozov2014]. The ability of physical media to build bridges, and gather information still remains however, despite attempts to amalgamate it into the computing world [lewis2014,sturdee2018sketching]. Within HCI, physical sketching maintains its importance via the interest of novice practitioners to learn and engage in what many may assume to be outdated media [lewis2017,lewis2018], and experienced practitioners
interested in sharing opinion [lewis2018sketchi], whilst within the engineering and design disciplines, sketching is enjoying a renaissance [bollini2017,norgaard2017].
Public sketching at conferences is usually the domain of those in employ of the organisers, or with an existing talent or interest in visual communication [wallace2017], although this can be extended via demonstration to more hesitant attendees and novices [dingwall2018].
Research in developmental psychology suggests that all humans have the ability to draw (language and drawing develop along similar pathways in the brain [cohn2012] but we lose the ability through lack of practice or encouragement in our educational institutions. If this is indeed the case, then it should not be difficult for conference attendees to create visuals, albeit in their own style. Crowdsourcing of images has largely been a focus of the humanities --- in particular with museums and galleries --- for the co-creation of exhibits or visual
resources [oomen2011, carletti2013], and those interested in visual media are more likely to participate. However, given the benefits of both crowdsourcing and the creation of visual imagery, we believe that by combining the crowdsourcing of imagery, with novice participants (attendee-sourcing) --- in real time --- we can offer additional opportunities for engagement for those working within HCI and computer science. By borrowing from crowdsourcing, attendee-sourcing [bhardwaj2014], and visual practice, it may be possible to provide cognitive,
research and educational benefits for those working in computing.
Method:
To produce the outcomes described in this paper we worked closely with conference organisers to discuss approaches we could take in producing a visual record of the events. Six months prior to the conference and workshops listed below, we met with the organisers and the decision was taken to provide a service from a professional point of view, which would also encourage and inspire those attending to take part in the co-creation of visual proceedings, but also to enable interested attendees by producing a workshop and running a facilitation service concurrent with the conference/workshop sessions. We remained in close communication with the organisers and volunteers throughout the planning and
implementation stages.
About the Events:
bringing together like-minded researchers, practitioners, industry members, and government members and decision-makers to share recent developments and findings relating to sustainability perspectives on ICT. The ACM equivalent, Limits is a two day workshop and presentation experience aiming to ''foster discussion on the impact of present and future ecological, material, energetic, and societal limits on computing". Focusing on the sustainability of computing is a relatively new area of research, but is quickly establishing itself as one of major importance as the earth's resources are depleted. ICT4S attracted between 150-200 in-person attendees, including presenters, many of which also attended the co-located ACM Limits.
Figure 4: The co-created final visual icon library
Concept:
There are benefits to visual facilitation, graphic recording and sketchnoting for workshops and events as we have outlined in the related work -- however, with larger events it is often not possible to capture the full experience unless the organisers have access to a large team. Often, those employed to visually record events work solo or in a pair, and the costs to employ a larger team can be prohibitive when compared to other vital components of an conference. At the same time, with the intent to reach out to those not attending the event, the organisers were interested in how a visual record of the conference might give additional perspective and feedback after the event. The decision was therefore taken to propose a workshop, during which self-selecting participants could be trained in a basic overview of graphic recording and sketchnoting methods, whilst at the same time working together to develop a method of visual facilitation for the main conference. This facilitation was based in self-recording, but also in encouraging novice-sketchers in attendance to take part and improve their visual note-taking, with the ultimate goal of creating an alternative --- visual --- conference proceedings, increasing engagement, and up-skilling for attendees.
Workshop:
A workshop proposal was sent to the conference and was accepted in December 2017, to be run during the sessions prior to the main conference. The workshop was advertised to prospective attendees, and asked them to be part of the organisation and creation of an alternative, sketched, visual conference proceedings. Twelve people signed up to take part in the workshop, which focused around empowerment in sketching and sharing best practice for visual recording; the creation of a visual icon library (icons which represent images relating to key concepts in computing and sustainability – original concept by Makayla Lewis, utilised later in research outputs [lewis2014]) to facilitate novice sketchers to copy or use this imagery in their recordings; the co-creation of headings and titles for all components of the conference (e.g. keynotes, panels, paper presentations and discussions); and a ``call-to-arms'' for
Visual Icon Library:
Prior to the main conference, during the workshop, we created a visual icon library as a visual tool and prompt for conference attentdees (Figure 4). The visual icon library methodology was personally designed and developed by Makayla Lewis, and later utilised in research in Lewis & Coles-Kemp's Tactile Visual Library [lewis2014] as well as in subsequent courses
[lewis2018, lewis2019]. The technique involves the co-creation of icons relating to a specific topic or theme (in this case, sustainability in computing), which are first generated collectively by the group in text form. These words or phrases are then cut down to represent a set of core concepts which are then written onto post-it notes and placed along a wall in a line. The next phase asks participating individuals to sketch an image (without words) for each word or phrase that they think best represents that concept. Ideally, each participant will generate one image for each concept, although this is not always possible with given time constraints. At the end of a set period, all participants then vote on their favourite image for each concept -- this is usually anonymous, but in this particular case a group discussion was held for each icon, and where no clear favourite emerged, a new image would be developed
collaboratively. The final step involves the icons being redrawn in the same style, and then vectorised for printing. In order to facilitate ease of use in the conference context, these were then printed as sets onto sticky-back gloss paper, so that they could be cut out and placed into visualizations without the need for glue.
Facilitation:
During the opening address, the main conference facilitator introduced the concept of the alternative proceedings, and sketching as a method of recording attendee reactions to the conference. Pens, paper and stickers (produced using the visual icon library -- Figures 3 & 4)) were made available to all attendees and they were invited to create visual responses to any or all aspects of the conference. The main conference facilitator reminded participants at the beginning of each session to continue to take part. During breaks, participants brought their images to a series of Velcro poster boards to be displayed during the conference (Figures 2 & 3), or left their images on the tables to be collected by the workshop organisers during the breakout sessions. Visual facilitation was on hand during all the main conference hours to prepare materials on tables, assist in sketching the event, collect and post images and encourage ongoing participation in small groups or on a one-to-one basis.
Reflections & Observations:
Following our experiences in running this large-scale visual facilitation, we make the following observations about our experiences engaging with researchers and practitioners in computer science by ``offline attendee-sourcing'' sketchnotes in a group setting. Due to the ``open'' nature of the conference and sketching experience, external validity is hard to scale, however these observations may be of use to those interested in the detail of the method, as they contributed to the success of our event.
Planning:
This large-scale form of facilitation required long-term, advance planning. Conference
organisers approached the facilitation team in advance (over 6 months in advance) in order to create seamless process in keeping with the conference aims. The workshop was free to attend, as this is where the volunteering of ``supporters'' occurred, and would not have had the same impact were ``volunteers'' required to pay.
Social Protocol: As also suggested by Huron et al.'s work with Polemic Tweets [huron2012], developing a social protocol was an essential part of the process. For the purposes of our work, it was based in: Instruction -- Using posters and word of mouth to spread details about the event, with additional announcements by organisers at the beginning of each session; During Event Sessions -- Encouragement and gathering of finished materials, presentation of materials on boards to facilitate discussion between presenters and attendees, and to create points of visual interest during breaks; After Event -- Materials gathered, photographed and scanned for inclusion in visual proceedings, feedback from general attendees and
participating parties gathered.
``honest'' responses which could not later be erased. Tables were available to assist with drawing on a horizontal surface [rogers2004].
Facilitation: The role of the facilitators in this context was to manage and display the co-created output, lead by example (generating imagery in response to keynotes and selected talks), keep equipment accessible and stocked and encourage participants who were unsure of their abilities. The main facilitator was an existing professional with knowledge of the research area. Extra volunteers worked in a similar way, except they took ownership for facilitation of areas of personal interest. There was at least one facilitator/supporter in each session which ensured blanket coverage for talks.
Display: The display area was consistent during the event which meant that those
participating could view, discuss and add to the visual narrative of the conference. Large, A0 or bigger poster-boards with appropriate fixings were used (e.g. velcro roll, tape). A facilitator or supporter was on hand in between each session to assist with displaying attendee work -- which took the pressure off the participant as it did not require additional requirements on their time.
Attribution: All who produce visuals during the event had the opportunity for their contributions to be acknowledged for the production of visual proceedings. If participants did not wish to be attributed then they did so by ``assent'' i.e. by contributing their images to the boards without adding attribution, they agreed that the images may be used in subsequent publications. Due to this method of data collection, we did not collect demographic data, as this would have added to the attendee ``load'' during the conference, although some participants chose to give specific written feedback about the sketching at the end of the conference via the anonymous general feedback form.
Dissemination: The publication of visual proceedings at an appropriate venue is being
investigated following the event. During the conference, some attendees posted their imagery online via social media, and the conference chairs updated the main conference website with some images. The facilitators encouraged the use of social media to showcase work. We also kept in contact with participant group after the event in order to ensure appropriate attribution (as above) and further engagement.
Results & Experience:
Here, we describe how we organised the process, from the reasoning behind the idea, to the practicalities of coordinating the large-scale effort. We would also like to share findings about what worked to elicit visual materials from novice sketchers, and what did not. We also consider which sessions were the most successful in eliciting visual responses and compare them to the other session types, and [how] participants approach visualization in different ways. The following sections describe our experiences during the course of the conference.
Sketch Coverage:
Due to the intentionally unstructured nature of the sketchnoting, we cannot provide an accurate number for sketches and imagery produced during the event. The participants who chose to deposit and present their work were in a majority, but some preferred to keep their imagery and take it home, or produced sketches in notebooks that did not allow for page removal. The workshop attendees did ensure that every talk was covered by at least one person, and usually more, whereas the keynotes generated between 10-30 images each.
Virtual Benefits: One of the original premises for hosting an ``offline'' attendee-sourced visual methodology was to create materials which could be used to inform and inspire those who were interested in the conference, but were unable to attend. By creating a visual
proceedings, to supplement the standard written proceedings, there are additional dimensions to engagement beyond the event, for example: the thoughts and opinions of those in attendance, and easy-to-digest summaries of the multi-track talks and discussions. Those taking part in the sketching event were also encouraged to share their images on social media, and this added to the on-line presence of the conference.
Snowball Effect: The initial keynote and subsequent presentation sessions did not result in very many sketched contributions from novice attendees, however, there was a marked increase in contributions as the conference progressed. For example, most of the images from the first keynote and presentation round were from the seed workshop participants. In contrast, the keynote from the second morning produced an overwhelming response, with many attendees who were reluctant to sketch on the first day becoming inspired by the context and topic of the keynote speaker and producing a variety of visual responses. This ``snowballing'' can be attributed to the availability and public presentation of examples from the first morning, which gave public examples of approach and context, in combination with encouragement from facilitators and also could be attributed to a form of [social contagion] [christakis2013], e.g. attendees were more likely to sketch when they saw their peers do so.
Deposition: Attendees were invited to either bring their items to the poster boards so that the facilitators could post them or they could attach them personally, they could leave their images on the tables in the main conference room if they wished for the images to be collected, or they could draw directly onto sheets provided on the boards. The majority of those participating chose to bring their images in person, with a small number leaving their images on the conference tables. No participants chose to draw directly onto the boards: this both allowed for self-censorship if individuals were uncomfortable with sharing their initial sketches; and also might relate to the difference between working on horizontal and vertical displays [rogers2004] -- it is much easier and more comfortable to draw on tables than vertical boards. Finally, those participating preferred to attach their images into blank areas in the designated space for each talk/panel, rather than encroach into the space already started by those perceived as ``experts'', the reasoning being that they did not wish to ``spoil'' the work, or they did not want comparisons in technique or skill to be made.
variable level of engagement which depended on the presence of a volunteer facilitator, the level of participation of the author involved, and the popularity of the session -- although facilitators endeavoured to ensure that all paper presentations had at least minimal representation. Higher sketching engagement occurred when the volunteer facilitators, or presenting authors, sketched the paper presentation. Presentations with more attendees also generated more images, due to the level of coverage.
The least engagement occurred during the poster session, which could be attributed to a number of reasons: 1) Posters are already a visual format, so do not obviously require a further visual response; and, 2) The posters session was co-located with the opening reception for the conference -- this social/standing format meant that attendees did not have tables, materials or free hands available to create sketches. The subject matter of the presentation or talk also had a bearing on the level of engagement. Subjects which elicited greater levels of ''passion", i.e. those which encompass broad world-views or upsetting, topical issues appeared to inspire more attendees to start sketching. The knock-on effect of this is that if they were inspired to sketch by a particular topic, they were then more likely to continue to engage visually during the remainder of the conference. This was evidenced by conversations with these particular attendees, and by identifying their particular style on boards throughout the conference.
Finally, facilitation was essential for engagement --- despite the assistance from the workshop attendees --- hosting the workshop itself, alongside the organisation of the visual
proceedings, and the concurrent gathering, posting and sketching of images required a full-time facilitator role. In turn, the presence of the main conference facilitator, which confirmed and emphasised the organisational support for the event, provided an introductory reminder at the beginning of each session which led to great engagement.
Taking Ownership: Where the authors of paper presentations at the conference were actively engaged with the sketching activities, we observed a practice of ``taking ownership'' of the materials produced in that session. This consisted of presenters actively creating materials to post on their allocated section of the poster boards, and actively encouraging those attending to do the same. Those who did so, generated more sketched responses (not including their own) than the sessions which did not have an engaged presenter.
Concentration: Feedback from participants on sketching as a concurrent activity to listening varied. Some approached the facilitators to say that they wanted to take part, but found that sketching ``got in the way'' of listening, and they felt they missed vital components of the talks whilst drawing a previous sentiment. Conversely, others mentioned that they found it helped with paying attention to what was being said, and appreciated then being able to remember and reference key points at a later time. As the majority of conference attendees did not often draw, it is possible that those also struggling with learning a new skill found the dual attention difficult, although it could have its roots in deeper psychological processes, for example, the apparent dichotomy between ``visual'' versus ``concept'' thinking [otis2016].
Facilitation: Depending on the format of the conference talks and events, different forms of facilitation were required. Practically, at the start of the day, and during breaks, it was
necessary to stock/restock the tables and equipment stations with visual icon library stickers, paper, and stationery. From a human perspective, continuing top-level announcements from the conference organisers and encouragement on a group and one-to-one basis were
essential to keep up motivation and give feedback where asked. The facilitation required for a hands-on attendee-sourcing event differ from screen based submission due to the increased workload for attendees, although the benefits for engagement are that the resulting images and text are displayed in a permanent installation for the duration of the conference -- and this perpetuates further engagement.
to be ``colouring in'' the icons in moments of downtime, or when listening to speakers, to keep themselves occupied. These coloured icons were then also sometimes subsequently used by the same individual or others as part of another image. Many of those who actively
participated in the sketching activities did not use the icons however, instead preferring their own approach. Interestingly, the icon library was utilised post-conference by researchers, with students or in workshops, with one example being an exercise to ``test'' the icons message by reverse-engineering their meaning.
[image:10.595.95.503.266.738.2]Non-Public Participatory Engagement: A final item of note was that some attendees actively engaged in the sketching activity, but instead preferred to draw in their own notebooks, or created images on the materials provided, but took them away after each sessions. When asked, one participant said that they liked the idea but also wanted to be able to refer back to the images to aid memory, or for future research. Others were shy about sharing, and enjoyed the activity but did not want to be judged on ``bad drawings'', regardless of the encouragement given. No record was taken of these private images, so we cannot analyse them for content.
Discussion:
The attendee-sourcing of sketched visualizations had benefits for organisers and facilitators, but also conference attendees. From the perspective of organisation, the sketched imagery and presentation throughout the conference added interest and value to the schedule, and can be utilised to further the message of the conference and its research after the event. For the facilitators, comparing the process of running large scale events with novices, in
comparison to previous work working with smaller teams, offers insights on the scalability of such work. Those facilitating also received positive feedback on the process from those participating, and those simply viewing the unfolding events and enjoying the visualization boards. The most inspiring evidence of benefit is from the participants however: for example, one attendee sketched a small character on a post-it note on the first day, but was bringing four pages of sketches to the visualization boards on the last day. Another stated, after looking at their first image and the last ones ``If I compare that to the next ones I think I really learned something :-)''. There were also lasting benefits after the event, with subsequent feedback stating ``Not only I enjoyed sketching but I have been occasionally sketching other talks since then''. These positive responses to the co-creation process match to some extent those found by Füller et al. in examining crowdsourced artwork for on-line competitions or citizen science [fuller2011], however, our process had the additional benefit of encouraging, teaching and enabling novices to embrace creative sketching.
Digital vs Analogue:
The benefits of off-line attendee-sourcing discussed here evidence a divide between digital versus analogue attendee and crowdsourcing that has not yet been examined. When submitting to a digital repository, creators receive no immediate feedback, cannot see items that others are uploading, and are not learning during the process. A hands-on, physical process and repository is open to these things, though the resources needed to maintain and publish the visualizations are far higher than the digital equivalent. In order to reap the benefits of both types of process, we propose running a similar event with an additional social media or digitization option for those who wish it, in order to retain the gains of the human interaction during creation, but capitalizing on the additional reach and immediacy for non-attendees that traditional conference ``back-channels'' create [parra2016]. We did not ask those participating to ``Tweet'' their images after completion as that would have increased the workload, and not all participants use that media -- however, Tweeting the imagery would have added value to the conversational and informational aspects of the conference.
To get around the issue of propriety technology, the facilitation could offer the service of photographing and adding the images to the digital repository at the same time as placing the visualizations on the display boards. It is worth considering retaining the analogue display method during the conference however, as technology has a fallibility that physical objects do not, witness the failure of airport digital departure boards in peak holiday season
[burg2018]. There are negatives in the process though -- one drawback of the attendee-sourcing of physical media is that it may only scalable to a certain extent -- in small to
medium size events (up to 250 people) it is possible to manage the demands of the individual and deal with the influx of submissions. The activity of sketching is also high effort, in
comparison to crowdsourcing events such as Polemic Tweet [huron2012]. To scale the practice up further, to a conference the size of ACM CHI or even ACM SIGGRAPH would require an approach that leans back toward the digital method, is widely advertised, and relies on self-motivating participation. Despite the challenge, however, facilitating the creation and dissemination of physical visualizations at a large scale event would be an interesting extension of this work: working in other domains would make it possible to establish upper and lower limits for this type of visual facilitation.
Why Creative Practice Matters in Computer Science:
[lewis2017, lewis2018sketchi] year on year. Despite attempts to generate a similar sketching experience using digital platforms [braga2012, souleles2015, souleles2017], there is currently no exact replacement for the pen and paper method. So if sketching is such a valuable skill, why is it not utilised more widely in other applications of computer science?
The reasons could vary: the ``traditional'' view of computing is biased toward the coding paradigm -- HCI courses are often optional in our educational structure, or misunderstood by students who believe that coding is the only route to success in the field. There is also an issue with embracing interdisciplinary work in established STEM fields -- although this is beginning to change. Sketching, and other creative methods (e.g. reflective practice, journaling or writing, brainstorming, acting, playful interaction) have benefits for cognition, mental health, collaboration and, ultimately, produce insightful and beneficial outcomes [dourish2004]. Our application of sketching with a novice audience of computer scientists shows that these creative interventions may make a difference on a personal and social level, and are worth pursuing.
Future Work:
In addition to the suggestions already made, we propose a subsequent analysis of the visualizations generated by the attendees of the events described here. For example, given the backgrounds of those attending the conference (in sustainability and computing) we can attempt to analyse how this group sketches concepts relating to computer science (e.g. Fernandez et al. [fernandez2018]), whether there are common methodologies in
representation, and to establish themes such as use of emotional responses or questioning statements -- the possible differences between reflective and reactive practice in sketching. A further comparison could be made to the visualizations created by professionals, to establish if novices approach content generation in different ways. Finally, we aim to publish the visualizations, alongside photographs from the event as an ``alternative proceedings'' to complement and enhance the published work, and offer others the chance to experience the sketching practices of our participants in computing.
Conclusion:
Visual practice has cognitive, societal and mindful benefits, and its results can be used to discuss and disseminate research. By co-creating visuals with non-expert groups, we can leverage the benefits of the creative process in non-design disciplines. We have shown here, how an ``off-line attendee-sourcing'' approach to generating hand-drawn imagery at a conference was used for the benefit of attending individuals and for the development of alternative dialogues and publications. This work has implications for the promotion of creative visual practice in computer science, and the possibility of further investigation into hybridised forms of attendee-sourcing, and further facilitation events.
Acknowledgements:
We would like to thank the attendees of ICT4S and ACM Limits 2018. In particular, the following individuals made this work possible through volunteering their time and sketches: Marie Angela Ferrario, Birgit Penzenstadler, Peter Woodward, Steve Easterbrook, Jari Porras, Eva Kern, Levon Amatuni, Andreas Fritsch, Liridona Sopjani, Ole Schultz, Sergio Espana, and Tina Ringenson. This research was supported in part by NSERC, AITF, and SMART Technologies, Canada.
References:
[1] Anant Bhardwaj, Juho Kim, Steven Dow, David Karger, Sam Madden, Rob Miller, and Haoqi Zhang. 2014. Attendee-sourcing: Exploring the design space of community-informed conference scheduling. In Second AAAI conference on human computation and
Crowdsourcing
[3] R Borgo, L Micallef, B Bach, F McGee, and B Lee. 2018. Information Visualization Evaluation Using
Crowdsourcing. Computer Graphics Forum 37, 3 (2018), 573–595. DOI:http://dx.doi.org/10.1111/cgf.13444
[4] Adam Bradley, Cayley MacArthur, Mark Hancock, and Sheelagh Carpendale. 2015. Gendered or neutral?: considering the language of HCI. Proceedings of the 41st Graphics Interface Conference (2015), 163–170.
[5] Ugo Braga Sangiorgi, Vivian Genaro Motti, François Beuvens, and Jean Vanderdonckt. 2012. Assessing lag perception in electronic sketching. Proceedings of the 7th Nordic Conference on Human-Computer Interaction: Making Sense Through Design (2012), 153–161. DOI: http://dx.doi.org/10.1145/2399016.2399040
[6] Laura Carletti, Gabriella Giannachi, Dominic Price, Derek McAuley, and Steve Benford. 2013. Digital humanities and crowdsourcing: An exploration. Museums and the Web (2013).
[7] Nicholas A Christakis and James H Fowler. 2013. Social contagion theory: examining dynamic social networks and human behavior. Statistics in medicine 32, 4 (2013), 556–577. DOI:http://dx.doi.org/10.1002/sim.5408
[8] Neil Cohn. 2012. Explaining ‘I canâ˘A ´ Zt draw’: Parallels between the structure and development of language and drawing. Human Development 55, 4 (2012), 167–192. DOI:http://dx.doi.org/10.1159/000341842
[9] Jara Dean-Coffey. 2013. Graphic recording. New Directions for Evaluation 2013, 140 (2013), 47–67. DOI: http://dx.doi.org/doi.org/10.1002/ev.20073
[10] Robert Dimeo. 2016. Sketchnoting: an analog skill in the digital age. ACM SIGCAS Computers and Society 46, 3 (2016), 9–16. DOI:
http://dx.doi.org/10.1145/3024949.3024951
[11] Harvey Dingwall. 2018. Tessolated discussions: Graphic recording and dialogic drawing. Web image. (24 March 2018). Retrieved Aug 15, 2018 from
https://www.researchthroughdesign.org/wp-content/ uploads/2017/07/Documentation-Wall-RTD-2017-c.jpg
[12] Paul Dourish, Janet Finlay, Phoebe Sengers, and Peter Wright. 2004. Reflective HCI: Towards a critical
technical practice. In CHI’04 extended abstracts on Human factors in computing systems . ACM, 1727–1728. DOI:http://dx.doi.org/10.1145/985921.986203
[13] Martin J Eppler, Heidi Forbes Oste, and Sabrina Bresciani. 2013. An experimental evaluation on the impact of visual facilitation modes on idea generation in teams. Information Visualisation (IV), 2013 17th International Conference (2013), 339–344. DOI: http://dx.doi.org/10.1109/IV.2013.43
[14] Almudena Fernández-Fontecha, Kay L Oâ˘A ´ Zhalloran, Sabine Tan, and Peter Wignell. 2018. A multimodal
approach to visual thinking: the scientific sketchnote. Visual Communication (2018), 1470357218759808. DOI:http://dx.doi.org/10.1177/1470357218759808
You Can’t Draw): Hands-on Sketching Course. In Proceedings of the 33rd Annual ACM Conference Extended Abstracts on Human Factors in Computing Systems . ACM, 2467–2468. DOI:
http://dx.doi.org/10.1145/2702613.2706665
[16] Alexander Frömmgen, Jens Heuschkel, Patrick Jahnke, Fabio Cuozzo, Immanuel Schweizer, Patrick Eugster, Max Mühlh.user, and Alejandro Buchmann. 2016. Crowdsourcing measurements of mobile network performance and mobility during a large scale event. In International Conference on Passive and Active Network Measurement . Springer, 70–82. DOI:
http://dx.doi.org/10.1007/978-3-319-30505-9_6
[17] Johann Füller, Katja Hutter, and Rita Faullant. 2011. Why co-creation experience matters? Creative
experience and its impact on the quantity and quality of creative contributions. R&D Management 41, 3 (2011), 259–273. DOI:
http://dx.doi.org/10.1111/j.1467-9310.2011.00640.x
[18] Gabriela Goldschmidt. 2017. Manual Sketching: Why Is It Still Relevant? In The Active Image . Springer, 77–97. DOI:http://dx.doi.org/10.1007/978-3-319-56466-1_4
[19] Stefan Gross. 2015. Visual Interventions: The Power of the Pen for Effective Communication. Journal of
Education and Research 5, 1 (2015), 69–81.
[20] Jeff Howe. 2006. The rise of crowdsourcing. Wired magazine 14, 6 (2006), 1–4.
[21] Samuel Huron and Jean-Daniel Fekete. 2012. User-supplied sentiments in tweets. In IEEE Conference on Information Visualization (INFOVIS): 2nd Workshop on Interactive Visual Text Analysis .
[22] Samuel Huron, Romain Vuillemot, and Jean-Daniel Fekete. 2013. Bubble-TV: Live visual feedback for social tv broadcast. In ACM CHI 2013 Workshop: Exploring and enhancing the user experience for television .
[23] Juho Kim, Haoqi Zhang, Paul André, Lydia B Chilton, Wendy Mackay, Michel Beaudouin-Lafon, Robert C Miller, and Steven P Dow. 2013. Cobi: A
community-informed conference scheduling tool. In Proceedings of the 26th annual ACM symposium on User interface software and technology . ACM, 173–182. DOI:http://dx.doi.org/10.1145/2501988.2502034
[24] Aniket Kittur, Ed H Chi, and Bongwon Suh. 2008. Crowdsourcing user studies with Mechanical Turk. In Proceedings of the SIGCHI conference on human factors in computing systems . ACM, 453–456. DOI: http://dx.doi.org/10.1145/1357054.1357127
[25] Makayla Lewis and Lizzie Coles-Kemp. 2014. A Tactile Visual Library To Support User Experience Storytelling. DS 81: Proceedings of NordDesign 2014, Espoo, Finland 27-29th August 2014 (2014), 386–395.
Companion Publication on Designing Interactive Systems . ACM, 356–359. DOI:
http://dx.doi.org/10.1145/3064857.3064863
[27] Makayla Lewis, Miriam Sturdee, and Nicolai Marquardt. 2018a. Applied Sketching in HCI: Hands-on Course of Sketching Techniques. In Extended Abstracts of the 2018 CHI Conference on Human Factors in Computing Systems . ACM, C08. DOI:
http://dx.doi.org/10.1145/3170427.3170649
[28] Makayla Lewis, Miriam Sturdee, Nicolai Marquardt, and Thuong Hoang. 2018b. SketCHI: Hands-On Special Interest Group on Sketching in HCI. In Extended Abstracts of the 2018 CHI Conference on Human Factors in Computing Systems . ACM, SIG09. DOI: http://dx.doi.org/10.1145/3170427.3185366
[29] Nicolai Marquardt. 2017. Sketching user experiences: Hands-on course of sketching techniques for HCI
research. In Proceedings of the 2017 CHI Conference Extended Abstracts on Human Factors in Computing Systems . ACM, 1261–1263. DOI:
http://dx.doi.org/10.1145/3027063.3027107
[30] Nicolai Marquardt and Saul Greenberg. 2012. Sketchnotes for Visual Thinking in HCI. In ACM conference on Human Factors in Computing Systems: CHI Workshop on Visual Thinking and Digital Imagery .
[31] Nicolai Marquardt and Saul Greenberg. 2015. Sketching User Experiences: The Hands-on Course. In
Proceedings of the 33rd Annual ACM Conference Extended Abstracts on Human Factors in Computing Systems . ACM, 2479–2480. DOI:
http://dx.doi.org/10.1145/2702613.2706688
[32] Joseph F McCarthy and others. 2005. Digital backchannels in shared physical spaces: experiences at an academic conference. In CHI’05 extended abstracts on Human factors in computing systems . ACM, 1641–1644. DOI:
http://dx.doi.org/10.1145/1056808.1056986
[33] Penelope Mendonça. 2016. Graphic facilitation, sketchnoting, journalism and ‘The Doodle Revolution’: New dimensions in comics scholarship. Studies in Comics 7, 1 (2016), 127–152. DOI:
http://dx.doi.org/10.1386/stic.7.1.127_1
[34] Mikhail Morozov, Andrey Smorkalov, and Mikhail Fominykh. 2014. Sticky Notes–A Tool for Supporting Collaborative Activities in a 3D Virtual World. In
Advanced Learning Technologies (ICALT), 2014, IEEE . IEEE, 683–687. DOI:
http://dx.doi.org/10.1109/ICALT.2014.200
[35] Mie Nørgaard. 2017. Can you picture this? Instructions for using sketchnotes to help novices improve their
design sketching skills. (2017).
[36] Johan Oomen and Lora Aroyo. 2011. Crowdsourcing in the cultural heritage domain: opportunities and
challenges. In Proceedings of the 5th International Conference on Communities and Technologies . ACM, 138–149. DOI:
[37] Laura Otis. 2016. A New Look at Visual Thinking. Web article. (16 February 2016). Retrieved Aug 17, 2018 from http://www.psychologytoday.com/us/blog/ rethinking-thought/201602/new-look-visual-thinking .
[38] Verena Paepcke-Hjeltness and Kevin Henry. 2017. Developing Your Visual Voice: Changing the Paradigm of Communication in Team Settings. (2017).
[39] Verena Paepcke-Hjeltness, Mani Mina, and Aziza Cyamani. 2017. Sketchnoting: A new approach to developing visual communication ability, improving critical thinking and creative confidence for engineering and design students. In Frontiers in Education
Conference (FIE) . IEEE, 1–5. DOI: http://dx.doi.org/10.1109/FIE.2017.8190659
[40] Denis Parra, Christoph Trattner, Diego Gómez, Matías Hurtado, Xidao Wen, and Yu-Ru Lin. 2016. Twitter in academic events: a study of temporal usage,
communication, sentimental and topical patterns in 16 computer science conferences. Computer
Communications 73 (2016), 301–314. DOI: http://dx.doi.org/10.1016/j.comcom.2015.07.001
[41] Majken K Rasmussen, Giovanni M Troiano, Marianne G Petersen, Jakob G Simonsen, and Kasper Hornbæk. 2016. Sketching Shape-changing Interfaces: Exploring Vocabulary, Metaphors Use, and Affordances. In Proceedings of the 2016 CHI Conference on Human Factors in Computing Systems . ACM, 2740–2751. DOI: http://dx.doi.org/10.1145/2858036.2858183
[42] Dan Roam. 2013. The back of the napkin: Solving problems and selling ideas with pictures . Portfolio. [43] Yvonne Rogers and Siân Lindley. 2004. Collaborating around vertical and horizontal large interactive displays: which way is best? Interacting with Computers 16, 6 (2004), 1133–1152. DOI:
http://dx.doi.org/10.1016/j.intcom.2004.07.008
[44] Robert Simpson, Kevin R Page, and David De Roure. 2014. Zooniverse: observing the world’s largest citizen science platform. In Proceedings of the 23rd
international conference on world wide web . ACM, 1049–1054. DOI:
http://dx.doi.org/10.1145/2567948.2579215
[45] Awalin Sopan, PJ Rey, Brian Butler, and Ben Shneiderman. 2012. Monitoring academic conferences: Real-time visualization and retrospective analysis of backchannel conversations. In Social Informatics (SocialInformatics), 2012 International Conference on . IEEE, 62–69. DOI:
http://dx.doi.org/10.1109/SocialInformatics.2012.20
[46] Nicos Souleles. 2017. iPad versus traditional tools in art and design: A complementary association. British
Journal of Educational Technology 48, 2 (2017), 586–597. DOI:http://dx.doi.org/10.1111/bjet.12446
http://dx.doi.org/10.1111/bjet.12132
[48] Miriam Sturdee, Paul Coulton, and Jason Alexander. 2017. Using Design Fiction to Inform Shape-Changing Interface Design and Use. The Design Journal 20, sup1 (2017), S4146–S4157. DOI:
http://dx.doi.org/10.1080/14606925.2017.1352913
[49] Miriam Sturdee, John Hardy, Nick Dunn, and Jason Alexander. 2015. A public ideation of shape-changing applications. In Proceedings of the 2015 International Conference on Interactive Tabletops & Surfaces . ACM, 219–228. DOI:
http://dx.doi.org/10.1145/2817721.2817734
[50] Miriam Sturdee, Makayla Lewis, and Nicolai Marquardt. 2018. SketchBlog 1: The rise and rise of the sketchnote. Web article. (15 August 2018). Retrieved Aug 17, 2018 from http://interactions.acm.org/blog/view/
sketchblog-1-the-rise-and-rise-of-the-sketchnote .
[51] Miriam Amber Sturdee. 2018. Sketching as a support mechanism for the design and development of
shape-changing interfaces . Ph.D. Dissertation. Lancaster University.
[52] Lingyun Sun, Wei Xiang, Shi Chen, and Zhiyuan Yang. 2015. Collaborative sketching in crowdsourcing design: a new method for idea generation. International Journal of Technology and Design Education 25, 3 (2015), 409–427. DOI:
http://dx.doi.org/10.1007/s10798-014-9283-y
[53] Edmund von der Burg. 2018. Gatwick flight information screens fail. Web article. (20 August 2018). Retrieved Aug 20, 2018 from
http://www.bbc.co.uk/news/uk-england-sussex-45247499 .
[54] Jayne Wallace, Jon Rogers, Joanna Foster, Sean Kingsley, Nantia Koulidou, Erika Shorter, Mike Shorter, and Natasha Trotman. 2017. Scribing as Seen from the Inside: The Ethos of the Studio. Design Issues 33, 3 (2017), 93–103. DOI:
http://dx.doi.org/10.1162/DESI_a_00454
[55] Jagoda Walny, Sheelagh Carpendale, Nathalie Henry Riche, Gina Venolia, and Philip Fawcett. 2011. Visual thinking in action: Visualizations as used on
whiteboards. IEEE Transactions on Visualization and Computer Graphics 17, 12 (2011), 2508–2517. DOI: http://dx.doi.org/10.1109/TVCG.2011.251
[56] Jagoda Walny, Samuel Huron, and Sheelagh Carpendale. 2015. An exploratory study of data sketching for visual
representation. In Computer Graphics Forum , Vol. 34. Wiley Online Library, 231–240. DOI:
http://dx.doi.org/10.1111/cgf.12635
[57] Stephen Webb. 2016. Twitter use in physics conferences. Scientometrics 108, 3 (2016), 1267–1286. DOI: