Design of a Real Time Wireless Data Acquisition System
for Control Purposes
Layal Esmaeel
Department of Technical Engineering, Tartus UniversityTartus, Syria
Their Ibrahim,
PhD Department of Technical Engineering, Tartus UniversityTartus, Syria
ABSTRACT
This paper proposes a wireless model for real-time data acquisition using Arduino and LabView. It produces a study on how to use Xbee modules for wireless communication in both, Transparent mode and API mode (Zigbee), and compare them using X-CTU software. As a practical application of the proposed system, the temperature of a water tank is acquired. Then, it is transmitted wirelessly through Xbee modules using Zigbee protocol to a monitoring and control interface designed using LabView, where the measured values are displayed through a chart and saved electronically in an Excel file. Then, the control signals from a PID controller (designed in LabVIEW) are transmitted to an operating system represented by a relay, where the water is heated according to the desired setting value. Practical test results show the good efficiency of the designed system and its ability to acquire data wirelessly in real-time with a range of up to 1200m.
Keywords
LabView, Arduino, Xbee, X-CTU, PID.
1.
INTRODUCTION
Data acquisition is a process of measuring a physical or electrical phenomenon such as voltage, temperature, pressure and sound which requires a particular form of monitoring. These signals represent the state of the physical process and must be collected, analyzed and processed to generate other signals to control external equipment or connect with other systems [1]. A computer-based data acquisition system consists of a combination of hardware and software to obtain represent and store measurements according to requirements [2].
Recently, LabView has become increasingly important in industrial applications particularly in control applications. It provides a graphical programming environment that is easy to handle and allows system simulation in real-time through data collection models [3]. On the other hand, Arduino has become one of the most popular electronic controllers because it is open source and affordable compared to other controllers (such as PLC) [4]. In addition to the increasing use of wireless communication technologies and wireless sensor networks (WSN) in control systems and data collection. Due to its flexibility and ease of setting up rather than wired systems. Wired systems impose restrictions due to conduction and energy consumption. These restrictions increase the cost of data collection system and limit the number and location of sensors that can be used [5]. Therefore, in this research, a wireless data acquisition system has been designed using the Zigbee protocol, which is distinguished from other available wireless technologies like Wi-Fi and Bluetooth, by low energy consumption and low data transfer rate. That makes it an ideal solution for data transferring in industrial systems
which are often measurements of sensors. So these systems do not require a high data rate, but low energy consumption and adequate coverage [6]. Based on the fact that most modern control systems require that the system is able to display data collected in real-time as well as store it in an appropriate electronic format (Documentation) to analyze and draw conclusions from it [7]. So this research provides a model for a low-cost wireless data collection system geared for control purposes.
2.
REVIEW OF RELATED WORKS
This section presents some related works:
In [8] a compact system with small dimensions was designed to collect data and wirelessly control devices located in remote locations that are difficult for the user to go to obtain data. Data collected by a sensor is sent to a PC continuously every minute and the user can control DC Motor speed using a wireless RF connection. It was found that wireless technology eliminates the possibility of electrical noise, but it is limited in bandwidth and coverage. The researchers also pointed out the possibility of using other wireless communication technologies like IR and Bluetooth.
In [9] LabView was used to design a system that monitors and controls hall parameters (meetings or lectures) such as temperature and CO2 ratio. The ELVIS group creates a connection between sensors and sends the information collected to LabView.The system has been effective and able to operate in real-time, with the possibility of easily modifying its software according to the processes required. In [10] the factory temperature control system was designed manually and automatically. The value of the factory temperature is read by the LM35 sensor and then the analog input is converted to digital value using the Arduino controller. The LabView environment has been used to display and storage operations. The researcher pointed to the existence of other software to design the control system, but LabView is the simplest. Also, the researcher recommended the addition of other equipment and an advanced sensor module and testing it to replace the analog method of data collection.
3.
IMPORTANCE AND OBJECTIVES
OF THE RESEARCH
to obtain radio signals and use LabView software to give control commands and display data.
The aim of the research is to design a low-cost water tank temperature control system that meets the following specifications:
Suitable for educational purposes.
Suitable for industrial Control applications (reverse-feed) where it can be generalized to control the temperature of any other application.
Based on open source components and software. Data collection wirelessly.
Monitor data and save it using the Labview environment.
The possibility of expansion (Hardware and Software).
4.
SYSTEM DESIGN
4.1
Selection of system elements
The following are the physical components that have been chosen to design the proposed system with specifications:
Temperature Sensor:
[image:2.595.321.537.71.215.2]The DHT22 sensor has been chosen as an accurate temperature sensor, whose measurement range extends from to , with accuracy , with an operating voltage (3.3V – 6V). The sensor output is a numeric value that does not require any external elements to be connected. It has been chosen because of its high accuracy long life, cheap price and easy connection with the chosen Arduino controller. Figure 1 shows the shape of this sensor.
Fig 1: DHT22 Sensor
The controller:
[image:2.595.319.539.359.502.2]Arduino has been chosen, an open-source electronic platform built using a chip with a microcontroller from ATMEL because it is available at affordable prices and is easy to program. There are different types of Arduino families, and Arduino UNO has been chosen as the cheapest and it meets the needs of this project. Figure 2 shows the Arduino UNO.
Fig 2: Arduino UNO
Wireless communication module:
[image:2.595.56.277.425.558.2]Xbee modules have been chosen because they support the Zigbee protocol and have good compatibility with Arduino [11]. It is a programmable microcontroller designed to establish a radio wireless connection consisting of a small antenna and 20 ports, most of them are digital ports and some are analog requiring a voltage of 3.3V that allows serial communication over distances of 100m to 1500m. There are many types of Xbee families that differ from each other in a number of factors. The S2C Xbee model has been used with a 3mW transmission card, a coverage range of up to 1200m and a data transfer rate of 250Kbps. Figure 3 shows the Xbee S2C module.
Fig 3: Xbee S2C module
Linking the controller with the communication module:
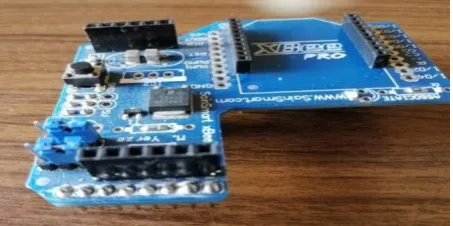
To achieve the connection between Arduino and Xbee S2C the Xbee Shield has been used because it achieves high compatibility. Xbee Shield contains basic protection circuits such as the voltage regulator circuit. It receives the feed and the grounding through the ICSP ports, so Arduino feed and grounding ports remain available for external circuits. This unit connects the Xbee transceivers with the Arduino transceivers respectively, and the Arduino 8-13 digital ports remain available to connect external sensors. Figure 4 shows the Xbee Shield.
[image:2.595.317.544.637.750.2] Linking with PC:
[image:3.595.57.278.186.341.2]In order to connect the computer to the Xbee module, the Xbee Explorer is usually used for the purpose of setting and providing a USB port, and a 3.3V feed voltage. However, due to its high cost, a method has been found to connect Xbee with PC using Arduino by using 'Male to Female' type connections, so that the same result can be obtained at the lowest cost. Here, it should be noted that the empty code should be uploaded to Arduino and then the connection shown in Figure 5 should be made.
Fig 5: The connection method without using Xbee Explorer.
[image:3.595.320.538.357.463.2]The following table shows how to connect the Arduino with the Xbee module.
Table 1: Connecting Arduino with Xbee
Xbee Arduino
Pin10 GND Pin
Pin1 3.3V Pin
Pin2 Tx Pin
Pin3 Rx Pin
Operator Circuit Design:
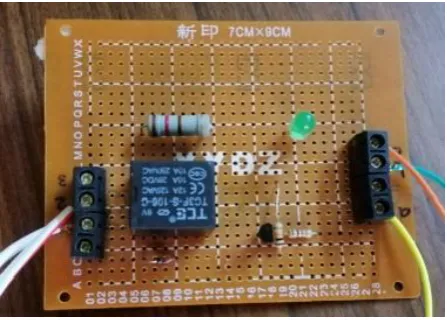
As with most controllers, the Arduino control signal is of low voltage and cannot control high voltage (or high power) equipment, so a circuit must be designed to provide control over high voltage devices. The design of the operator circuit is based on the use of a relay (electromechanical element). Figure 6 shows the designed circuit.
Fig 6: The designed circuit
4.2
Xbee modes
The Xbee module supports several types of data transmission and reception. Two main modes can be distinguished: Transparent and API.
[image:3.595.318.544.547.746.2]Initially, the two Xbee modules were set up and the connection between them was established. One was run as Coordinator and the other as Router, according to the parameters in the following table through the X-CTU software [11].
Table 2: Xbee modules setup parameters
Parameter Coordinator Router
ATID 3332 3332
DH 13A200 13A200
DL 41740EF4 41740FBA
BD 19200 19200
4.2.1 Transparent Mode
The network has been tested in the Transparent Mode. In this mode, the Xbee module passes the information exactly as received. We tested using X-CTU software. Figure 7 shows the application of the test in Transparent Mode.
Fig 7: Connection testing in Transparent Mode
Here a text message was sent from the router to the coordinator, and then a text message was sent from the coordinator to the router. Blue indicates the sent characters and red indicates the received ones. It is possible to exchange data in this mode in both directions in real-time and with good reliability.
[image:3.595.56.280.588.748.2]4.2.2 API Mode
The network is then moved on in API Mode, where the data are transmitted through the serial interface in structured packets in a specific order. In this mode, the Xbee module deals exclusively with frames of data, and this enables to create a complex connection between devices without having to build a special protocol. Each frame of data consists of several fields (each field defining a specific property). There are many types of data frames that differ from each other in the data field components, depending on their function. For example, sending a message will need three types of data frames:
A sender sends a Transmit Request frame that contains the target address and the message, which may be a text message or data from sensors.
The receiver receives a Received Packet window containing the transmitter address and message.
The sender receives the Transmit Status window and this indicates whether the transmission was successful.
[image:4.595.319.540.232.362.2]Here, a test of this mode has been conducted, where a text message was sent from the router to the coordinator with specific characters (Hello) using X-CTU software to verify the above and testing the possibility of making Xbee module in API mode. First, the router has been entered to construct the Transmit Request data frame, define the target address, and include the message to be sent (Hello), and then the frame was sent to the coordinator (see Figure 10).
Fig 10: Test in API Mode
It can be seen that the Received Packet is received in real-time by the coordinator containing the message sent (Hello) and the Transmit Request is received by the router contains a Delivery Status field that includes (success) to inform the router that the transmission has been successful. That ensures reliability in sending and receiving data.
4.2.3 Comparison of the two modes Transparent
and API
Based on the results of the previous tests, it has been found that in both types the data were received in real-time for a network of two nodes, but API mode is more reliable than AT mode. Therefore, it is recommended using it in high-reliability network applications with more than two Xbee nodes because
in this case, it will be the fastest and easiest mode in the application. In AT mode the nodes must be reset every time they are sent to a new target node to define the sending on the new target node’s address, while API mode does not require that. However, if the network is made up of only two nodes and does not require high reliability, the AT mode will be the most suitable for ease of application. For the system proposed in this research, it requires speed and high reliability. Therefore, the API (Zigbee) mode is the most suitable.
5.
BUILDING THE PROPOSED
[image:4.595.56.283.380.611.2]MONITOR AND CONTROL SYSTEM
The following figure, Figure 11, shows the block diagram of the proposed model.Fig 11: Temperature control block diagram
The block diagram shows how the system works to control the temperature of a water tank, where the user determines the desired temperature (Setpoint) through a program performed in the LabView software environment [12], so that the PID controller, programmatically designed within LabView compares the value of the temperature sensed by the temperature sensor, which is collected wirelessly (using Xbee modules), with the desired temperature (Setpoint) and based on the difference between the two temperatures, the controller gives the command to the operator (rely), which runs the heater. The heating device continues to function until the measured heat value is equal to the desired heat value and the controller gives the operator a disconnection command.
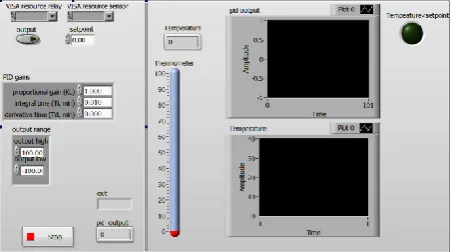
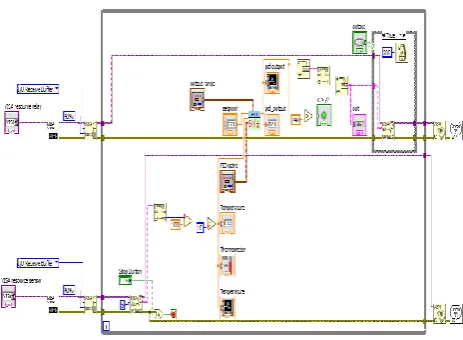
The monitoring interface for the designed control system is built as shown in Figure 14, through which the measured temperature can be read instantaneously. A measured temperature graph is displayed (graph at the bottom and right of the interface) and a PID controller output graph (graph at the top and right of the interface). It can also set the desired temperature value (setpoint) and set the parameters of the PID ( ، ، ) to get the best response. Figure 12 shows the block diagram of the designed interface.
[image:4.595.316.543.626.752.2]Fig 13: Block diagram application in LabView
[image:5.595.317.558.72.233.2]The Arduino controllers have been programmed using Arduino IDE software and linked with the Xbee modules by including the XBee-Arduino library. Figure 14 shows the control system that has been implemented.
Fig 14: The overall system
6.
RESULTS AND DISCUSSION
The system has been operated using API mode, and the parameters of the PID controller have been set with the following values ، ، which have been selected using the experimental method and by selecting the desired temperature at (setpoint = 40). The system has been shown to work well. It collects the temperature wirelessly in real-time and has a coverage range of up to 1200m. Figures (15a, 15b) show the system response when the temperature is below the desired set value where the relay is in the ON state to provide the energy needed to heat the water.
[image:5.595.316.556.262.457.2]Fig 15a: System response when the temperature is below the setpoint
Fig 15b: System response when temperature is below the setpoint
Figures (16a, 16b) show the system response when the measured temperature is higher than the desired setting value and here the relay switches to OFF to stop heating.
[image:5.595.55.282.304.538.2]Fig 16b: System response when the temperature is above the setpoint
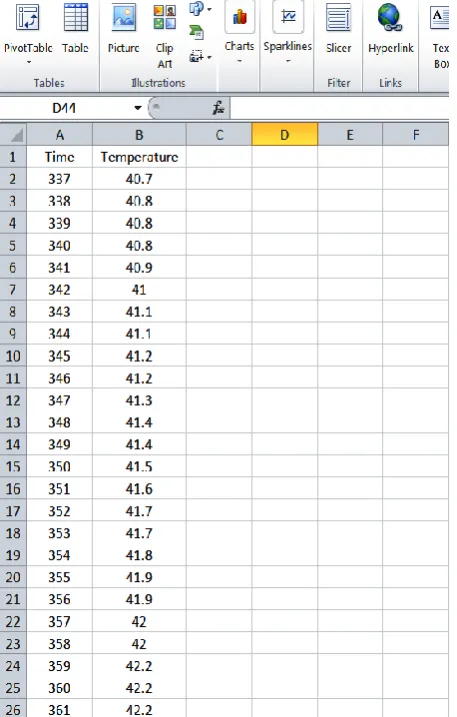
Also, the temperature sensor readings are saved electronically in the Excel file to return when needed.
Fig 17: Record temperature measurements in an Excel file.
7.
CONCLUSIONS AND
RECOMMENDATIONS
7.1 Conclusions:
A set of conclusions can be drawn depending on the results of the research:
1. It works well and is capable of collecting data wirelessly coverage range up to 1200m and the coverage area can be increased by using the newer Xbee module, but that would be at the expense of cost.
2. Capable of real-time data collection which makes it suitable for real-time applications such as industrial control applications.
3. Low cost and scalable as it has been designed using free open-source software.
4. It has low power consumption as it uses the Zigbee protocol which has this important feature.
5. Able to save the data collected electronically with the possibility of setting the parameters of the PID controller programmatically through the application implemented in the LabVIEW environment.
7.2 Recommendations:
1. The system can be used to monitor many variables such as humidity, pressure, fluid level, etc. using appropriate sensors and to automate various applications such as alarms, fans, and others.
2. The system can be improved using artificial intelligence algorithms in controlling PID variables for the best response.
3. The power consumption of the system can be improved by setting up the Zigbee Sender node to act as a terminal node instead of acting as a router.
8.
REFERENCES
[1] Vaibhav M. Davande, Pradeep C. Dhanawade, Vinayak B. Sutar "Real Time Temperature Monitoring Using LABVIEW and Arduino " International Journal of Innovative Research in Computer and Communication Engineering Vol. 4, Issue 3, March 2016.
[2] Kaiparampil Lizbeth Joy, Anusha Zachariah " Wireless Data Acquisition And Processing " International Journal of Advanced Research in Electronics and Communication Engineering (IJARECE) Volume 4, Issue 5, May 2015.
[3] Emna Aridhi, Mehdi Abbes, Abdelkader Mami "A Data Acquisition with LabVIEW of Temperature of a water tank system:Comparative study with a Pseudo Bond graph Model" International Conference on Automation, Control Engineering and Computer Science (ACECS'14) 2014.
[4] Kishan Prajapati "Process Control and Monitoring using Arduino and Raspberry Pi " Telemark University College 2015.
[image:6.595.56.285.376.735.2][6] Dr. R. K. Prasad , Mr. S. R. Madkar "Design & Implementation of Wireless Transceiver for Data Acquisition in Wireless Sensor Network " International Journal of Advanced Research in Computer Science and Software Engineering July 2013.
[7] Yusuf Ayuba " TEMPERATURE CONTROL AND DATA ACQUISITION METHOD FOR FACTORY USING LABVIEW " International Journal of Computer Engineering & Technology (IJCET) March-April 2016.
[8] K.S.RAVI, Y.RAMAKRISHNA " Design of an Embedded System for Wireless Data Acquision and Control using PIC Microcontroller " International Journal of VLSI and Embedded Systems-IJVES January-April 2012.
[9] YBNV Bhaskar, V Ranjith Kumar, B Rambabu, Y Vinay Kumar "LabVIEW Based Auditorium Monitoring and Control " IJEAR Vol. 4, Issue Spl-1, Jan - June 2014.
[10] Pankaj Sharma, Anil Sonkhusare, Paramita Guha*, and Sunita Mishra "A Temperature Humidity Controlled Automated Grain Storage Chamber Prototype using LabVIEW Software" SSRG International Journal of Electronics and Communication Engineering (SSRG-IJECE) – EFES April 2015.
[11] Faludi, Robert. Building wireless sensor networks: with ZigBee, XBee, arduino, and processing. " O'Reilly Media Inc.", 2010.