Crowd Replication: Sensing-Assisted Quantification of Human
Behaviour in Public Spaces
SAMULI HEMMINKI,
University of HelsinkiKEISUKE KURIBAYASHI,
University of TokyoSHIN’ICHI KONOMI,
Kyushu UniversityPETTERI NURMI,
University of Helsinki and Lancaster UniversitySASU TARKOMA,
University of HelsinkiA central challenge for public space design is to evaluate whether a given space promotes different types of activities. In this paper, as our first contribution, we develop crowd replication as a novelsensor-assisted method forquantifying human behaviourwithin public spaces. In crowd replication, a researcher is tasked with recording the behaviour of people using a space while being instrumented with a mobile device that captures a sensor trace of the replicated movements and activities. Through mathematical modelling, behavioural indicators extracted from the replicated trajectories can be extrapolated to represent a larger target population. As our second contribution, we develop a novel highly accurate pedestrian sensing solution for reconstructing movement trajectories from sensor traces captured during the replication process. Our key insight is to tailor sensing to characteristics of the researcher performing replication, which allows reconstruction to operate robustly against variations in pace and other walking characteristics. We validate crowd replication through a case study carried out within a representative example of a metropolitan-scale public space. Our results show that crowd-replicated data closely mirrors human dynamics in public spaces, and reduces overall data collection effort while producing high quality indicators about behaviours and activities of people within the space. We also validate our pedestrian modelling approach through extensive benchmarks, demonstrating our approach can reconstruct movement trajectories with high accuracy and robustness (median error below 1%). Finally, we demonstrate that our contributions enable capturing detailed indicators of liveliness, extent of social interaction, and other factors indicative of public space quality.
Additional Key Words and Phrases: Urban computing, crowd replication, mobile sensing, public spaces, evaluation, pedestrian modeling, motion sensing
ACM Reference format:
Samuli Hemminki, Keisuke Kuribayashi, Shin’ichi Konomi, Petteri Nurmi, and Sasu Tarkoma. 1. Crowd Replication: Sensing-Assisted Quantification of Human Behaviour in Public Spaces.ACM Trans. Spatial Algorithms Syst.1, 1, Article 1 (January 1), 34 pages.
DOI: 0000001.0000001
1 INTRODUCTION
Public spaces serve an important role in contemporary cities. Among others, they provide a medium for passive and active engagement, and a place for discovery and reflection [11]. Public spaces have The work was partially supported by Nokia foundation scholarship, by the Finnish Academy of Science under the projects Sampling in Pervasive Sensing Systems 296139, and Context Sensing for Security 303825, by JST CREST Grant Number JPJPMJCR1411, and by JSPS KAKENHI Grant Number JP17K00117. We thank the members of Spatial Planning and Design Laboratory at the University of Tokyo for sharing the pedestrian count data. The work only reflects the authors’ views. Permission to make digital or hard copies of all or part of this work for personal or classroom use is granted without fee provided that copies are not made or distributed for profit or commercial advantage and that copies bear this notice and the full citation on the first page. Copyrights for components of this work owned by others than ACM must be honored. Abstracting with credit is permitted. To copy otherwise, or republish, to post on servers or to redistribute to lists, requires prior specific permission and/or a fee. Request permissions from [email protected].
also been linked with quality of life indicators [12]. Indeed, well-designed public spaces can promote individual well-being, and contribute to social and environmental values of neighbourhoods. With ever increasing motorization and urbanization, the role of public spaces has been transforming and their role as hubs for human activities has diminished. To counter this trend, urban planners, activists and architects have been advocating for new ways of enriching human experiences in public spaces by designing the environments so that positive qualities and liveliness of public spaces are increased [58].
Public space quality is intrinsically linked with the way it is used. According to Gehl [17], uses of public space can be categorized into necessary, optional, and social activities, with a successful space being one that actively promotes optional and social activities. Currently, however, urban planners struggle with quantifying whether a particular space promotes these activities. This is because current techniques for public space assessment are either too labour-intensive and provide insufficiently detailed information about usage of space, or require costly investment and high level of technical expertise. Indeed, despite technological advancements, direct observation remains the dominant approach for quantifying public space usage [26, 37, 57]. In direct observation, the researcher manually observes and logs activities of people within the space. From these observations, indicators related, e.g., to the amount of mobility and activities within the space can be derived [37]. The main limitations of this approach are the limited granularity of the collected information, and labour-intensiveness of the data collection process, usually resulting in a small sample size. While a range of pervasive sensing technologies, e.g., visual surveillance [14, 40], aerial photography [18], location tracking [41, 52], crowd sensing [46, 53, 56, 59], and analysis of cellular records [8], can support data collection, they have not been widely adopted due to high resource cost, need for expertise in interpreting the data, and privacy concerns. Additionally, pervasive sensing techniques are vulnerable to biases that limit generalizability of the conclusions that can be drawn. For example, visual surveillance is prone to losing data due to occlusions or illumination conditions whereas crowd sensing captures only users carrying devices with an active WiFi or Bluetooth interface. Accordingly, data collected through pervasive sensing is prone to contain temporal or spatial gaps, and may be biased to a specific sub-population of the people using a space. To address the limitations of existing approaches,an approach that captures unbiased and detailed information of
human behaviour with minimal resource cost is required.
In this paper, as our first contribution, we developcrowd replicationas a novelsensor-assisted
method for quantifying human behaviours within a public space. The idea in crowd replication is to augment direct observation through mobile sensing, enabling capture of detailed information about human behaviour. In crowd replication, theresearchercarrying out an investigation is engaged into
replicating the behaviours of target subjects while carrying a mobile device that collects a sensor trace of the movements and activities of the subjects; see Figure 2b for an illustration.
an application on their smartphones. As crowd replication collects measurements only from the researcher(s) conducting the evaluation, privacy of people using the space can be protected. At the same time, this helps to improve quality of sensor data as placement of mobile device collecting sensor data can be better controlled. The main alternative to crowd replication, visual surveillance, provides a higher amount of measurements but requires either expensive visual analytics software or large amounts of manual effort in annotating video data, making it costly and labour-intensive. Visual surveillance also suffers from high deployment cost due to privacy considerations, the need to obtain necessary permits, and the need to find unobstructed locations for placing the cameras. We stress, however, that crowd replication does not aim at removing the need for visual surveillance, pervasive sensing, or other techniques. Rather, crowd replication has been designed as a cost-effective and easy-to-adopt technique that researchers can use to capture high-quality data to quantify behaviour within public spaces. Crowd replication can also be used to complement other techniques as it provides detailed and unbiased information on the behaviour of people within the target site. Such samples could then be leveraged to interpret, validate and correct data and observations made through other data collection.
A fundamental challenge for crowd replication is to ensure that the collected data is sufficiently accurate and representative of the behaviour of people using the space. To ensure crowd replication captures high quality information of people using public space, as our second contribution, we develop a novel highly accurate pedestrian sensing solution for reconstructing movement trajec-tories from sensor traces captured during the replication process. What makes this particularly challenging is the high variability of motion, with walking pace, heading changes, step intensity and other walking characteristics differing depending on the activities of the people being monitored. Capturing these subtle variations in walking characteristics is essential for understanding uses of public space as these changes are highly correlated with different types of activities taking place within the space [35]. Further complications are caused by stationary periods which can be frequently interleaved with periods of motion. To address accuracy requirements of crowd replication, our pedestrian modelling approach learns apersonalizedmodel of the stride patterns of
a user. In crowd replication, only a small set of users are responsible for collecting data, i.e., the researchers carrying out the replication. Furthermore, the devices collecting sensor measurements are primarily used for sensor data collection instead of serving as personal communications devices. This provides better control over device placement and orientation, and reduces the impact of spontaneous user interactions and noise on the sensor measurements. Our sensing solution takes advantage of these factors, mining the collected sensor measurements for step cycles which then can be associated with indicators related to motion intensity, stride length, and walking pace. This contrasts with existing research on pedestrian behaviour sensing which has predominantly targeted scenarios where the focus is on generalization over various users and unknown device use and placement at the expense of sensing accuracy [7, 22].
two researchers could collect sufficient amount of data in around 4 hours. In contrast, manually annotating 30 minutes of video surveillance data required over 50 hours of work, and only produced aggregate level information on the behaviour of people using the space. As the second step of our evaluation, we evaluate the accuracy of the collected data by comparing dwell indexes extracted from crowd replicated data against those extracted from manually annotated video data [21]. Our results show a high level of correspondence between the two sets of indicators (0.914 correlation). We also separately assess the accuracy of our pedestrian modelling solution, demonstrating that it provides better accuracy than current state-of-the-art techniques. The results demonstrate that our approach is particularly effective against variations in walking pace, providing highly accurate and robust performance while the performance of state-of-the-art solutions degrades. As variations in pace often relate to different activities, e.g., people walking in groups tend to have slower walking pace, our approach is thus better capable of capturing subtle nuances in the walking patterns of people using the space – a critical requirement for assessing optional and social activities. As the third part of our evaluation, we compare data quality and overall effort of crowd replication against video tracking and pervasive sensing techniques. Our results demonstrate that crowd replication can significantly increase sample sizes compared to direct observation, while at the same time being more cost effective than current urban monitoring solutions. As the final step of evaluation, we demonstrate that our sensing approach enables crowd replication to capture spatiotemporally fine-grained indicators about human behaviour within public spaces. Specifically, we demonstrate that reliable and detailed indicators of liveliness and extent of social interaction can be obtained with the proposed method. The resulting data from our experiments, together with details about the spatial area and model parameters has been made freely available for research purposes at http://akiyatoolbox.org/crowd_replication/.
Summary of Contributions
The contributions of the paper are summarized as follows:
• We develop crowd replication as a novel and resource-efficient method for quantifying human behaviour within public spaces.
• We develop a novel, highly accurate pedestrian modelling solution, and demonstrate that it operates robustly against variations in walking pace.
• We validate crowd replication through a case study carried out in a representative urban space, demonstrating that it results in data that is representative of the target population and their behaviours.
• We critically compare work effort, data granularity, sample size, potential biases, and other factors between crowd replication and other data collection mechanisms. Our comparison shows that crowd replication provides a good trade-off between data collection effort and accuracy of collected data. The deployment and analysis costs of crowd replication are also moderate, making it a cost-effective alternative that can replace or supplement other techniques within up to moderately sized public spaces.
• We demonstrate that crowd replication enables capturing indicators that provide fine grained information about the movements, activities, and human experience within an urban space. Examples of such indicators include liveliness, extent of social interaction, and temporal variations in motion patterns.
2 RELATED WORK
Our research draws inspiration from three threads of previous research: (i) methods for evaluating public space quality; (ii) sensing assisted modeling of human behaviour; and (iii) modeling of pedestrian behaviour. In the following we describe related work in these topics.
2.1 Public Space Evaluation
To increase positive qualities of public spaces, urban planners, activists and architects have assessed key qualities of public spaces through careful direct observations [26, 37, 57]. Of particular impor-tance in these investigations have been the different types and varieties of activities taking place, together with their distributions in terms of spatial, temporal and demographic variables. There are three widely acknowledged categories for activities of interest in public spaces: necessary, optional and social [17]. While necessary activities, such as walking to a post office, take place regardless of the quality of a public space, optional activities, such as strolling to appreciate fresh air or liveliness of streets, depend on actual and perceived qualities of the space. Social activities such as seeing and talking or playing with other people may spontaneously occur when necessary and optional activities are sustained over a period of time. Indeed, the amount and extent of activities in a public space has been shown to correlate positively with the amount of social interactions [16]. Urban planning experts have argued that successful public spaces are characterized by diverse activities by people from various age groups with the size and gender distribution of the groups also having an effect [58]. These factors help, for example, to distinguish between lively and crowded public spaces. Despite theoretical developments and several established rules of thumb, little work has proposed practical methods for uncovering spatiotemporal distributions, compositions, and dynamics of activities in public spaces. Our work addresses sensor-assisted capture of these aspects.
2.2 Pervasive Sensing for Crowd Observation
In indoor environments, crowd monitoring can be performed using high precision indoor local-ization or infrastructure-based tracking. As an example, Larson [32] used RF-ID measurements to track movements of people within a retail environment. Instead of tracking people, Weppner et. al. [56] estimate overall density of people using a space from Bluetooth scans. A related approach is proposed by Schauer et. al. [46] who combine Bluetooth and WiFi scanning for crowd density estimation. These solutions only provide an estimate of the overall number of people using the space and cannot be used to characterize the spatiotemporal distribution of activities, movements, and other behaviours of the people using the space. Related commercial tracking solutions in-clude Ubisense [52] and Quuppa HAIP [41], which provide high resolution indoor tracking, and Walkbase [53] which utilizes beacon request messages send by WiFi-enabled mobile devices to estimate crowd movements. While these technologies could be adopted for urban public spaces, they suffer from high deployment costs and require the user to carry specific hardware, or have specific settings on their mobile devices (e.g., Bluetooth/WiFi continually on). Additional concern with these technologies is that the resulting samples often contain significant and uncontrollable biases, making it difficult to draw generalized inferences from the measurements.
Mobile sensing has been shown to be useful in application domains such as transportation, environmental monitoring, and health and well-being [31]. Location tracking using GPS or cellular (GSM or CDR) data can be used for evaluating public space quality [43]. Such data can be used to analyse, e.g., macroscopic patterns of cities to estimate aggregated mobility modes, or regional events [8]. While mobile phone-based location tracking techniques are capable of capturing dy-namics of people within the space, the granularity at which they can track activities is very coarse and does not adequately address the concerns of designers and planners of human-scale spaces. For example, capturing dwelling patterns or differences in activity patterns between weekdays and weekends is not feasible with these methods. Another alternative is to enhance traditional direct observation methods by using wearables, such as video cameras. As an example, architecture researchers have used portable digital cameras to track pedestrians while filming the movements of their feet [45]. The main issue with these techniques is that the analysis of the video images is extremely labour intensive and requires multiple annotators for ensuring quality of the analysis.
2.3 Pedestrian Modeling
Our approach for trajectory modeling draws inspiration from techniques for pedestrian movement modeling, and particularly microscopic agent-based modeling [3, 28, 50]. Instead of tracking participants directly, these solutions create synthetic trajectories by simulating movements of individual pedestrians. First approaches to agent-based modeling relied on cellular automata based models where agents move in a grid according to certain decision rules. In the simplest case the movements can correspond to a random walk, whereas in more realistic cases additional constraints, such as accessibility and road infrastructure information are incorporated into the model [20, 47]. Asano et al. [2] propose a variant that incorporates two types of movement rules: tactical and operational. The tactical module affects user’s speed and direction of movement, whereas the operational module is responsible for micro-motions responsible for avoiding obstacles or other pedestrians. Other examples of factors that can be incorporated into the pedestrian decision model include walking speed, direction of movement, utility of different areas, and target destination of the agent; see, e.g., Hoogendoorn and Bovy [24] for an overview.
Kitani et al. [29] and Ziebart et al. [64] use Markov decision processes (MDPs) to model pedestrian movements, which allows different actions to be given different utilities. For example, the model allows assigning higher weight to sidewalks than other areas. Other related approaches have been extensively proposed in computer vision [10, 30, 44]. A challenge with these approaches is to capture the reward structure of the participants, which requires either highly detailed trajectories or detailed information about the space where the model is applied. Also, these solutions are predominantly applicable only to visual surveillance data which, as we discuss later in the paper, has higher burden on data collection. Jitta and Klami [27] propose a model based on partial Hidden Markov Models. Instead of requiring a reward structure, their approach fits the model based on spatial features (such as dwell time or average pace length) at different parts of the space. Also the use of deep learning has been explored. As an example, Alahi et al. [1] propose a social LSTM model that integrates a so-called social layer which allows trajectory predictions to adapt to social interactions whenever multiple persons are within each other’s proximity. The main limitation of both of these techniques is that they require extensive amounts of training data to produce high quality models, and that the performance of the models is sensitive to the features that are available. Also, while the models can typically capture average behaviour well, they are unable to capture deviations from this behaviour, e.g., when special events are taking place within a public space.
2.4 Summary
To summarize, while there have been advances in sensing techniques for assessing public space quality, these techniques have not been adopted by practitioners. Indeed, practitioners often have the perception that limiting data collection to sensed data leads to poorer sets of collected attributes [60] and results in inherent biases due to digital differences [63]. Our work addresses this discrepancy, providing a mechanism where researchers have control over sample selection, but at the same time can benefit from finer granularity data provided by sensing technologies.
3 SENSOR-ASSISTED QUANTIFICATION OF HUMAN BEHAVIOUR
The focus of our research is on developing a resource-efficient method for collecting high-quality and unbiased data about human behaviour within public spaces. To accomplish this, we have developed crowd replication as a novel approach for public space evaluation. In crowd replication, the researcher responsible for evaluating the public space is tasked with replicating the movements and activities of people using the space while being equipped with a smartphone that captures a sensor trace of those movements and activities. The sensor data is then combined with visual observations, e.g., about user demographics and labels describing activities performed by users. This combination of direct observation and automated sensing helps crowd replication to capture the nature and characteristics of optional and social activities [17], two of the key dimensions for assessing public space quality. In the following we first introduce the overall idea of crowd replication, after which we describe each main phase of the overall process. Finally, we detail technical aspects of the proposed pedestrian sensing technique that we have developed to support crowd replication.
3.1 Overview of Crowd Replication
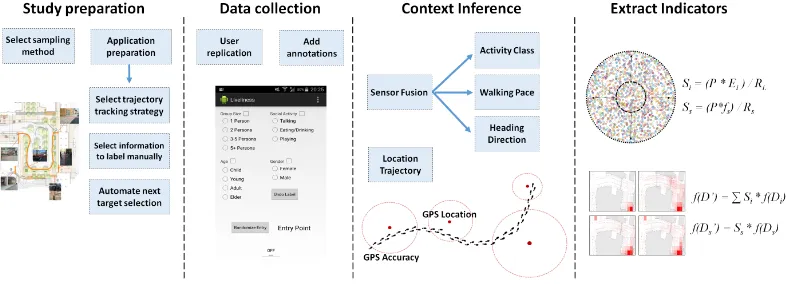
Fig. 1. Overview of the different phases of the crowd replication process.
reflect the behaviour of the overall population. The crowd replication process is summarized in Figure 1 and consists of four main stages. In the following we describe these stages in detail.
Study Preparation:During the first phase of crowd replication, the main tasks are to determine
thesampling strategy, i.e., deciding the strategy on selecting participants for replication, and to
identify necessary annotation labelsto support visual observation. The sampling strategy should
capture a representative subset of the target population, while also ensuring representative sample of population behaviours. Representativeness of the target population can be ensured using a population-based sampling strategy, i.e., replicated users are chosen based on the relevant population characteristics within the target area (e.g., gender, age group or other characteristics). However, this requires prior effort in surveying the population characteristics, which is not always readily available or feasible to conduct. Additionally, this approach does not guarantee the sample to be representative of the behaviour of the people within the space. To simultaneously achieve representativeness of both target users and their behaviours, we rely oncluster samplingwhere the physical entry
points of the space are interpreted as clusters and random sampling is applied within each entry point [54]. Our strategy is motivated by the observation that public spaces typically have natural entry points which guide the movements of people in and out of the space, and which thus influence the activities and behaviour of people within the space. Utilizing entry points to select replicated participants causes minimal bias to the distribution of user demographics, while simultaneously allowing to capture complete motion trajectories. In our experiments we demonstrate that this strategy produces data that is representative of the overall target population and their behaviours; see Section 5.1 for details. Note that crowd replication is not restricted to these sampling strategies. Indeed, one of the key strengths of crowd replication is that it enables fine-grained control of the sampling strategy. This control enables studies targeting specific sub-populations, and also mitigates possible biases in the sample population. Such biases are often difficult to avoid and understand with pervasive sensing and opportunistic data collection methods [33].
observation than through direct replication. However, even for these activities, crowd replication helps to produce more detailed information as the sensor traces captured during replication help to characterize these activities, e.g., how walking characteristics or dwell times are affected by social activities. In contrast to social activities, discerning between optional and necessary activi-ties is more challenging as we do not know the actual motives of the people moving within the area. Certain activities and movement trajectories are more likely to indicate optional activities, e.g., sitting on a bench, or a trajectory between different parts of a shopping center. Similarly, other activities and trajectories are more often associated with necessary activities, e.g., remaining stationary besides a bus stop, or direct path from an entry point to a post office or bank. When choosing annotation labels, requirements for capturing relevant optional and necessary activities should thus be considered. Typically the annotations should include basic demographics about the users, e.g., age and gender of the participant. More detailed annotations can be relevant for certain spaces, e.g., if the participant seems to be shopping, transiting or working. In some cases, such cases can be automatically extracted from the sensor traces. As an example, there are several works on categorizing museum visitors based on their movement patterns [61] and similar techniques could be used to uncover motivations of people using the space. If such information is vital for the study, requesting a brief interview from the participant after the replication process is finished might be a viable approach. In our experiment, only information that can be captured without interrupting the users are considered. Specifically, we consider annotations about participant’s age discretised to four categories, participant’s gender, three types of common social activity, and group size discretised to four categories.
After the sampling strategy and annotation labels are selected, a mobile application is configured for the area of investigation. The application is responsible for recording sensor measurements and helps with adding manual annotations about direct observations. While both operations can be run on a single device, in practice the best option is to use two devices, one for sensor capture and one for annotation. This helps to ensure the annotation process does not interfere with the sensor traces captured during replication. The device used to collect sensor measurements should be placed and oriented to ensure optimal sensor trace for motion analysis, i.e., in our case we placed the device in upper thigh pocket to ensure we can accurately capture details about each step. As our experiments focus on outdoor spaces, we rely on GPS, magnetometer, accelerometer and gyroscope measurements for recreating the movements and activities of the replicated user. Note that while our experiments do not cover indoor environments, crowd replication could also reasonably be adopted for indoor environments by replacing GPS with a relevant indoor localization technique; see Section 8 for discussion. The interface for adding annotations allows quick insertion of demographics about the participants, as well as labels about activities and behaviours which were not physically replicated by the researcher. This latter option is necessary as replicating some activities can be impractical or cause concern to the replicated person by revealing the replication process and altering their normal behaviour. The exact type and detail of activities to replicate or manually label depend on the objectives of the study, and can be tailored to the mobile app during the study preparation phase. The annotator interface is also used to randomize the next entry point from which to initiate the next replication process. Screenshot of our application is shown in Figure 2a.
Data Collection:In the second stage, data collection, researchers carrying out the investigation are
been wearing the sensing device; see Figure 2b for an illustration. Note that the overall goal of the replication is to capture parameters describing motion on a general level, not to capture the exact sensor representation of walking characteristics. Indeed, we aim at capturing parameters such as approximate position, pace, and step count, which generally can be replicated with relative ease and reasonable accuracy, contrary to exactly mimicking the gait patterns of a user [38]. to collecting a sensor trace with one device, the research uses a second device to insert annotations about visual observations. The application supports quick insertion of user demographics, activities of interest, and other factors of interest. The application automatically links the annotations with the location where they were taken, thus researchers can capture the spatial distribution of activities by making the annotations approximately at the location where they were performed. The overall effort to collect data in crowd replication is moderate and comparable to direct observation, while providing information at finer granularity. For example, in the case study considered in our evaluation (see Section 4), six different researchers collected data for 2−3 hours, resulting in a combined data set consisting of roughly 16 hours of measurements.
To avoid interfering with normal behaviour within the space, the data collection should be carried out in a subtle manner that avoids making the replication process obvious [23]. In case of a busy area, this typically only requires maintaining sufficient distance to the target person and avoiding such activities which could cause confusion. For example, in our evaluation none of the 614 replicated users showed visible concern or signs of noticing the process. In case of a quiet area, or where following a person is not suitable, the main option is to record user demographics first, and repeat the trajectory only after the user has exited the area. Note that shadowing (or trailing) is widely established as a tool to assess uses of a space. For example, museums often adopt related techniques [6, 13]. Crowd replication can also be combined with other data collection techniques. For example, trajectories can be replicated from a video recording in case such media is available. Note that compared to visual surveillance, requirements for the recording are substantially more relaxed in terms of video resolution, occlusion and lightning conditions. Crowd replication can also be used to supplement video analytics, e.g., by recreating trajectories where visual analytics are unable to capture the measurements sufficiently accurately.
Context Inference:In the context inference stage, the collected sensor data and the recorded
annotations are passed to an offline analysis framework. The analysis framework is responsible for reconstructing enriched trajectories containing information about participants location, details about pace, intensity and heading of motion, replicated activities, and recorded annotations. As the first step within the analysis framework, we constructs pedestrian models from the motion sensors, i.e., accelerometer and gyroscope, that provide high quality information about step frequency and overall intensity of motion. The pedestrian models are next combined with a heading estimate obtained through a sensor fusion of accelerometer, gyroscope and magnetometer measurements to produce a pedestrian dead reckoning (PDR) system. The PDR system is then fused with available location information from positioning system, i.e., in our experiments GPS, and the coordinates of the initial entry point. The fusion between the PDR and available location information is used to simultaneously manage accumulation of PDR error, and to enhance location accuracy provided by the underlying positioning system, in particular when the location accuracy is low.
(a) User interface of the application used for crowd replication in our example use case.
Smartphone
Researcher Target person
[image:11.486.225.361.95.276.2](b) Example of a researcher carrying out crowd replication.
Fig. 2. User interface of the app we have developed for supporting crowd replication (Fig. 2a) and an example of a researcher replicating the movements of a person (Fig. 2b).
containing details about user demographics and activities not physically replicated are attached to produce final enriched trajectories.
Extract Indicators:The enriched trajectories alone are sufficient for answering many questions
regarding the use of public spaces that can be quantified throughrelativedifferences between
usage. As examples, consider evaluation goals such as inspecting fraction of people stopping at an information post or exhibition stand, relative motion flows within the area, or ratio between young and elderly age groups. However, there are also many characteristics that reflect thetotalnumber of
individuals. For assessing these characteristics, it is necessary to generalize the indicators derived from replication to the entire population of the target area. We achieve this by deriving scaling factors that enable adjusting values from replicated data into the overall population. To formalize the extrapolation process, letP denote the total number of people in the target population,Ei the fraction of all users that arrive at clusteri, andRi the number of users replicated at clusteri. As an example, in our caseP corresponds to the total visitor count for a public space, the clusters correspond to different entry points, andEicorresponds to the apriori frequency of people entering the space through the entry point corresponding to clusteri. The value ofPcan be estimated from publicly available data sources, such as pedestrian count records, residence counts, or travel survey data, whereas the values ofEi can be estimated from small-scale people counting surveys, e.g., we estimated the values ofEi from two 30 minute video feeds.
Formally, for each clusteri, we derive a scaling coefficientSi for extrapolation using:
Letf(Ri)denote an indicator calculated from the replicated measurementsRi, the adjusted estimator f(DP)for the entire populationP can then be calculated using
f(DP)= n Õ
i=1
Sif(Ri). (2)
Note that the scaling factors only take into considerationactiveusers for which replicated data
is available. In some cases we may be interested in estimators for sub-populations which cannot be reliably replicated (e.g., stationary users, people with baby carriages, and so forth). Estimators for these sub-populations can be calculated using a similar process. Accordingly, we first need an estimate of the apriori frequency of the sub-population, after which manual labels can be used to estimate the number of users in the sub-population, i.e.,Ri. The final estimator is then calculated analogously, using Equations 1 and 2.
The length of trajectories could potentially bias crowd replication as long trajectories contain more measurements than shorter ones, and hence are likely to have a larger impact on the scaling coefficients. To mitigate this bias, we normalize the scaling factors with respect to the length of the trajectories, i.e., we derive a normalized estimatorf(Dnorm
P )using
f(Dnorm
P )=l
m Õ
j=1
f(rj)/lj. (3)
Here f(rj) is the indicator calculated from replicated trajectoryrj andlj is the length of the trajectory.
3.2 Pedestrian modelling for Crowd Replication
The quality of the information captured through crowd replication depends on the accuracy of the underlying sensing solution that is used to recreate the activities and movements of the replicated subjects. We have developed a novel high-accuracy sensing solution which, instead of performing online recognition during replication, learns a personalized model of the movement characteristics of an individual from all data collected during replication. By tailoring the sensing to the characteristics of the researcher, higher accuracy can be obtained than using off-the-shelf tracking techniques. In particular, off-the-shelf techniques are vulnerable to changes in pace [7], which are essential for understanding behavioural patterns and capturing social activities. Additionally, as shown by Muaaz and Mayrhofer [38], mimicking another person’s walking patterns easily results in asymmetry, which further complicates the pedestrian modelling. In our case we seek to capture the movement trajectory of the subject, and details about his/her walking pace (in steps per second) and pattern in terms of intermediate stops and atypical steps.
Fig. 3. Overview of mobile sensing approach.
and inactivity by combining successive frames exceeding the activity thresholdσactive together. To further improve accuracy, we identify exact start and end times by analysing the first and last frames of each period and considering the first sample to violate the thresholdσactiveas the boundary point of the corresponding segment.
From the frames labelled as active, we next estimate the walking pace of the user. We consider only gyroscope measurements as we found them to better capture the cyclical patterns associated with walking than accelerometer measurements. Indeed, accelerations caused by heel strike and external activities can mask the dominant pace in accelerometer measurements, while the underlying cycling pattern remains visible in gyroscope measurements. To capture the dominant pace, we find the dominant dimension of the gyroscope measurements by projecting the measurements along their first principal component. From the projected gyroscope measurements, we mine for cyclical patterns to produce (walking) step candidates. To find these patterns, we adaptively divide the data into frames using a grid-search that identifies the optimal frame length and overlap parameters. Specifically, we vary frame lengthft between 1−5 seconds, and frame overlapfobetween 0−95% to find measurements frames that are optimal in terms of their autocorrelation score. The advantage of our approach is that it can guarantee an optimal framing for the underlying pattern, whereas fixed frame parameters used by most step detection approaches [7] would make the detection susceptible to parameters values that are incompatible with the user’s actual walking pattern. Fixed frame parameters would also struggle to identify walking patterns when the underlying walking pace varies.
candidate steps. Autocorrelation lag only provides an estimate of the pace over the entire frame, while duration of each individual steps within the frame can vary. To capture this variation, we find exact step frame boundaries by using minima in overall acceleration as cut-off points. Specifically, we define step frame boundaries by finding local minima from the overall acceleration. To avoid situations where the step duration varies significantly from one step to another, and to account for normal variation in human walking pace, we require these minima to be within 20% of the point corresponding to the initial candidate step frequency. For every detected candidate step, we then store the duration of the step, value of the autocorrelation, minimum, maximum and standard deviation. We note that the proposed approach to instrument the researchers with sensing devices(s) allows controlling many of the most challenging variables in motion sensing systems, e.g., device model, device placement and user characteristics. This is a key benefit allowing robust selection of threshold values when compared to systems that are designed to work in the wild and have to generalize over such variables.
From the mined dataset we learn a regression model between pace and motion intensity, i.e., between duration of candidate steps and standard deviation of overall acceleration during the candidate step. The relation between walking pace and motion intensity is roughly linear for normal walking paces. In case of very slow or fast walk, the relation roughly follows an exponential decay function curve. Typically there are one to three such relationally dependent subsets within the data, each corresponding to a pattern generated by multiple of steps. We learn models for the first two orders as we found these to be the most relevant, while third and consecutive order multiples are redundant to the first two. Indeed, depending on walking pace and device placement, the strongest pattern is produced by either a repetition of a single step or repetition of two steps, often referred to asstride. The pattern for a single step is typically stronger when the device is equally affected
by steps taken by both legs, e.g., while held in hand. Stride, on the other hand, produces stronger pattern when the device is asymmetrically affected by steps, e.g., when the device is placed within the user’s trouser pocket.
To reduce computational complexity of learning the regression models, we cluster frames based on similarity in pacep, motion intensitymand autocorrelationρ. This is particularly effective during continuous unobstructed walk, which typically exhibits a stable pace and overall motion, producing multiple steps with high similarity. The clusters are formed by processing through the frames in order of descending autocorrelation score. Each sample is tested against existing clusters and added to the model it best fits. In case none of the models provide a good fit (currently we use d > 0.05 as threshold) for the sample, we initiate a new cluster with the sample. Formally, distance between sample A and cluster C is calculated as:
d=abs(pA−pC)/pC+abs(ρA−ρC)/ρC +abs(mA−mC)/mC (4)
After reducing number of candidate steps through clustering, we learn the two regression models that best characterise the candidate steps. This process follows a two-stage approach. First, we initialise two models with seed samples corresponding to the clusters formed around the frame with strongest autocorrelation. We then find feasible candidates that exhibit downward sloping linear relation between walking pace and motion intensity. As there are naturally noise in both step length and the motion intensity values, we allow a degree of slack (currently 5% of the models initial sample) to fulfil the requirement for negative linear relation. We note that at this stage clusters can be valid for more than one regression model.
Fig. 4. Regression models discovered from the data between walking pace and std of accelerometerL2-norm. In the modelN1= 100700,RMSE1= 0.22,R−Squared1= 0.8750, andN2=203910,RMSE2= 0.31,R−Squared2
= 0.6536
Fig. 5. Illustration of detected walking pace (scaled by10) aligned with raw data about overall acceleration.
iteration we learn a regression model, and in case the fit is below minimum requirement, remove the cluster with highest residual from the model. To account for the varying number of samples forming the clusters, we use the cluster size as a weight when learning the model. The process is continued until a sufficiently good fit of the data is obtained, or number of remaining data points falls below a threshold. If some clusters remain in both models after the filtering process, we assign each of these conflicting clusters to the model where it produces the smaller residual. The regression models learned from the data are illustrated in Figure 4.
[image:15.486.77.416.321.464.2]Fig. 6. Target public space and its nine entry points. Fig. 7. Center area and its main entry points (left), and the area split into 15x15m grids (right).
3.3 Location Sensing
We recreate movement trajectories of the subjects by combining location information and pedestrian dead reckoning (PDR), augmented with the pedestrian modelling module detailed above. As we initialise each replication from one of the entry points automatically provided and stored by the application, we utilize coordinates of the respective entry point as the initial location. Our experiments focus on an outdoor space, and hence we rely on GPS as our underlying positioning system. For experiments focusing indoor spaces, leveraging an existing indoor positioning technique could reasonably replace GPS; see Section 8. We sample GPS at 1Hz, which ensures high tracking accuracy. Note that, while GPS suffers from heavy battery drain, the sensing application can run continuously for several hours on a contemporary smartphone, which is sufficient for typical data collection in crowd replication. For extended data collection tasks, replacement phones might need to be considered to avoid draining the phone’s battery.
To yield final spatiotemporal movement trajectories, we follow a standard fusion of GPS mea-surements with PDR. Specifically, GPS meamea-surements are used to manage accumulation of error from PDR, whereas PDR is used to improve location accuracy between the GPS measurements, in particular when the GPS reception is low. Our PDR approach is based on detecting steps and pace using the pedestrian modelling module as described above, and a sensor fusion based orientation filtering method proposed by Madgwick [34]. We balance between GPS measurements and PDR estimates by weighting GPS location estimates with horizontal accuracy reported by GPS. Specifi-cally, we allocate the location measurement a weightα= [0.0, 0.5] using a decay functionf(x) so thatf(x ≥15.0m)=0.0 and f(x ≤5.0m)=0.5. Exponential decay is used to determine the appropriate weight for the intermediate values betweenx =[5,15]meters.
4 EXPERIMENTAL SETUP
[image:16.486.47.212.90.178.2]4.1 Description of Target Area
We have conducted our field study at the outdoor areas of Kashiwano-ha, which is located within the larger metropolitan area of Tokyo. Kashiwano-ha is at the intersection of a popular shopping centre and a transportation hub encompassing train, bus and taxi stations. We selected this area since it includes various artifacts and spaces that have been designed to improve human experiences. The planners and designers are keen to evaluate the area quantitatively, and recently direct observation and manual pedestrian counting were conducted at several locations within the area. The area is mainly aimed for pedestrians, with cycling prohibited within the area. The area features services such as several sets of tables, total of 95 chairs and benches, information stand, guide map and an interactive touch display. The centre of the area, as portrayed in Figure 7, contains six possible entry points, and the full area, portrayed in Figure 6, contains nine entry points. All data collected through our experiments, as well as the layout of the target environment, have been made available online at http://akiyatoolbox.org/crowd_replication/.
4.2 Crowd Replication
In our experiment, we focus on the outdoor areas at the centre of the Kashiwano-ha. The target area is used for stationary activities including socializing, eating, or spending time, and to move between various locations surrounding the central area, i.e., the two sides of the shopping centre, train and bus stations, hotel, post and bank. We have used crowd replication within our target area to assess the quality of the space and to extract indicators of the quality of the human experience. Below we detail how crowd replication was carried out within the target environment.
Data Collection Design
As our location sampling method, we have opted to use GPS due to clear view of the sky within majority of the target area. The tall buildings near the entry points can cause decrease in localization accuracy, which we compensate by using the coordinates of the entry points to initiate each trajectory. The PDR component of our trajectory tracking approach is valid for the entire area considered, i.e., there are no escalators or moving sidewalks within the considered area. Within the data collection application, we have included manual annotations about:
• Group size of the replicated participant/group, • gender of the participant,
• age category of the participant, and
• common social activities within the area, i.e., ’Talking’, ’Eating/Drinking’, and ’Playing’.
Sampling Design
To collect a representative subset of population, we utilized the entry points (six for T1 and nine for T2 and T3) of the area to select the targets for user behaviour replication. Specifically, each new target was selected as the first person arriving from a randomized entry point. Querying for the next entry point was implemented as part of the mobile app we used for sensor data collection. The mobile app was also responsible for recording ground truth about user demographics and social activities. The probability distribution for randomizing the entry points was derived from an earlier survey where we counted the number of people arriving from each entry point. The survey was carried out separately for weekdays and weekends and we used different crowd density distributions for them.
User Behaviour ReplicationThe primary characteristics we focus on replicating include
we demonstrate that these characteristics can be accurately replicated. We focus on periods with movement or physical activities for two main reasons. First, moving users are the most challenging subgroup to survey, while stationary individuals sitting or standing can be efficiently recorded using a combination of pen and paper and mobile tools. Second, we focus our investigation on indicators and user groups that most benefit from the use of mobile sensing.
Model ConstructionFor obtaining aggregate level statistics, we require the scaling factorP for
the total number of people visiting the space. We estimatedP by aggregating values from three sources; statistics publicly available from the local railway company1, population count survey recently carried out within our target environment by urban planners and researchers, and our own a video-based population count. Additionally, to obtain sub-population estimates, we performed a small-scale video-based crowd counting to estimate the fraction of stationary and mobile users within the space. The sub-population estimates were derived from a 30 minute video feed that was collected simultaneously with the crowd replication process. Scaling factors for estimators based on active and stationary populations, i.e.,f(D)andf(Ds), were then derived using Equations 1-3. Final estimators were obtained by normalizing replicated trajectories by their length and multiplying the estimators with the corresponding scale factors. Note that while visual monitoring was used, we only performed low-effort crowd counting instead of tracking movements of individuals. Crowd counting is low-effort compared to visual tracking and can be carried out also with alternative means, e.g., through direct observation.
5 VALIDITY AND ACCURACY OF CROWD REPLICATION
We begin our evaluation by validating crowd replication as a data collection mechanism. We demonstrate that crowd replication captures a sample that is representative of the key characteristics of people using the target space. Specifically, we demonstrate that both the trajectories collected with crowd replication and the demographics of the sample converge to the underlying distributions of people using the space. Next, we consider the accuracy of the data collected through crowd replication, demonstrating that indicators extracted from replicated measurements closely mirror those captured from manually labelled visual surveillance data. We also demonstrate the benefits of our pedestrian modelling approach by evaluating it using an existing benchmark dataset [7]. Finally, we critically compare crowd replication to other data collection methods, demonstrating that it can significantly increasing sample size compared to direct observation while at the same time requiring significantly smaller resources than visual tracking or other pervasive sensing solutions.
5.1 Sample Validity
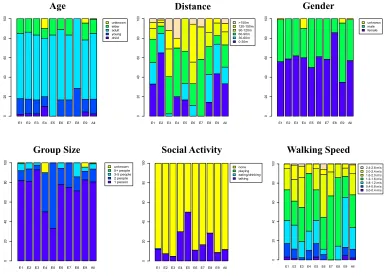
The representativeness of the measurements collected using crowd replication depend on how well the overall sample and the replicated trajectories capture key characteristics of the behaviour and demographics of the target population. With the exception of small-scale spaces in homogeneous neighbourhoods, both the behaviours of people and demographics are likely to contain significant variability, making it difficult and non-trivial to accurately capture the underlying distribution of the target population. To illustrate this point, Figure 8 shows the distribution of four key demographics and two key movement characteristics across the different entry points for the larger target area considered in our study (see Figure 6). From the figure we can observe that each entry point differs significantly from every other along at least two characteristics. We can also observe that the entry point distributions differ from the aggregated distribution of the overall population.
We first demonstrate that the trajectories collected with crowd replication converge to the trajectories of the target population. We carry out this evaluation by calculating the minimum
Age Distance Gender
Group Size Social Activity Walking Speed
E1 E2 E3 E4 E5 E6 E7 E8 E9 All
unknown elder adult young child 0 20 40 60 80 100
E1 E2 E3 E4 E5 E6 E7 E8 E9 All >150m 120-150m 90-120m 60-90m 30-60m 0-30m 0 20 40 60 80 100
E1 E2E3 E4 E5E6 E7E8 E9 All unknown male female 0 20 40 60 80 100
E1E2E3E4E5E6E7E8E9All
unknown 5+ people 3-5 people 2 people 1 person 0 20 40 60 80 100
E1E2E3E4E5E6E7 E8E9All none playing eating/drinking talking 0 20 40 60 80 100
E1E2E3E4E5E6E7E8E9All
[image:19.486.51.439.94.372.2]2.4-2.8 m/s 2.0-2.4 m/s 1.6-2.0 m/s 1.2-1.6 m/s 0.8-1.2 m/s 0.4-0.8 m/s 0.0-0.4 m/s 0 20 40 60 80 100
Fig. 8. Distributions of the key demographics and movement characteristics across different entry points. The variables E1-E9 correspond to the nine entry points for the full target area shown in Figure 6.
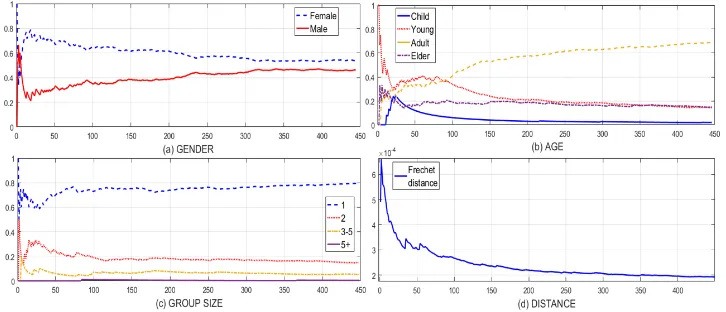
pair-wise trajectory distance between replicated trajectories and estimate the speed at which the distances converge. Specifically, we iteratively progress through the replicated trajectories and add them to a set of seen trajectoriesTS. During each iteration the next unprocessed trajectory is compared to those already inTSand the minimum distance to a trajectory inTSis returned. As the distance measure we use the Fréchet distance, which is a widely used measure for assessing the similarity of movement trajectories [19, 51]. In this evaluation, we examine data collected during a three hour data collection session conducted over a regular weekday.
Fig. 9. Number of replicated user trajectories vs. convergence of (i) gender, (ii) age, (iii) group size categories, and (iv) minimum pairwise (Fréchet) distance to the most similar location trajectory.
thus indicate that crowd replication captures a sample that is representative of the behaviours of the people within the space. To put our results into context, the sample size required by crowd replication is comparable to the use of video surveillance which has the highest overall resolution for capturing behaviour. However, the cost of deploying crowd replication is significantly lower than deploying visual surveillance and the data collected through crowd replication can be analysed with significantly lower effort. We also note that the distribution of user demographics were similar for all researchers performing crowd replication, indicating that crowd replication is easy to implement in practice and capable of effectively capturing the actual distribution of users.
5.2 Accuracy of Crowd Replicated Data
As the next step of evaluation we assess the overall accuracy of crowd replicated data. We perform an end-to-end evaluation by comparing indicators extracted from crowd replicated data and manually annotated visual surveillance data. As indicator we consider theaggregated dwell time, which
corresponds to the aggregate duration of all people passing through an area [36]. According to its definition, people lingering within an area have higher impact on the dwell time than those merely passing through, and hence areas with higher dwell time are livelier than other areas. We carry out the evaluation considering all measurements collected during T1, i.e., a 30 minute weekday trial where both visual surveillance and crowd replication were used to collect data.
We first assess the correspondence of crowd replication and visual surveillance across all users and the entire target space. During the trial crowd replication was carried out by four researchers resulting in approximately 2 hours of data. To compare against visual surveillance, we use the population model described in Section 3 to extrapolate crowd replicated data to cover the entire population. After scaling, crowd replication results in 38 hours 5 minutes and 50.7 seconds of data, while visual surveillance results in 38 hours, 3 minutes and 57 seconds, i.e., a difference of under two minutes or a deviation of 0.08%. Note that scaling is performed separately for each entry point, and hence the result suggest that both our sampling strategy and population model are accurate.
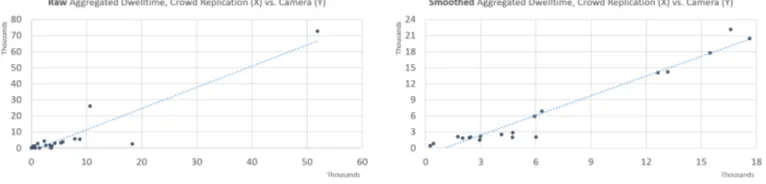
Fig. 10. Comparison of normalized aggregated dwell time between manually annotated video and crowd replicated data, and comparison of spatial distribution of aggregated dwell time.
cells and calculate dwell time separately for each cell. The grid structure we consider is shown in Figure 7. Note that our partitioning is intended as a proof-of-concept for assessing performance of crowd replication, and in practice another kind of partitioning may be more relevant – for example, dividing the space into areas with different functionality. Besides considering dwell time estimates calculated directly from crowd replicated data, we also consider smoothed estimates derived by averaging the values of all cells within one cell’s neighbourhood. Formally, smoothed aggregated dwell timeDs for celliis calculated using
Dis = |N1 |
N Õ
i
Di (5)
whereN contains the (3x3) neighbourhood ofi, including celli, andDiis the original aggregated dwell time ofi. The rationale for considering also smoothed dwell time estimates is that this enables accounting for localization errors in cases where location estimates fall into neighbouring cells, e.g., due to presence of tall buildings.
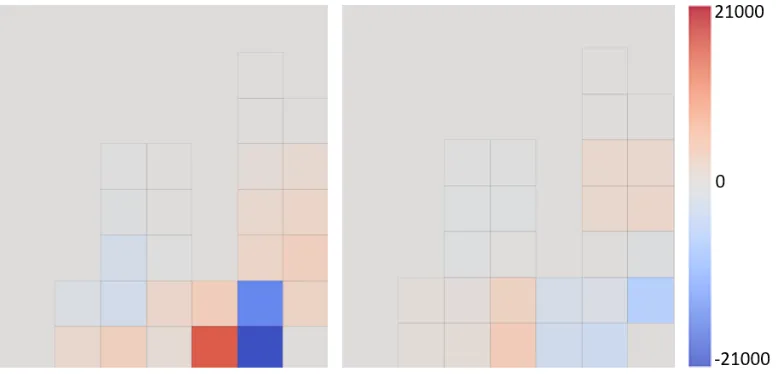
Figure 10 compares dwell times between crowd replication and visual surveillance. Left-hand side of the figure shows original crowd replicated values, whereas right-hand side shows smoothed estimates. From the figure we can see that both estimates generally align well with visual surveil-lance. However, we can also observe the original estimates to contain considerably higher errors in some regions. Indeed, highest errors result for the areas located around tall buildings where GPS errors result in dwell times being underestimated. In these cases, the values of the neighbouring cells tend to be overestimated, further exacerbating the dwell time errors. For smoothed estimators we do not observe these errors. Both estimates also correlate well with estimators derived from visual surveillance data, with the original estimates having correlationρ=0.93 and the smoothed estimates havingρ=0.98. Smoothing also reduces errors across the space as the median absolute deviation of grid cells drops from 1562 seconds to 822 seconds.
Fig. 11. Comparison of difference between aggregated dwell time derived using visual surveillance and by crowd replication. The left figure contains difference before smoothing, and right figure contains difference after smoothing.
Fig. 12. Boxplots for accuracy of step evaluation in first case, where we only evaluate over known walking periods. The left figure provides results per device placement with our approach, and right figure provides results for baseline with windowed peak detection.
cells is difficult and susceptible to human errors, especially when the user is located close to the border of two cells.
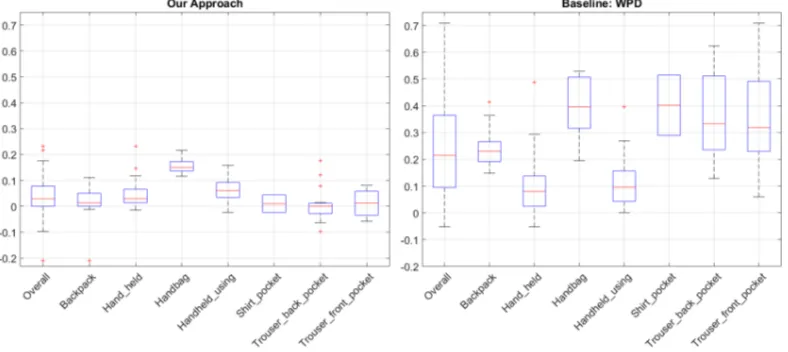
[image:22.486.55.441.358.495.2]Fig. 13. Box plots for accuracy of step evaluation in second case, where we evaluate entire trace and rely on walking detection to identify walking periods. The left figure provides results per device placement with our approach, and right figure provides results for baseline with windowed peak detection.
5.3 Accuracy of Pedestrian Modelling
We next assess the accuracy of our solution for pedestrian modelling and demonstrate that it outperforms current state-of-the-art techniques. As the trajectories collected from our experiments do not contain ground truth step counts, we carry out the evaluation using a benchmark dataset collected by Brajdic and Harle [7]. The dataset contains accelerometer measurements from walking behaviour which have been collected from 117 trials with 21 users. Ground truth is provided for 102 of these traces. The dataset covers 7 typical device placements and each trial features a period of fast, normal and slow walk. As the data only contains accelerometer measurements, we modify our pedestrian modelling by substituting gyroscope with accelerometer measurements smoothed with a centered moving average filter with a 10ms window length. For other parts our pedestrian modelling remains unchanged and follows the steps described in Sec. 3.2. We separately consider step recognition accuracy with and without walk detection. In the former case we consider traces that have been labelled as walking, and in the latter case we consider the full benchmark dataset. To provide a baseline for evaluation, we implemented the best performing techniques from the paper of Brajdic and Harle [7]. For step counting we implemented a windowed step detection algorithm, and for walk detection we used a threshold on overall acceleration (L2-norm). The best performance for the windowed step detection was obtained with parameter values MovAvrwin= 0.28s and PeakWinwin= 0.4s.
Work Effort Sample Data resolution Bias Privacy risks Data
richness Recommended for
Preparatio Data Analysis
Direct Observation small moderate large small fine grained small moderate rich Qualitative research (w/
demographic & activity data)
Visual surveillance
(manual coding) large moderate very large
large portion in
small area fine grained small high poor
Quantifying short trips in small spaces (exploratory analysis)
Visual surveillance
(computer vision) large moderate very small
large portion in
small area fine grained small high poor
Quantifying short trips in small spaces
Voluntary location tracking (GPS, GSM
or CDR)
large very small very small small portion in
large area less coarse mobile users small poor Quantifying city-wide journeys
Location surveillance (GSM or
CDR)
small very small very small good portion in
large area coarse mobile users high poor Quantifying city-wide journeys
Crowd sensing (wifi,
bluetooth, etc.) moderate small very small
large portion in
medium area less coarse mobile users high poor
Quantifying trips in large indoor spaces
Crowd replication small moderate very small
large portion in small or medium area
fine grained small moderate rich
Quantifying trips in neighborhood-scale spaces encompassing multiple
[image:24.486.56.423.126.341.2]streets (w/ demographic & activity data)
Fig. 14. Comparison of data collection methods.
technique is likely to perform even better for replicated data than the baseline. Current state-of-the-art step recognition approaches remain highly effective foronlinedetection. However, in crowd
replication all measurements can be analysed offline, which enables our approach to improve on step recognition performance.
The results across all segments, i.e., when step recognition needs to be combined with walking detection, are shown in Fig. 13. The error rate of our technique remains low, with handbag placement being the sole exception. Baseline performance, however, is significantly impacted by a high number of false positives. In particular, the baseline walk detection achieves only 21.5% accuracy, which would affect the total step count. Our approach is only slightly impacted by additional data, obtaining median overall accuracy of 4.1%, demonstrating the benefits and need for our pedestrian modelling approach. Indeed, the error rate of the state-of-the-art algorithms would significantly overestimate the amount of walking, and thus result in inaccurate indicators and activity estimates.
5.4 Comparison of Data Collection Effort
Figure 14 compares different approaches for data collection in terms of their work rate, effective sample size used for analysis, resolution of collected data, potential biases in the data collection, richness of the collected measurements, and severity of privacy risks. For work rate we further consider the level of effort in different phases of the study. The work effort for study preparation is generally larger for approaches requiring installation of appropriate equipment, recruiting volunteers, and obtaining necessary permissions. Compared to direct observation, our approach requires some additional steps in study preparation phase, as detailed in Sec 3. While the work effort is slightly larger compared to direct observation, it remains small compared to visual surveillance, voluntary location tracking or setting up a crowd sensing approach. The data collection phase in crowd replication requires moderate effort as data is collected by replicating each participant. Compared to visual observation, the work effort is still smaller since researcher’s location is automatically tracked and the mobile application interface facilitates inserting labels. Once correctly set, voluntary location tracking and location surveillance require small effort as data is mostly collected automatically. The data collection effort of visual surveillance is comparable to direct observation, requiring monitoring of the equipment and labelling any obstructions, e.g., camera becoming occluded due to traffic or severe weather. Work effort for analysis of the collected data is generally small across all considered approaches, with the exception of direct observations and manually decoded visual surveillance. In particular manually decoding the recorded video(s) can entail an almost overwhelming work effort. For example, detailed annotation of the 30 minute feed from our experiment required over 50 hours of manual labour and only produced aggregate level information of people using the space. Crowd sensing entails similar overall work effort with crowd replication, but suffers from potentially severe biases as only the subset of users with compatible technology (e.g., have a smartphone with WiFi or Bluetooth turned on) is captured, and no controlled sampling design can be applied. Additionally, crowd sensing entails high privacy risks and granularity of collected data is often coarse, making it difficult to obtain a detailed understanding of the urban space. Finally, location surveillance through cellular records has overall the smallest work effort, but can only capture information at coarse granularity.
Fig. 15. Spatial distribution of aggregate dwell time during weekdays for non-social activities (left), talking (middle), and dining (left).
the researcher, whereas crowd replication relies on the cluster sampling method to minimise the selection bias.
A central challenge with automated surveillance is that, while performance is generally good, it is not perfect. Indeed, automated surveillance can lead to errors which are particularly hard to observe or avoid due to the automated nature of the process. Manual annotation could be used to support the automated analysis, but this can lead to overwhelming work effort. In contrast, collecting the samples for crowd replication took 2−3 hours for four researchers (combined effort of 16 hours). As a hybrid option, existing techniques could well be used to complement crowd replication by automatically estimating total populationPor for obtaining scaling coefficients. As an example, in our test-case we combined direct observation about inactive (stationary) population with crowd replication data about active population, effectively capturing both subgroups with most time and resource efficient manner. Crowd replication can also be used to complement other techniques by providing finer detailed samples of the overall population flows, which could then be used as core data points for interpreting rest of the data.
To summarize, crowd replication is able to combine benefits from more resource and labour intensive methods, while requiring only commodity devices and a few active volunteers. Moreover, crowd replication lends itself for combined designs, thus providing a cost effective and easy-to-implement technique that can be used as standalone evaluation method or combined with other methods when even larger sample size or finer data granularity is required.
6 QUANTIFYING HUMAN BEHAVIOURS
The results of our evaluation thus far have validated the use of crowd replication as a data collection mechanism and demonstrated that it captures data that is representative of the key demographic characteristics and the considered activities of the target population. Next, we demonstrate how crowd replication can be used to extract indicators for assessing public space quality. Specifically, following Gehl’s categorization of activities within public spaces into necessary, optional, and social [17], we demonstrate that crowd replication captures spatiotemporally fine-grained indicators of all of these categories. To achieve this, we consider data from our three-hour trials T2 and T3 that took place within the central part of the overall area; see Section 4 for description of the area and Figure 6 for an illustration.
6.1 Fine-Grained Quantification of Activities
(a) Comparison of the spatial distributions of ag-gregated dwell time during weekdays (left) and weekends (right), and of slow walk (upper) and normal walk (lower).
0% 20% 40% 60% 80% 100%
Sta,onary Slow walk Walk Fast walk
No Social Ac,vity Talking Ea,ng/Drinking
(b) Ratio of different motion intensities i.e., fast walk, walk, slow walk, and stationary.
Fig. 16. Quantified fine-grained activities.
Indeed, presence of specific activities can suggests particular usage patterns and hence is essential for quantifying the human experience of public spaces. Also, diversity of activities is often considered important for a public space to be successful.
In our empirical evaluation, researchers used the mobile application to annotate observed activities such as talking, eating and playing, and subsequently recorded trajectories of the selected activities by following the crowd replication process. The data we collected thus allows us to map the spatial distribution and characteristics of social and other activities.
Figure 15 compares the spatial distributions of different activities during weekdays. Through correlation analysis, we found that the ratio of social activity in grid cells is correlated with group size very strongly during both weekdays and weekends, withr = .830,p < .001 andr =.809,
p < .001, respectively. On weekdays, they are also moderately correlated with stride duration with
r =.450,p< .001 and weakly correlated with the variance of heading withr =−0.263,p < .005.
Social activities can occur more frequently in a space where people walk more slowly with larger stride duration, and their direction of movements are more predictable. These results reinforce the common understanding that people walk slowly and linger about in socially vibrant spaces. However, thus far such observations have been based on qualitative measurements. The integration of sensing as part of crowd replication allows us to gather also quantitative evidence to support these kinds of observations.
[image:27.486.46.225.84.167.2]