Study on the Performance of Structural Systems with Vertical and Plan
Irregularity of RC Structures
Kiran kumar M
1, Dr. B Shivakumara Swamy
21
Student M.Tech, Department of civil Engineering, Dr AIT, Bengaluru, Karnataka, India
2
SProfessor, Department of Civil Engineering, Dr AIT, Bengaluru, Karnataka, India
---***---Abstract –
In recent days due to advance technology anddevelopment in economy of the nations in great way, it leads to Urbanization, industrialization. Due to this too many construction of tall structures, bridges of long span, dams are constructing irrespective seismic zones. So, the buildings which are constructed subjected to various loads but mainly they should design to resist seismic loads without any failure during earthquakes. For aesthetic view, due to scarcity of land area in city centers, modernization etc., leads to construct tall structures with Plan and Vertical irregularities. Irregular structures are more vulnerable compared to Regular structures. So, this research main objective is to study on the performance of structural systems with vertical and plan irregularity of G+11 RC structure with or without shear walls and infill walls. Response spectrum analysis is considered to get the response of the structures in medium soil type at seismic zones 2 and 5 using SAP2000 v 20.2.0. The plan irregular consider is Re-entrant corner type and Vertical geometric irregularity for vertical irregularity as per IS 1893-2002. Various parameters like storey displacement, Base shear and Storey drift values are calculated and compared by plotting graphs for each model for parameters above mentioned.
Key Words
:
Irregularities, Response spectrum
analysis, SAP2000 v 20.2.0, Shear wall, Infill wall
1. INTRODUCTION
The industrial revolution commenced from 1880. It leads to end of usage of handcrafted products and introduce mass production by machines. With this, steel mass production increases and innovation of the lift led the structural engineers to build their new dream world. Everyday life we have seen different types of structures from simple ones like lamp post to complex ones like Bridges, Multi storied building etc. Increase in population and scarcity in land leads to construction of tall structures in urban area in vertical instead horizontally
The designing of multi storied structures due to:
In urban area the lack or shortage of land
There is more interest for residential and office buildings.
The growth due to economy is high.
Due to the advancement of technology.
There is demand for aesthetic in urban areas
Due to modernization in structural systems
1.1 Objectives
The objectives of this study are as follows
To study the performance of a G+11 storey Plan regular, Plan irregular and Vertical irregular buildings.
The buildings are provided with shear wall and infill walls and the performance of different buildings are compared.
The parameters compared for the comparisons of results are Storey displacements, Storey drift and Base shear.
Response spectrum method is considered to get seismic response of the structure.
1.2 Methodology
In order to prevent building from severe damage during an earthquake, it is necessary for a structural engineer to design a structure for dynamic analysis and also for static analysis. Various parameters like Storey displacement, storey drift, and Base shear are obtained. Analysis of the models are done by using SAP2000 v 20.2.0 for Plan regular, Plan irregular and vertical irregularity by having with and without Shear wall and infill wall.
2. MODEL DETAILS
This study is conducted to get the response of G+11 storied RC frame structure. Investigation is carried out by taking Regular bare frame, Irregular bare frame and vertical geometric irregular frames having structural differences like with and without shear wall and infill walls. Analysis is carried out by taking dynamic loads. Response spectrum analysis is considered. At zone 2, Zone 5 obtaining the response of the structure by using SAP2000 v 20.2.0 software.
2.1Preliminary Data
International Research Journal of Engineering and Technology (IRJET)
e-ISSN: 2395-0056 Volume: 06 Issue: 10 | Oct 2019 www.irjet.net p-ISSN: 2395-0072Number of stories =G+11 Each storey height =3m
Column size =0.3X0.5m (300X500mm) Beam size =0.3X0.45m (300X450mm) Shear wall Thickness = 0.23m (230mm)
Infill wall Thickness =0.23m (230mm) Density of masonry infill =20kN\m^2.
Material used: M30 grade concrete, HYSD 500, Brick masonry
Slab thickness =150mm
Wall thickness(outer) =150mm (Masonry)
Self-weight of the building is automatically applied by SAP2000v 20.2.0
Main wall load = (0.23X(3-0.45) X20) =12kN/m^2 Partition wall load= (0.115X(3-0.45) X20) =6kN/m^2 For Seismic Zone 2
Importance Factor =1.0
Response reduction Factor =5
Site type =Medium (2)
Zone factor = 0.10 For seismic Zone 5
Importance Factor = 1.0
Response reduction factor =5
Site type=Medium (2)
Zone Factor=0.36
The description of the models 1 to 18 for analysis is presented in Table 1
Table -1: Description of the models
MODEL
NUMBER EARTH QUAKE ZONE
PLAN TYPE
STOREY DESCRIPTION
MODEL 1 ZONE 2 Plan regular
Bare frame
MODEL 2 ZONE 2 Plan regular
Frame with shear wall
MODEL 3 ZONE 2 Plan regular
Frame with infill wall
MODEL 4 ZONE 2 Plan irregular
Bare frame
MODEL 5 ZONE 2 Plan irregular
Frame with shear wall
MODEL 6 ZONE 2 Plan irregular
Frame with infill wall
MODEL 7 ZONE 2 Vertical irregular
Bare frame
MODEL 8 ZONE 2 Vertical irregular
Frame with shear wall
MODEL 9 ZONE 2 Vertical irregular
Frame with infill wall
MODEL 10
ZONE 5 Plan regular
Bare frame
MODEL 11
ZONE 5 Plan regular
Frame with shear wall
MODEL 12
ZONE 5 Plan regular
Frame with infill wall
MODEL 13
ZONE 5 Plan irregular
Bare frame
MODEL 14
ZONE 5 Plan irregular
Frame with shear wall
MODEL 15
ZONE 5 Plan irregular
Frame with infill wall
MODEL 16
ZONE 5 Vertical irregular
Bare frame
MODEL 17
ZONE 5 Vertical irregular
Frame with shear wall
MODEL 18
ZONE 5 Vertical irregular
Frame with infill wall
2.2 Architectural Plan for Regular building and
Models considered for the analysis
Fig 1 Plan of the Regular building
[image:2.595.310.558.475.665.2]3. ANALYSIS
Using Response spectrum method analysis is conducted for the buildings located in meduim(2) type soil ,seismic zones 2 and 5 using SAP2000 v 20.2.0 software
4. RESULTS AND DISCUSSIONS
Based on the results obtained for parameters like storey displacement, storey drift and Base shear by Response spectrum method for different models are considred in this study
[image:3.595.306.559.532.763.2]4.1 Displacement
International Research Journal of Engineering and Technology (IRJET)
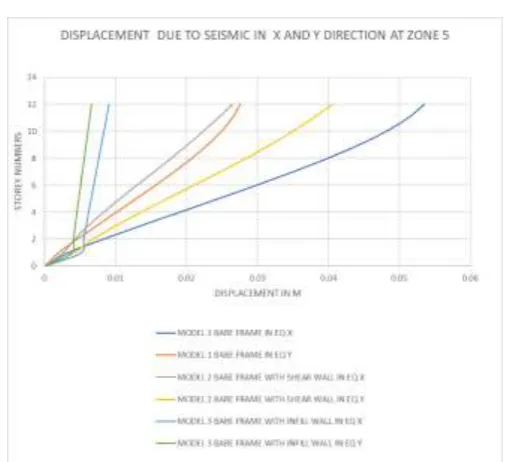
e-ISSN: 2395-0056 Volume: 06 Issue: 10 | Oct 2019 www.irjet.net p-ISSN: 2395-0072Fig 11 shows the plots of storey displacement of structure in X and Y direction from Model 1 to Model 3 v/s Storey numbers. The above values are obtained by Response spectrum analysis for seismic zone 5. The highest displacement found to be 53.529mm in Model 1(Regular bare frame) in X direction and 40.62mm in Model 2 (Regular frame with shear wall) in Y direction.
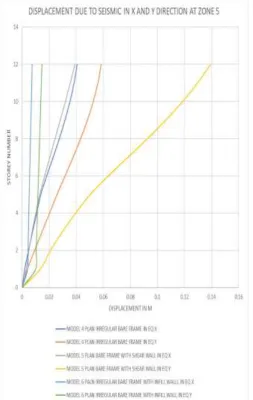
[image:4.595.309.569.66.495.2] [image:4.595.37.291.194.595.2]Fig 12 Displacement in seismic X and Y direction at zone 5 Fig 12 shows the plots of storey displacement of structure in X and Y direction from Model 4 to Model 6 v/s Storey numbers. The above values are obtained by Response spectrum analysis for seismic zone 5. The highest displacement found to be 40.57mm in Model 4(Plan irregular bare frame) in X direction and 139.37 mm in Model 5 (Plan irregular frame with shear wall) in Y direction.
Fig 13 Displacement in seismic X and Y direction at zone 5 Fig 13 shows the plots of storey displacement of structure in X and Y direction from Model 7 to Model 9 v/s Storey numbers. The above values are obtained by Response spectrum analysis for seismic zone 5. The highest displacement found to be 40.476mm in Model 7(vertical irregular bare frame) in X direction and 59.663mm in Model 7 (Vertical irregular bare frame) in Y direction.
4.2 Storey drift
Fig 14
Storey drift in seismic X and Y direction at Zone 5 [image:5.595.35.290.337.620.2]Fig 15
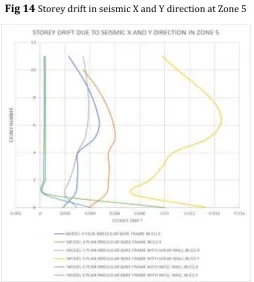
Storey drift in seismic X and Y direction at Zone 5Fig 15 shows the plots of storey drift v\s storey numbers of structure in X and Y direction from Model 4 to Model 6, the above values are obtained by Response spectrum analysis for seismic zone 5. The maximum storey drift found to be 4.709mm in Model 4(plan irregular bare frame) in X direction and 1.4395mm in Model 5(plan irregular frame with shear wall) in Y direction.
Fig 16
Storey drift in seismic X and Y direction at Zone 5Fig 16 shows the plots of storey drift v\s storey numbers of structure in X and Y direction from Model 7 to Model 9, the above values are obtained by Response spectrum analysis for seismic zone 5. The maximum storey drift found to be 4.615mm in Model 7(Vertical irregular bare frame) in X direction and 5.691mm in Model 7(Vertical irregular bare frame) in Y direction.
4.3 Base shear
Fig 17
Graph of Maximum Base shear along X and Y [image:5.595.306.559.546.739.2]International Research Journal of Engineering and Technology (IRJET)
e-ISSN: 2395-0056 Volume: 06 Issue: 10 | Oct 2019 www.irjet.net p-ISSN: 2395-0072Fig 17 shows the plot between Models from 1 to 9 in X axis and maximum Base shear in Y axis for seismic zone 2. The highest base shear value is 1270kN is occurred in Model 3 Regular frame with infill in seismic Zone 2 for X direction. 847kN is occurred in Model 5 Plan irregular bare frame with shear wall.
Fig 18
Graph of Maximum Base shear along X and Ydirection at Zone 5
Fig 18 shows the plot between Models from 1 to 9 in X axis and maximum Base shear in Y axis for seismic zone 5. The highest base shear value is 4436kN is occurred in Model 3 Regular frame with infill in seismic Zone 2 for X direction. 3085Kn is occurred in Model 5 Plan irregular frame with shear wall.
5. Conclusions
From this study on the performance of structural systems with Vertical and Plan irregularity of RC structures following conclusion are drawn.
Displacement value of all the models is less at the bottom stories and keep on increasing for higher storeys.
Masonry infill walls help in increasing the strength of the structure.
Models provided with infill walls be the most advantageous in the reduction of storey displacement, storey drift and base shear when compared to all other models.
Seismic response of Regular structure is better in comparison with all other irregular buildings due to their discontinuity along the height of the building.
Structural response is better by inclusion of shear wall and infill compared to bare frame model.
6. Future scope of study
Time history analysis and Push over analysis can be performed.
Buildings can be analysed for large storey numbers.
Dampers can be placed at different locations and analysed.
Buildings can analyse for different soil conditions and seismic zones.
The location of the shear wall can be changed and studied.
Other type of irregularities can be considered and analyse.
The analyses can be done by using different software like ETABS, STAAD PRO.
REFERENCES
[1] V V Diware and A C Saoji, “Seismic assessment of symmetrical RC structure with Brick Masonry Infills”, www.ijera.com Volume 2; Issue 3; May-June 2012; ISSN:25248-9622.
[2] Chaitra H N and Dr. B ShivakumaraSwamy, “Study on performance of Regular and Vertically Irregular structure with Dampers, Shear wall and Infill wall”, www.irjet.net Volume 3; Issue 10; October-2016; ISSN:2395-0056. [3] Anushri C and Dr. B ShivakumaraSwamy, “Study on performance of Regular and L shape Plan Irregular building with Dampers, Shear wall and Infill wall”, www.irjet.net Volume 3; Issue 10; October-2016; ISSN-2395-0056. [4] Rahul and Shivanand C G, “Study of vertical irregularity of tall structures under lateral load”, www.irjet.net Volume 4; Issue 8; August-2017; ISSN:2395-0056.
[5] Nilesh patil, Aniket chougule, Harshavardhan Patil, Umesh Shinde, Vivek Pawar and Prof. Rushank Patil, “Earthquake Analysis of RC building with and without Infill wall”, www.irjet.net volume 6; Issue-3; March 2019; ISSN:2395-0056.
[6] SnehaRajesahebMagar, D H Tupe and G R Gandhe, “Comparative analysis between Static and Nonlinear dynamic analysis of Irregular and regular building”, www.iosrjen.org Volume 7; Issue 11; November 2017; ISSN:2250-3021.
ETABS”, www.irjet.net Volume 6;Issue 3; March 2019; ISSN-2395-0056.
[8] Rajat Singh and Mohd. Adnan, “Seismic Analysis of Buildings with Shear Wall having Horizontal Irregularity”, www.irjet.net Volume 06; Issue 03; March 2019; ISSN-2395-0056.
[9] Resmitha Rani Antony and Dr. P R Sreemahadevan Pillai, “Effect of Vertical Irregularities on Seismic Performance of RC Buildings”, www.ijser.org Volume 7; Issue 10; October 2016; ISSN 2229-5518.
[10] Mr. Sagar B Patil and Prof. Gururaj B. Katti, “Study of Behaviour of Plan and Vertical Irregularity by Seismic Analysis”, www.ijsrd.com Volume 3; Issue 4; 2015; ISSN 2321-0613.
[11] IS: 1893 (Part 1):2002 Criteria for earthquake resistant design of structures.
[12] IS: 456-2000 plain and reinforced concrete code of practice.
[13] IS: 875-1987 (part 1 to part 5) Code of Practice for Design Loads.