ISSN Online: 2333-9721 ISSN Print: 2333-9705
Protein Extraction from Grape Seeds by
Reverse Micelles: Optimization of the
Forward Extraction
Xifeng Zhang
1,2, Yunyun Hou
1, Fenqin Zhang
1,2*, Guanghong Luo
1,2*1The College of Agriculture and Biotechnology (CAB), Hexi University, Zhangye, China 2Key Laboratory of Hexi Corridor Resources Utilization of Gansu, Zhangye, China
Abstract
The optimization of the reverse micelles extraction of protein from grape seeds was carried out using response surface methodology (RSM). Based on the Plackett-Burman design and steepest ascent, CTAB concentration, pH, NaCl concentration and crude protein concentration were selected as the most extract conditions. Subsequently, the optimum combination of the se-lected factors was investigated by the Box-Behnken design. The final condi-tion of extraccondi-tion optimized with RSM was CTAB concentracondi-tion 39 mmol/L, pH 5.6, NaCl concentration 0.01 mol/L, and crude protein concentration 2.1 mg/mL. The forward extraction yield of 82.3% in triplicate under optimal ex-traction condition was obtained.
Subject Areas
Food Science & Technology
Keywords
Reverse Micelles, Response Surface Methodology,Grape Seeds, Protein
1. Introduction
The grape is one of the major fruit crops worldwide and its harvest is about 60 million tonnes per year [1]. About 80% of the harvest is utilized for winemaking and the grape waste consists the 20% of the weight of processed grapes. Howev-er, winemaking leads to the generation of large quantities of wastes, which con-siderably increase the chemical oxygen demand (COD) and the biochemical oxygen demand (BOD5) due to a high pollution load (high content of organic substances such as sugars, tannins, polyphenols, polyalcohols, pectins and lipids) How to cite this paper: Zhang, X.F., Hou,
Y.Y., Zhang, F.Q. and Luo, G.H. (2017) Protein Extraction from Grape Seeds by Reverse Micelles: Optimization of the For- ward Extraction. Open Access Library Jour- nal, 4: e3376.
https://doi.org/10.4236/oalib.1103376
Received: January 13, 2017 Accepted: June 5, 2017 Published: June 8, 2017
Copyright © 2017 by authors and Open Access Library Inc.
This work is licensed under the Creative Commons Attribution International License (CC BY 4.0).
with detrimental effects on the flora and fauna of discharged zones [2].
Therefore, treatment and disposal of winery waste are serious environmental problems and winery waste must find another use other than as animal feed or as fertilizers.
Grape seeds are the primary main byproducts of viniculture and fermentation. In the last few years, increased attention has been focused on industrial wastes that are rich source of polyphenolic compounds, flavonoids, protein and oil [3] [4][5][6]. Grape seeds extract in particular show interesting biological proper-ties, such as antioxidant, anticancer, anti-inflammation, anti-aging and an-ti-bacterical activities [2] [7]-[12].
Grape seeds have relatively high content of protein (13% - 18%), which can be extracted by conventional procedures such as solvent extraction and isoelectric precipitation [13][14][15]. However, this method has some fatal defects: a great deal of wastewater is produced which causes serious environmental pollution and it is also limited capacity of raw material treatment and high consumption of acid and alkali. Moreover, it is easy to cause protein denaturation. Therefore, it is imperative to explore an alternative extraction approach of grape seeds pro-teins.
The reverse micelles extraction is a novel separation technology with prospect for separating bio-product. Reverse micelles are aggregates of surfactant cules spontaneously in non-polar solvents. The aggregates of surfactant mole-cules contain an inner core of water molemole-cules and are dispersed in a continuous organic solvent medium. The bio-molecules can be transferred from the aqueous phase to the polar core of reverse micelles without loss in activity [16], mainly because of the attractive electrostatic interaction between the inner micelle charge wall and the bio-molecules. Optimization of extraction conditions has been used in enhancing the yield of many proteins [17] [18] [19] [20] [21]. However, there is no literature reported to optimize the extraction conditions for grape seeds protein using reverse micelles. Thus, the main aim of the present work was to optimize the conditions for proteins extraction by reversed micelles from grape seeds. The objective of this study was to develop an alternative ex-traction method of grape seeds protein by reverse micelles, and to investigate the effects of factors (CTAB concentration, extraction time, crude protein concen-tration, temperature, NaCl concenconcen-tration, pH, alkyl alcohol than) on the forward extraction efficiency of grape seeds protein. Response surface methodology (RSM) was used to optimize the extraction conditions for enhancing the forward extraction efficiency of grape seeds protein by implementing the Box-Behnken experimental design [22].
2. Materials and Methods
2.1. Materials
Reagent Factory of Tianjin, Chin. Other materials used in this study were of analytical grade.
2.2. Sample Preparation
Grape seeds were selected manually and cleaned to remove contaminants. Grape seeds were milled using a small scale hammer mill (FZ-102, Hebei province, China), and the resulting flour was sieved through a 200-mesh screen. Grape seeds power was defatted with n-hexane for 10 h and air-dried at room temper-ature (about 20˚C) by Soxhlet extraction. The power was kept in polyethylene bags and stored at 4˚C until used.
2.3. Extraction of Crude Protein
Defatted grape seeds power was soaked by 0.2 mol/L citric acid-sodium hydro-gen phosphate buffer solution at pH 6.0 for 1 h. The solution and residue were isolated by a centrifuge at a rolling speed of 4000 rpm and 4˚C for 10 min. The crude protein was collected.
2.4. Reversed Micellar Extraction
The reversed micelles systems were formed by Ceryl-trimethyl-ammonium bromide (CTAB), methenyl trichoride and butyl alcohol. The aqueous solutions were crude protein after centrifugation. Sodium chloride was added to the aqueous solution to adjust the ionic strength. For the forward extraction, equal volumes of the reverse micellar systems (the organic solution) and aqueous solu-tion were mixed in a test tube in a reciprocating shaker bath for various time pe-riods and temperatures. The mixture was then centrifuged at 1500 g for 5 min to separate the two phases. The aqueous phase was then taken for analysis. All the experiments were carried out in duplicate.
2.5. Protein Determination [23]
Protein concentration in water phase was determined by UV-Vis spectrophoto-meter (LabTech UV-2100, Beijing). BSA was used as standard, and the results were expressed as BSA equivalents. The forward-extraction efficiency was calcu-lated as follows.
(
)
Forward-extraction efficiency Y%
total protein in the supernatant total protein in aqueous solution 100% total protein in the supernatant
−
= ×
2.6. Screening of the Forward Extraction Conditions Using a
Plackett-Burman Design
variable was simply calculated as the difference between the average of mea-surements made at the high setting and the average of meamea-surements observed at the low setting of that factor.
2.7. Steepest Ascent
After selecting the most important factor affecting the forward extraction yield in the screening study, the steepest ascent method was used to construct a line through the center of the design [25], due to the contribution obtained by Plack-ett-Buman design. Consequently, some experiments were implemented along this line with intervals, and the response at each point was measured. If a maxi-mum value is found, that point could be employed as the center point for the following optimization experimental design.
2.8. Optimization of the Forward Extraction Conditions Using a
Box-Behnken Design
Once critical factors were identified via screening, a Box-Behnken design for the most important independent variables (CTAB concentration, pH, NaCl con- centration, crude protein concentration). Each at three levels with three repli-cates at the centre points was employed to fit a polynomial model:
2 0
i i i ii i ij i j
Y =
β
+∑
β
X +∑
β
X +∑
β
X X (1)where Yiis the predicted response, XiXj are input variables which influence the response variable Y; β0 is the offset term; βi is the ith linear coefficient; βii
is the iith quadratic coefficient and βij is the ijth interaction coefficient. Design
expert package (version 7.0, Stat-Ease, Inc., Minneapolis, MN, USA) was used for the experimental design and regression analysis of the data obtained.
3. Results and Discussion
3.1. Screening of the Forward Extraction Conditions Using a
Plackett-Burman Design
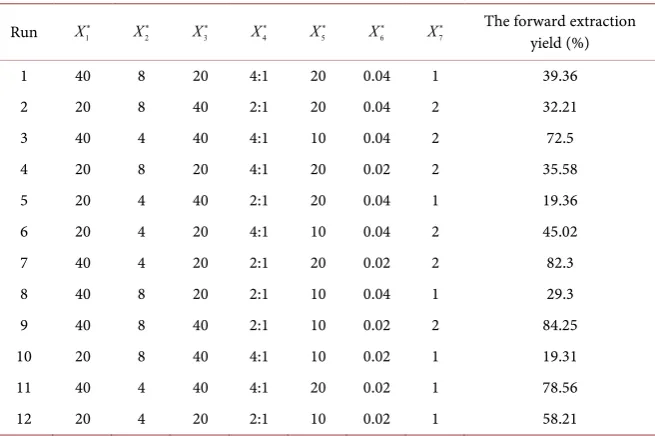
Based on the earlier studies, a total of seven variable conditions were analyzed for their effect on forward extraction using a Plackett-Burman design. The va-riables chosen for the present study were CTAB concentration, pH, extraction temperature, alkyl alcohol than, extraction time, NaCl concentration and crude protein concentration. All the variables were denoted as numerical factors and investigated at two widely spaced intervals designated as −1 (low level) and +1 (high level). The yield of forward-extraction, determined for each experimental design was shown in Table 1. The analysis of variance (ANOVA) for the expe-rimental designs was calculated, and the significant levels of each extraction condition were determined by p-value (Table 2). The analysis showed that CTAB concentration (X1), pH (X2), NaCl concentration (X6), crude protein con-centration (X7) had p-value below the significance level (0.05). Therefore, they were estimated to be significant (Table 2). The final equation is as follows:
1 2 6 7
49.6633 14.715 9.66167 10.0383 8.98
Table 1. The experimental design using the Plackett-Burman method for screening of forward extraction conditions.
Run X1
∗
2
X∗
3
X∗
4
X∗
5
X∗
6
X∗
7
X∗ The forward extraction yield (%) 1 40 8 20 4:1 20 0.04 1 39.36 2 20 8 40 2:1 20 0.04 2 32.21 3 40 4 40 4:1 10 0.04 2 72.5 4 20 8 20 4:1 20 0.02 2 35.58 5 20 4 40 2:1 20 0.04 1 19.36 6 20 4 20 4:1 10 0.04 2 45.02 7 40 4 20 2:1 20 0.02 2 82.3 8 40 8 20 2:1 10 0.04 1 29.3 9 40 8 40 2:1 10 0.02 2 84.25 10 20 8 40 4:1 10 0.02 1 19.31 11 40 4 40 4:1 20 0.02 1 78.56 12 20 4 20 2:1 10 0.02 1 58.21
*X1: CTAB concentration (mmol/L); X2: pH; X3: Extraction temperature (˚C); X4: alkyl alcohol than (V:V);
X5: Extraction time (min); X6: NaCl concentration (mol/L); X7: Crude protein concentration (mg/mL).
Table 2. Statistical analysis of Plackett-Burman design.
Source Squares Sum of Degree of freedom Square Mean Value F Prob > F
Model 5895.451 4 1473.863 15.16151 0.0015 X1 2598.375 1 2598.375 26.72928 0.0013
X2 1120.174 1 1120.174 11.52314 0.0115
X6 1209.218 1 1209.218 12.43913 0.0096
X7 967.6848 1 967.6848 9.9545 0.0160
Residual 680.4755 7 97.21079 Cor Total 6575.926 11
R2 = 0.896.
The multiple correlation coefficient (R2) of this first-order model is 0.896, which means that 89.6% of the data variation can be evaluated by the model. However, the difference between the adjusted R2 value (83.7%) and the predicted R2 value (69.6%) revealed that a first-order model is not an adequate mathemat-ical equation for demonstrating the relationship between the significant inde-pendent variables and the response. Therefore, a second-order model should be employed for further investigation.
[image:5.595.207.539.374.516.2]beyond the experimental ranges chosen for the Plackett-Burman design. There-fore, the steepest ascent method should be used. All the other insignificant va-riables were neglected and optimum combinations of these four were further analyzed by a steepest ascent design.
3.2. Steepest Ascent
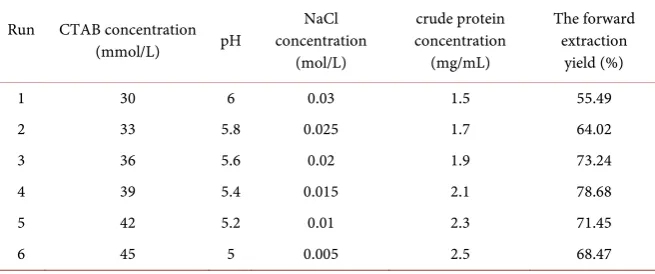
The steepest ascent method was used to construct a line through the center of the design, due to the contribution obtained by Plackett-Burman first-order eq-uation. Consequently, some experiments were implemented along this line with defined intervals, and the response at each point was measured. If a maximum value is found, that point could be employed as the center point for the following optimization experimental design. These results are summarized in Table 3.
3.3. Further Optimization of the Extraction Conditions Using a
Box-Behnken Design
3.3.1. Statistical Analysis and Model Fitting
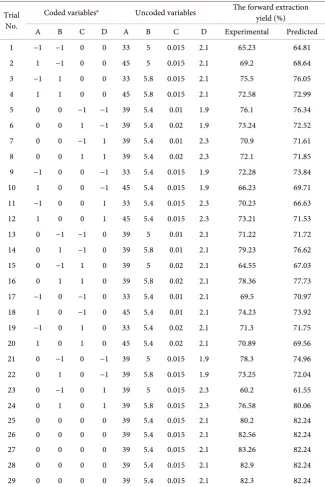
Experiments were carried out in duplicates to arrive at an optimum combination of the four conditions above using Box-Behnken design. Based on the results of steepest ascent experiments, Table 4 gave the design and results of experiments carried out by the Box-Behnken design. The results obtained were submitted to ANOVA on Design-expert 7.0 package and the regression model was given as
2 2 2 2
82.244 0.1917 3.9 0.895 1.3483 1.7225 1.285 2.2575 1.45 5.3575 1.015
6.6749 4.9474 4.019 5.145
Y A B C D AB AC
AD BC BD CD
A B C D
= + + − − − −
+ + + +
− − − −
(3)
1) Analysis of variance (ANOVA) for the extraction yield of grape seeds pro-tein
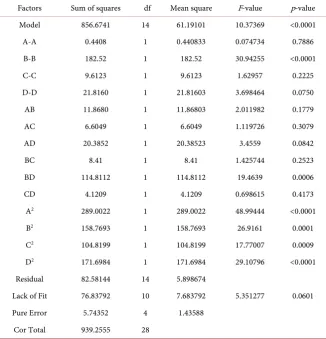
The analysis of variance (ANOVA) was conducted to test the significance of the fit of the second-order polynomial equation for the experimental data as shown in Table 5. The Model F-value of 10.37 implies the model is significant. There is only a 0.01% chance that a “Model F-value” could occur due to noise. The P-values are used as a tool to check significance of each variable, which also indicate the interaction strength between each independent variable. The smaller
[image:6.595.209.537.600.737.2]P-values, the bigger the significance of the corresponding variable. P-values in
Table 3. Design and data from the steepest ascent experiment.
Run CTAB concentration (mmol/L) pH
NaCl concentration
(mol/L)
crude protein concentration (mg/mL)
The forward extraction
yield (%)
1 30 6 0.03 1.5 55.49
2 33 5.8 0.025 1.7 64.02
3 36 5.6 0.02 1.9 73.24
4 39 5.4 0.015 2.1 78.68
5 42 5.2 0.01 2.3 71.45
Table 4. Box-Behnken experimental design and results for protein extraction yield.
Trial No.
Coded variablesa Uncoded variables The forward extraction
yield (%) A B C D A B C D Experimental Predicted 1 −1 −1 0 0 33 5 0.015 2.1 65.23 64.81 2 1 −1 0 0 45 5 0.015 2.1 69.2 68.64 3 −1 1 0 0 33 5.8 0.015 2.1 75.5 76.05 4 1 1 0 0 45 5.8 0.015 2.1 72.58 72.99 5 0 0 −1 −1 39 5.4 0.01 1.9 76.1 76.34 6 0 0 1 −1 39 5.4 0.02 1.9 73.24 72.52 7 0 0 −1 1 39 5.4 0.01 2.3 70.9 71.61 8 0 0 1 1 39 5.4 0.02 2.3 72.1 71.85 9 −1 0 0 −1 33 5.4 0.015 1.9 72.28 73.84 10 1 0 0 −1 45 5.4 0.015 1.9 66.23 69.71 11 −1 0 0 1 33 5.4 0.015 2.3 70.23 66.63 12 1 0 0 1 45 5.4 0.015 2.3 73.21 71.53 13 0 −1 −1 0 39 5 0.01 2.1 71.22 71.72 14 0 1 −1 0 39 5.8 0.01 2.1 79.23 76.62 15 0 −1 1 0 39 5 0.02 2.1 64.55 67.03 16 0 1 1 0 39 5.8 0.02 2.1 78.36 77.73 17 −1 0 −1 0 33 5.4 0.01 2.1 69.5 70.97 18 1 0 −1 0 45 5.4 0.01 2.1 74.23 73.92 19 −1 0 1 0 33 5.4 0.02 2.1 71.3 71.75 20 1 0 1 0 45 5.4 0.02 2.1 70.89 69.56 21 0 −1 0 −1 39 5 0.015 1.9 78.3 74.96 22 0 1 0 −1 39 5.8 0.015 1.9 73.25 72.04 23 0 −1 0 1 39 5 0.015 2.3 60.2 61.55 24 0 1 0 1 39 5.8 0.015 2.3 76.58 80.06 25 0 0 0 0 39 5.4 0.015 2.1 80.2 82.24 26 0 0 0 0 39 5.4 0.015 2.1 82.56 82.24 27 0 0 0 0 39 5.4 0.015 2.1 83.26 82.24 28 0 0 0 0 39 5.4 0.015 2.1 82.9 82.24 29 0 0 0 0 39 5.4 0.015 2.1 82.3 82.24
aA: CTAB concentration (mmol/L), B: pH, C: NaCl concentration (mol/L), D: Crude protein concentration
(mg/mL).
Table 5. ANOVA for response surface quadratic model for protein extraction field.
Factors Sum of squares df Mean square F-value p-value Model 856.6741 14 61.19101 10.37369 <0.0001 A-A 0.4408 1 0.440833 0.074734 0.7886 B-B 182.52 1 182.52 30.94255 <0.0001 C-C 9.6123 1 9.6123 1.62957 0.2225 D-D 21.8160 1 21.81603 3.698464 0.0750 AB 11.8680 1 11.86803 2.011982 0.1779 AC 6.6049 1 6.6049 1.119726 0.3079 AD 20.3852 1 20.38523 3.4559 0.0842 BC 8.41 1 8.41 1.425744 0.2523 BD 114.8112 1 114.8112 19.4639 0.0006 CD 4.1209 1 4.1209 0.698615 0.4173 A2 289.0022 1 289.0022 48.99444 <0.0001
B2 158.7693 1 158.7693 26.9161 0.0001
C2 104.8199 1 104.8199 17.77007 0.0009
D2 171.6984 1 171.6984 29.10796 <0.0001
Residual 82.58144 14 5.898674
Lack of Fit 76.83792 10 7.683792 5.351277 0.0601 Pure Error 5.74352 4 1.43588
Cor Total 939.2555 28
experimental values.
3.3.2. Analysis of Response Surface
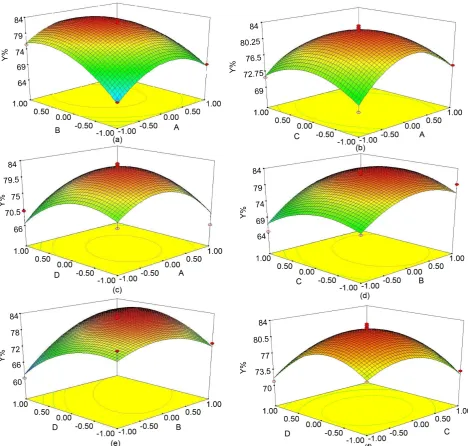
Response surface plots are shown in Figure 1, which depict the interactions be-tween two variables by keeping the other variables at their zero levels for forward extraction yield. The effect of CTAB concentration and pH on the yield of ex-tracted grape seeds protein is shown in Figure 1(a).
Figure 1(b) represents the interaction between CTAB and NaCl concentra-tion. Lower and higher levels of both CTAB and NaCl concentration did not re-sult in higher forward extraction yields. The shape of the response surface curves showed a moderate interaction between these tested variables.
Figure 1(c) depicts the interaction of CTAB concentration and crude protein concentration where the shape of the response surface indicated no positive in-teraction between these two factors.
Figure 1(d) shows the effects of pH and concentration of NaCl on the for-ward extraction yield of grape seeds protein. This result showed that pH changes were more effective than NaCl concentration changes for yield extraction.
Figure 1. The response surface plot showing the effects of the forward extraction parameters on grape seeds protein yield. (a) at varying CTAB concentration (A) and pH (B), (b) at varying CTAB concentration (A) and NaCl concentration (C), (c) at varying CTAB concentration (A) and crude protein concentration (D), (d) at varying pH (B) and NaCl concentration (C), (e) at varying pH (B) and crude protein concentration (D), (f) at varying NaCl concentration (C) and crude protein concentration (D).
3.3.3. Optimum Conditions and Model Verification
In order to optimize processing conditions of grape seeds protein extraction , the first partial derivatives of the regression model were equated to zero according to A, B, C and D. From the model, optimum conditions for grape seeds protein ex-traction were prepared as follows: CTAB concentration 38.84 mmol/L, NaCl concentration 0.01 mol/L, crude protein concentration 2.12 mg/mL. The pH of the aqueous phase was 5.58. Under such conditions, the yield of forward extrac-tion process was predicted to be 83.06%.
CTAB concentration 39 mmol/L, NaCl concentration 0.01 mol/L, crude protein concentration 2.1 mg/mL. The pH of the aqueous phase was 5.6. A mean value of 82.3% (N = 3) was obtained from real experiment. The results of analysis con-firmed that the response model was adequate for reflecting the expected optimi-zation, and the model of Equation (3) was satisfactory and accurate.
4. Conclusion
The data presented in this article demonstrate the feasibility of the forward ex-traction of protein from grape seedsby reverse micelles. Based on the Plackett- Burman design and steepest ascent, response surface methodology (RSM) was used to estimate and optimize the experimental variables: CTAB concen- tration, pH, NaCl concentration and crude protein concentration. The optimal forward extraction conditions for grape seeds protein by reverse micelles were deter-mined as follows: CTAB concentration 39 mmol/L, NaCl concentration 0.01 mol/L, crude protein concentration 2.1 mg/mL; the pH of the aqueous phase was 5.6. Under these conditions, the forward extraction yield of grape seeds protein was 82.3%, which was closed with the predicted yield value. The data presented in this article demonstrate the feasibility of the forward extraction of protein from grape seeds by reverse micelles. Reverse micelles extraction was an efficient method compared to conventional solvent extraction. These results demon-strated the successful extraction of protein with Reverse micelles extraction, pro-viding potential benefits for industrial extraction of protein from grape seeds.
Acknowledgements
This work has been supported by the Gansu provincial innovation foundation for technology based firms (No. 1047GCCG001), and by President Foundation of Hexi University (No. XZ2014-29).
Conflict of Interest
The authors declared that they have no conflicts of interest to this work. We declare that we do not have any commercial or associative interest that re- presents a conflict of interest in connection with the work submitted.
References
[1] Schieber, A., Stintzing, F.C. and Carle, R. (2001) By-Products of Plant Food Pro- cessing as a Source of Functional Compounds-Recent Developments. Trends in Food Science and Technology, 12, 401-413.
https://doi.org/10.1016/S0924-2244(02)00012-2
[2] Laurent, C., Besancon, P. and Caporiccio, B. (2007) Flavonoids from a Grape Seed Extract Interact with Digestive Secretions and Intestinal Cells as Assessed in an in Vitro Digestion/Caco-2 Cell Culture Model. Food Chemistry, 100, 1704-1712. https://doi.org/10.1016/j.foodchem.2005.10.016
https://doi.org/10.2298/JSC100519131G
[4] Lafka, T.I., Sinanoglou, V. and Lazos, E.S. (2007) On the Extraction and Antioxi-dant Activity of Phenolic Compounds from Winery Wastes. Food Chemistry, 104, 1206-1214. https://doi.org/10.1016/j.foodchem.2007.01.068
[5] Ozcan, M.M., Unver, A., Gümüş, T. and Akin, A. (2012) Characteristics of Grape Seed and Oil from Nine Turkish Cultivars. Natural Product Research, 26, 2024- 2029. https://doi.org/10.1080/14786419.2011.631133
[6] Zhou, T., Zhang, T., Liu, W.Y. and Zhao, G.H. (2011) Physicochemical Characteris-tics and Functional Properties of Grape (Vitis vinifera L.) Seeds Protein. Interna-tional Journal of Food Science and Technology, 46, 635-641.
https://doi.org/10.1111/j.1365-2621.2010.02532.x
[7] Vincenzi, S., Dinnella, C., Recchia, A., Monteleone, E., Gazzola, D., Pasini, G. and Curioni, A. (2013) Grape Seed Proteins: A New Fining Agent for Astringency Re-duction in Red Wine. Australian Journal of Grape & Wine Research, 19, 153-160. https://doi.org/10.1111/ajgw.12030
[8] Ozvural, E.B. and Vural, H. (2014) Which Is the Best Grape Seed Additive for Frankfurters: Extract, Oil or Flour? Journal of the Science of Food and Agriculture, 94, 792-797. https://doi.org/10.1002/jsfa.6442
[9] Sung, J. and Lee, J. (2010) Antioxidant and Antiproliferative Activities of Grape Seeds from Different Cultivars. Food Science and Biotechnology, 19, 321-326. https://doi.org/10.1007/s10068-010-0046-6
[10] Shaker, E.S. (2006) Antioxidative Effect of Extracts from Red Grape Seed and Peel on Lipid Oxidation in Oils of Sun Flower. LWT-Food Science and Technology, 39, 883-892. https://doi.org/10.1016/j.lwt.2005.06.004
[11] Amico, V., Napoli, E.M., Renda, A., Ruberto, G., Spatafora, C. and Tringal, C. (2004) Constituents of Grape Pomace from the Sicilian Cultivar “Nerello Masca-lese”. Food Chemistry, 88, 599-607. https://doi.org/10.1016/j.foodchem.2004.02.022 [12] Stankovi, M., Tesevi, V., Vajs, V., Todorovi, N., Milosavljevi, S. and Godevac, D.
(2008) Antioxidant Properties of Grape Seed Extract on Human Lymphocyte Oxid-ative Defence. Planta Medica, 74, 730-735. https://doi.org/10.1055/s-2008-1074521 [13] Zhao, Y.M. (2009) Study on Extraction Technics of Protein from Grape Seed.
He-nan Science, China, 27, 1229-1232.
[14] Li, F.Y., Cui, R.J. and Li, C.H. (2005) Extraction of Protein from Grape Seed. China Oil and Fats, China, 30, 50-53.
[15] Ye, R., Ma, B.Y. and Mou, D.H. (2009) Study on Extraction Technics of Protein from Degreased Grape Seed. Sino-Overseas Grapevine & Wine, China, 1, 17-21. [16] Hilhorst, R., Fijneman, P., Heering, D., Wolbert, R.B.G., Dekker, M., Riet, K.V. and
Bijsterbosch, B.H. (1992) Protein Extraction Using Reversed Micelles. Pure and Ap-plied Chemistry, 64, 1765-1770. https://doi.org/10.1351/pac199264111765
[17] Leser, M.E., Luisi, P.L. and Palmieri, S. (1989) The Use of Reverse Micelles for the Simultaneous Extraction of Oil and Proteins from Vegetable Meal. Biotechnology and Bioengineering, 34, 1140-1146. https://doi.org/10.1002/bit.260340904
[18] Lye, G.J., Asenjo, J.A. and Pyle, D.L. (1994) Protein Extraction Using Reverse Mi-celles: Kinetics of Protein Partitioning. Chemical Engineering Science, 49, 3195- 3204. https://doi.org/10.1016/0009-2509(94)00147-2
[20] Zhao, J.T. (2001) Study on the Use of Reverse Micelle for the Simultaneous Extrac-tion Oil and Protein. Journal of Zhengzhou University of Technology, China, 22, 54-56.
[21] Sun, X.H., Zhu, K.X. and Zhou, H.M. (2008) Protein Extraction from Defatted Wheat Germ by Reverse Micelles: Optimization of the Forward Extraction. Journal of Cereal Science, 48, 829-835. https://doi.org/10.1016/j.jcs.2008.06.006
[22] Box, G.E.P. and Behnken, D.W. (1960) Some New Three Level Designs for the Study of Quantitative Variables. Technometrics, 2, 455-475.
https://doi.org/10.1080/00401706.1960.10489912
[23] Liu, Y.Q. (2008) Experiment in Bioseparation Engineering. Higher Education Press, Beijing.
[24] Naveena, B.J., Altaf, M., Bhadriah, K. and Reddy, G. (2005) Selection of Medium Components by Plackett-Burman Design for Production of L(+) Lactic Acid by Lactobacillus amylophilus GV6 in SSF Using Wheat Bran. Bioresource Technology, 96, 485-490. https://doi.org/10.1016/j.biortech.2004.05.020
[25] Hasan-Beikdashti, M., Forootanfar, H., Safiarian, M.S., Ameri, A., Ghahremani, M.H., Khoshayand, M.R. and Faramarzi, M.A. (2012) Optimization of Culture Conditions for Production of Lipase by a Newly Isolated Bacterium Stenotropho-monas maltophilia. Journal of the Taiwan Institute of Chemical Engineers, 43, 670- 677. https://doi.org/10.1016/j.jtice.2012.03.005
Submit or recommend next manuscript to OALib Journal and we will pro-vide best service for you:
Publication frequency: Monthly
9 subject areas of science, technology and medicine Fair and rigorous peer-review system
Fast publication process
Article promotion in various social networking sites (LinkedIn, Facebook, Twitter, etc.)
Maximum dissemination of your research work