Munich Personal RePEc Archive
Performance of a reciprocity model in
predicting a positive reciprocity decision
Bhirombhakdi, Kornpob and Potipiti, Tanapong
Chulalongkorn University
8 July 2012
Online at
https://mpra.ub.uni-muenchen.de/40954/
Performance of a Reciprocity Model in Predicting a Positive
Reciprocity Decision
Kornpob Bhirombhakdi,
a Ph.D. candidate from Faculty of Economics, Chulalongkorn University, Thailand.
And
Tanapong Potipiti, Ph.D.,
Faculty of Economics, Chulalongkorn University, Thailand.
Revised on 8 July 2012
Abstract
1. Introduction
"The desire to know the future is universal and constant, …"
by Dan Gardner in the Future Babble
Reciprocity is the issue that has been actively studied in the experimental literature.1 There are two types of reciprocity: positive reciprocity and negative reciprocity. The positive reciprocity is a situation where a person kindly does something to another person and the second person kindly reciprocates. For example, a man gives a woman a gift and she returns him a gift. On the contrary, the negative reciprocity is a situation where a person does something bad to another person and the second person retaliates against. For example, a man steps on someone's foot and the victim retaliates by punching him.
Most of existing studies on reciprocity tried to point out factors affecting a decision to reciprocate or not; for instance, Stanca, Bruni and Corazzini (2009) explored the effect of information set to reciprocity; Bhirombhakdi and Potipiti (2012) explored the effect of perceived intention of kindness to reciprocity.
Besides the study of factors affecting reciprocity, some studies proposed new mathematical models (reciprocity models) to explain the existing evidences which cannot be explain by standard models. These reciprocity models show how an economic agent derives his utility from reciprocating. The proposed models can be classified into two types: traditional (e.g. Fehr and Schmidt (1999)) and psychological (e.g. Dufwenberg and Kirchsteiger (2004) and Battigalli and Dufwenberg (2007)). The difference between both types of model is that beliefs (the expectations on other players' decisions) endogenously determine a decision in the psychological models while do not in the traditional model.2
Recent studies (e.g. Csukás, Fracalanza, Kovács, et al. (2008), Falk, Fehr and Fischbacher (2008) and Stanca, Bruni and Corazzini (2009)) show that psychological models can better explain the reciprocal behavior than the traditional models. They also show that beliefs play an important role in determining a decision. While, Bolton and Ockenfels (2005) showed that the traditional model proposed by Fehr and Schmidt (1999) is better than the psychological model proposed by Dufwenberg and Kirchsteiger (2004). However, none of these studies directly test how well the models can perform predictions. In our opinion, prediction performance is one of the most important evidences to determine a model's success or failure. We believe that any good model should perform well in two aspects: explain the past and predict the future.
1
For example see Bolle (1998), Fehr and Schmidt (1999), Fehr and Gächter (2000), Bolton and Ockenfels (2000 and 2005), Charness and Rabin (2002), Falk, Fehr and Fischbacher (2003 and 2008), Falk and Fischbacher (2006), McCabe, Rigdon and Smith (2003), Brülhart and Usunier (2004), Dufwenberg and Kirchsteiger (2004), Cox and Deck (2005), Csukás, Fracalanza, Kovács and Willinger (2008), Stanca, Bruni and Corazzini (2009), Bhirombhakdi (2011) and Bhirombhakdi and Potipiti (2012).
2
To show the explanatory power of models, the studies retrospectively analyzed the existing evidences. On the other hand, to show the predictive power, a study should prospectively explore how a model can fit to new evidences.
This study designs a new experiment to test a performance of a reciprocity model in predicting positive reciprocity decisions. To illustrate that a model is good for the predictive purpose, we concern two characteristics: the rate of correct predictions (accuracy) and the marginal gain of the rate of correct predictions (informativeness).
Because recent studies support the psychological models, we select a reciprocity model that is the psychological type to be studied. For the sake of simplicity, we choose a simplest but well-known psychological model which is Dufwenberg et al. (2004) (henceforth we call it "DK model").
In addition to test the prediction power of the DK model, we also compare the DK model’s prediction power with other prediction methods that are less complicated. Two less-complicated-logistic models are constructed and measured for their performance; one model is determined by a decision in a dictator game and the other is determined by personal information including IQ-test scores, personal attitudes and socio-economic factors.
The following in this article is organized as following. We present our measurement approach and the trust game and the DK model in the section 2-4, respectively. The scenarios to test the model are presented in section 5. Section 6 presents experiment protocol. Sections 7 and 8 show the results and conclusion.
2. Our performance measurement approach
a b
c d
L R
1
[Fig. 1 Left or Right?]
We present a simple model to illustrate how we design an experiment to measure a model's performance (accuracy and informativeness) in predicting decisions.
In this study, to test the performance of a model we individually infer a subject's decision in a future scenario (which is called "tested scenario") from his past decision in another scenario (which is called "conditional scenario"). For example, suppose we would like to test the performance of the altruistic utility function model: ( ) ( ) ( ) where for * + is the player 's material payoffs, * + is the first player's decision and is the first player's type that is a relative weight between his material payoffs and the second player's . And, as presented in Fig. 1, let the tested scenario have the following point structure ( ) ( ).
According to the altruistic utility function model, the first player's best response function is
{ | }. According to the point structure, if , the player chooses left and vice versa.
Since the player's type is private information, before we can predict his future decision we need to learn his type from his past decision in the conditional scenario. We design the conditional scenario of which the best response function is the same as in the tested scenario. For instance, we apply the scenario with point structure ( ) ( ) as the conditional scenario since a subject will choose left in this scenario if his which is the same best response function as of the tested scenario.
Assuming that the player’s type is invariant across scenarios, the decision of the player in tested and conditional scenario must be identical. Therefore, we can infer his decision in the tested scenario from that in the conditional scenario.
As we have seen from the example above, testing the predictive power of a utility function needs three steps. First, under the model's specification, design a conditional scenario that is closely related to tested scenarios. Second, learn each subject's type from his decision in the conditional scenario. Last, predict the decision in the tested scenario according to the subject's type implied by his decision in the conditional scenario.
To our knowledge, this study is the first study that applies this approach to test the performance of a reciprocity model in predicting decisions. Here, it is worth discussing the strength and weakness of this approach. The strength is: i) the approach can be extended to apply for any model that has more than one parameter. For instance, if a model has two parameters, the approach uses two conditional scenarios to learn each subject's type. Moreover, since the approach provides exact predictions individually, ii) we can directly count for the model’s accuracy.
required. Also, iii) for each subject, many treatments (conditional + tested scenarios) are necessary. Long experiments may generate unsatisfied quality of data is unavoidable.3
3. Trust game
S
a b
1
C
2
T R
c b+d
c+e b+d-e
[Fig. 2 Trust game]
In this study, we apply the trust game to test the DK model using six designed scenarios (one conditional scenario and five the tested scenarios). As presented in Fig. 2, we use the trust game to model a positive reciprocity situation. The game is sequentially played and has two players: first and second. The first player decides whether to stop or trustfully continue the game. If the game was continued, the second player gets additional points and makes his decision whether to selfishly take all the additional points or reciprocally return the first player points ( ).
4. The DK model and its best response function
( ) ( ) ( ) ( )
The DK model is presented in (1).4 It shows that player 's psychological utility function. Player’s utility is derived from two parts: his material payoff and psychological payoff that in this case is called reciprocal payoff . The reciprocal parameter or type is a relative weight between the two parts. According to the trust game as presented in Fig. 2, the less the value of the type of player 2 the more likely he will choose taking . The material payoff is determined by the strategy profile . In our trust game, ( ) where * + and * + are decisions of the first and second players respectively. In addition to the strategy profile, beliefs or expectations on opponents' decisions play an important role in determining reciprocal payoff and decision. For instance, the first player who expects that the second player to reciprocally return is more likely to continue than the one who expects the opposite.
3
See "chronic nuisances" in Friedman and Sunder (1947), pp. 29-30.
4
In this study, we focus on the second player's decision: to reciprocate by choosing returning or not reciprocate by choosing taking . According to the DK model and the game, we can theoretically derive the second player's best response function ,
{ | } ( )
where and
. 5
The second player will reciprocally return the first player if he his reciprocal
parameter is sufficiently, . He will choose taking if .
5. Scenarios
As presented above, in order to infer a decision in a tested scenario from a decision in a conditional scenario, we design the scenarios such that the second player has the same best response in all scenarios. As presented in (2), the critical level of the reciprocal parameter in the best response function depends on and . Therefore, to fix the level of and we fix and in all scenarios.
Now, according to the Fig. 2, each scenario is designed differently by specifying the point structure ( ). As presented in Table 1, we design six scenarios. The 1st scenario is the conditional scenario where we learn each subject's type. The other five scenarios are the tested scenarios where we predict each subject's decision according to his learnt type.
The tested scenarios are designed to test the DK model's performance and robustness in various situations. We hypothesize: i) the level of stake (1st-3rd scenarios) does not affect the behavior but very low level of stake (4th scenario) will affect it. ii) Even though the scenarios present positive reciprocity, behavior in the decision-to-gain scenario is different from the decision-to-loss one (6th scenario). Loss aversion may play an important role in positive reciprocity situation. iii) As concluded in Bhirombhakdi and Potipit (2012), the cost of continuing (5th scenario) that is defined by the difference between the possible lowest points of each decision of the first player, precisely , may affect the second player's behavior. As we will see in the next section, our experimental results support these hypotheses.
[Table 1 Scenarios and their exogenous factors]
Conditional/tested
scenario Number
Important factors
(compared to the conditional scenario)
Conditional 1 100 100 100 -
Tested
2 50 50 50 Lower level of stake
3 200 200 200 Higher level of stake
4 0 0 0 Zero level of stake
5 50 50 150 Lower cost of continuing
5
6 -200 -600 -200 Negative point structure
6. Experiment protocol
This hand-run economic experiment was conducted during 24th August - 6th September 2011 at Faculty of Economics, Chulalongkorn University, Thailand. There were four sessions. To implement a double-blinded experiment, each session were conducted by trained staff.
Announcement about the experiment were posted around the Faculty of Economics of the university and were distributed in a social network. The announcements informed the length of each session (90 minutes), the minimum-maximum payment (100-400 baht), and the tasks each subject would do.
Seventy nine undergraduate students voluntarily participated. Each participant made anonymous contingent decision plans prior to knowing his exact role and his opponent. Each participant would be randomly assigned a role and matched with another participant at the end of the experiment. Each subject did five different tasks: answered an IQ test, made a decision in a dictator game, answered a set of questions that tested for their understanding of the trust game, made decisions in eight trust games (which six games are presented in this article) and completed a set of questionnaires that composed of personal attitudes and socio-economic factors.
Subjects were informed that they would be paid for each task according to different criteria. The IQ-test task would be paid according to each subject's scores. The dictator-game task would be paid according to his decision. The understanding-test task would be paid according to correctness. The trust-game task would be paid according to his decision plan and randomly matched opponent's decision plan. The questionnaire task would be paid fifty Thai baht.
To prevent learning effect and dependent decisions, the eight trust games were separated into four sets (2 games/set) and were inserted in an envelope.6 Subjects were required to make their decisions by following this rule: draw one set at a time, complete all decisions in the drawn set, carefully check the decisions since changing any decision after this step is not allowed, return the completed set to the envelope, draw the next set and follow the process until the last set is completed. Moreover, staff also monitored and warned any subject who did not follow the rule.
6
To prevent subjects of being framed their perception toward game or reciprocity situation, this study implemented the framing-effect-free environment by using neutral words: "situation" instead of "game", "decision A" instead of "stop", "person" instead of "player", etc.7
7. Performance of the DK model
We present the results in three sections. First, we discuss the baseline which is the rate of correct predictions using the majority decision. We then discuss the performance of the DK model. Last, we compare the performance of the DK model and that of the other methods.
[Table 2 Baseline, accuracy and informativeness from applying the DK model]
Tested scenario
Measurements 2nd 3rd 4th 5th 6th
Baseline 71% 71% 57% 80% 94%
Accuracy 85% 82% 81% 81% 75%
Informativeness 14% 11% 24% 1% -19%
7.1 Baseline
As presented in Table 2, the baselines, which is the majority decision -- choose taking -- are in the range of 57% - 94% (the 1st scenario's baseline is 73%). It presents the rate of the simplest prediction method. The pretty wide range implies that subjects did not significantly randomize their decisions. If they significantly randomize their decisions the range would be narrow.
Some observations from the baselines are worth discussing. First, the 6th scenario is the only scenario that has negative point structure ( ). The scenario has the highest baseline (94% of subject chose taking ) and the lowest reciprocity rate, 6%. This result implies that in addition to positive reciprocity there were other factors strongly affecting the second players' decisions in this scenario. Since the scenario has negative point structure that makes each subject make a decision to loss, loss aversion may explain such the behavior.
The baseline of the 4th scenario is the lowest at 57%. In other words the reciprocity rate of the scenario is the highest. Even though the 4th scenario is different from the 1st-3rd scenarios only at the level of stake but its baseline is significantly lower than others'. We believe that the important factor that makes subjects prefer choosing returning to taking in the 4th scenario more than that in the 1st -3rd scenarios is the guilt or sympathy. Guilt and sympathy were respectively discussed in Battigalli and Dufwenberg (2007) and Geanakoplos, Pearce and Stacchetti (1989). Both guilt and sympathy are psychological factors that alter one's utility and can increase the reciprocity rate. The second player feels
7
guiltier when choosing and leaving the first player nothing in the 4th scenario than in the 1st-3rd scenarios. In the 1st-3rd scenarios , choosing does leave player 1 some positive points. Therefore, the second player is less likely to choose taking in the 4th scenario. Similar explanation can apply to the case of sympathy.
Among the positive-point-structure scenarios (1st-5th scenario), the 5th scenario has the highest baseline (80%). Bhirombhakdi and Potipiti (2012) discussed that the cost of continuing of the first player signals the second player his intention of kindness giving. The higher the level of intention, the more the reciprocity rate (equivalently, the less the baseline) is. Precisely, the 5th scenario has lower the cost of continuing (-150 points) than the others (0 point). Consequently, the baseline of the 5th scenario is higher than the others'.
The 1st-3rd scenarios that have similar point structures show approximately equal level of the baselines: 73%, 71% and 71% in the 1st, 2nd and 3rd scenarios respectively. The only difference between the scenarios is the level of stake. Precisely, the 2nd scenario has the lowest level of stake by assigning the point structure ( ), the 1st scenario has medium the level ( ) and the 3rd scenario has the highest the level ( ). The results show that in the aggregated level, the level of stake does not significantly affect the second players' decisions. A practical implication of this result is that at the aggregate level, we can accurately infer the second players' decisions in one trust game from another trust game.
7.2 Accuracy and informativeness
According to the DK model and our experimental design, if a subject chose taking in the conditional scenario, he will also choose taking in the 2nd scenario, and vice versa. Table 2 shows the accuracy test of this implication. The accuracy (the rate of correct predictions) is 81% - 85% (82.25% on average) in the 2nd-5th scenario and 75% in the 6th scenario. If a subject chose taking in the conditional scenario, we correctly predict at 85% that he will also choose taking in the 2nd scenario, and vice versa. We now turn to informativeness (which is the marginal gains in accuracy when compared with the baseline). Table 2 shows that applying the DK model to predict decisions in the 2nd-5th scenarios is informative but not informative in the 6th scenario.
To statistically confirm the results of informativeness, we analyze the data using the following logistic regression model
(
) ( )
where = 1 if the subject chooses taking in the scenario and = 0 otherwise; * +
is the index of each subject and * + is the index of each tested scenario; = 1 if the subject
chooses taking in the conditional scenario and = 0 otherwise.
and are constant and
corresponding scenario . The term in (3) represents how the decision in the conditional
scenario provides information to explain the decision in tested scenario ; it represents the informativeness. For instance, means the decision in the conditional scenario does not help explaining the decision in tested scenario.
[Table 3 The regression results of (3) and F-test for informativeness]
Tested scenario: in (3)
̂
(p-value)
̂
(p-value)
F statistics ( )
Informativeness/Uninformativeness (tested at 0.05 level of significance)
(0.02) -1.16 (0.00) 3.15 48.98 Informative
(0.06) -0.92 (0.00) 2.75 35.27 Informative
(0.00) -3.00 (0.00) 4.14 51.86 Informative
(0.83) -0.10 (0.00) 2.46 23.18 Informative
(0.00) 1.79 (0.11) 1.54 3.10 Uninformative
To test whether applying the DK model is statistically informative, we treat (3) as the unrestricted model and do the F-test by comparing with the restricted model of (3) that treats . As presented in Table 3, at 0.05 level of significance the regression result (that are corrected by with Huber/White Robust covariances) of each tested scenario rejects the null hypothesis that the term
is uninformative in the 2nd-5th scenarios but does not reject in the 6th scenario. Hence, applying
the DK model to predict decisions in the positive-point-structure scenarios (2nd-5th scenarios) is statistically informative. In conclusion, when applying it to predict decisions in the positive-point-structure scenarios, the DK model has good performance in both accuracy and informativeness aspect.
In the 6th scenario, applying the DK model for prediction shows poor performance. Comparing to the accuracy of other scenarios that have positive point structures, the accuracy in the 6th scenario is significantly lower. The result implies that inferring a subject's decision in a negative-point-structure scenario (the 6th scenario) from his type learnt from his decision in a positive-point-structure scenario (the conditional scenario) is inappropriate.
Since the informativeness measures the difference between the accuracy and the baseline, together with the low accuracy, the highest baseline of the 6th scenario makes applying the DK model be uninformative. However, the baseline at 94% is very high. So, it might be difficult or even impossible to apply any prediction method to improve upon the baseline.
The previous results show that applying the DK model in predicting decisions is accurate and informative. However, the method of applying the DK model is complicated. We now compare the DK model with to other prediction methods that are less complicated to check whether the DK model is more accurate.
We test two less-complicated methods. First, instead of using the 1st scenario as a conditional scenario to learn each subject's type, we use a dictator game (henceforth, we call this method "DG method"); it is a game that only the first player who is called the dictator makes a decision of splitting the total amount of game points for himself and his recipient. In this study, the total amount are 200 points and the dictator can split in integer since 0 - 200 points for himself. It is a one-shot game that is less complicated than the trust game which is a two-shot game. Moreover, the dictator game is the simplest game that represents the interaction between economic agents who concerned social norms, fairness, altruism, etc. [Guala and Mittone (2010)]. Also, the DK model shows that the amount of points the dictator keeps for himself has negative relationship with the reciprocal parameter in the model.8 Hence, the more the amount that a subject keeps for himself in the dictator game the less likely he will choose return in the trust game. In other words, the decision in the dictator game can be used to predict the decision in the trust game.
Second, we use personal information including IQ-test scores, personal attitudes and individual socio-economic factors to represent each subject's type (henceforth, we call this method "personal-info method"). As non-decision-making data, gathering the personal information is less complicated than gathering the decision-making data like the DG method; hence we consider the personal-info method as the least complicated among the three prediction methods in this study.
We measure accuracy of each method by: randomly group the subjects into two groups (the first group with and the second group with ), use the data of the first group (in-sample) to regress in a logistic model (equation (4) and (5) present the models of DG and personal-info methods respectively), use the estimated coefficients to find the fitted value of each subject's decision in the second (out-of-sample) group and compare the fitted value to the actual decision to measure the accuracy. Since the fitted value ̂ is in the range , - but the actual decision is a pure strategy (either 0 or 1), we assign ̂ if the value is in , - and otherwise.
(
) ( )
(
) ∑ ( )
9
8 See Appendix for the proof of the relationship between the decision in the dictator game and reciprocal
parameter.
9
For example, the regression result of (5) in the case that (predicting decisions in the 2nd scenario) is
.
/ where = 1 if the subject
has
where = 1 if the subject chooses taking in the scenario and = 0 otherwise; * + is the index of each subject in the first group;10 * + is the index of each tested scenario. is the game points that the subject kept for himself in the dictator game. where * + is the subject 's selected personal information in the scenario; is the total numbers of the selected personal information.11 are constants and coefficients of the corresponding variables in the scenario where * +. are disturbances of each subject in the corresponding the
model in the scenario.
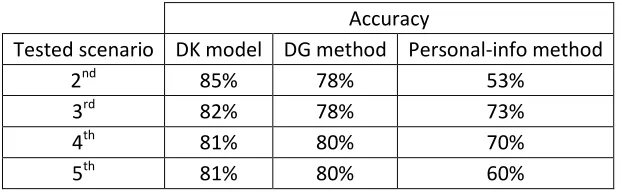
[Table 4 Accuracy from applying the DK model, DG method and personal-info method]
Accuracy
Tested scenario DK model DG method Personal-info method
2nd 85% 78% 53%
3rd 82% 78% 73%
4th 81% 80% 70%
5th 81% 80% 60%
Table 4 presents the accuracy from applying each method: the DK model, DG method and personal-info method. The results show that applying the DK model yields the highest accuracy, hence the method has the best performance. The results also imply for the validity of the DK model; the model prospectively (and retrospectively) fits to evidences and can perform predictions better than other prediction methods.
Moreover, the results show some noteworthy observations. The DK model and the DG method yield higher accuracy rates than that from the personal-info method significantly. This result shows that predicting a decision by using decision-making data to learn the decision maker's type is better than using non-decision-making data.
The results also support the potency of the dictator game to capture a subject's type on social preferences related to positive reciprocity. The accuracy of applying the DG method is quite high ( significantly at the level of 0.05). The regression results of (4) show a negative relationship between the amount of points taken by a dictator and the likelihood of choosing returning . The more points the dictator takes for himself, the less likely he chooses returning in a trust game.
10
The number of observations in the first group is assigned to each subject randomly by: assign a random number which is drawn from a uniform distribution to each subject, order the subjects according to the assigned random number and assign the number of observation according to the order.
11
[image:13.612.152.463.217.313.2]8. Conclusions and remarks
This study tests the DK model’s performance in predicting positive-reciprocity decisions. A new approach to measure the model's performance is introduced. In this approach, we design a conditional scenario to learn each subject's type and infer his future decisions in the tested scenarios from his type. The rate of correct predictions (accuracy) and the marginal gain in the rate (informativeness) are measured as the indication for the model’s performance. Six scenarios of trust game (one conditional scenario and five tested scenarios) are employed in hand-run economic experiment. The results show that the DK model has good performance -- above 80% in accuracy and informative.
Furthermore, we compare the DK model's performance with two other prediction methods. The first method estimates a logistic model using the decisions in the tested scenarios as dependent variables and decision in a dictator game as the explanatory variable. Then the estimated model is applied for predicting decision. The second is similar to the first method except that in the logistic model, personal information is used instead of information from decision in a dictator game. The results also show that applying the DK model is better than the other two methods.
For further studies, there are many possibilities to explore. One may explore the limitations of the DK model in other scenarios. One may explore other models' performance by applying our approach. Or, one may explore on the issues that are additionally observed in this study such as, like what we observed that the baseline of the 4th scenario is different from of the 1st-3rd scenarios, one may explore this boundary.
Appendix
A.1 The DK model and derivation of (2)
( ) ( ) ( ) ( ) ( )
, - ( )
, - ( )
( , - , -) * + ( )
second player's expectation on the first player's expectation on the second player's decision -- and each player's equitable payoff ( for the first player's and for the second player's).
The kindness-giving function is measured by the difference between the second player's expectation on the first player's material payoff , - and his equitable payoff that is derived by the arithmetic mean between the maximum and minimum of the first player's expected material payoff ( , - and , - respectively). Precisely, , - ( ) and , -
( ).
Similarly, the kindness-perceiving function is measured by the difference between the second player's expectation on his material payoff , - and his equitable payoff where , - ( ) and , - ( ) are respectively the maximum and
minimum of his material payoff.
According to the trust game in Fig. 1, given the first player's continuing , the second player's utility function is derived as,
( ) (( ) ( ) ) (( ) ( ( ) )) ( )
Then we apply the sequential reciprocity equilibrium as proposed by Dufwenberg et al. (2004) to characterize the second player's best response function as presented in (2).
A.2 The relationship between the decision in a dictator game and reciprocal parameter
This section proofs the negative relationship between the amount of points the dictator keeps for himself and his reciprocal parameter in the DK model.
Proof:
In this study, in the dictator game a subject makes a decision , - and to keep amount for himself. Theoretically, the subject chooses that gives him the highest utility. Precisely, according to the DK model (as presented in (6) - (9)), the subject chooses that solves the following optimization problem (P1),
( ) ( ) ( )
where is the equitable payoff that we assume the payoff be equal for both players (e.g. the equitable payoff is 100 points which is the half of the total amount).
Let solve (P1), since is constant, then we get the first-order condition as,
Then, re-arranging (11) can show the negative relationship between the amount of points the subject keeps for himself and the reciprocal parameter .12
Q.E.D.
Acknowledgment
Thank The 90th Anniversary of Chulalongkorn University Fund (Ratchadaphiseksomphot Endowment Fund) for the financial support.
References
Battigalli, P., & Dufwenberg, M. (2007). Guilt in Games. American Economic Review, Papers & Proceeding, 170-176.
Bhirombhakdi, K. (2011). Performance of a reciprocity model in predicting a positive reciprocity decision.
International Conference on Management, Economics and Social Sciences (ICMESS'2011), (pp. 504-508). Bangkok, Thailand.
Bhirombhakdi, K., & Potipiti, T. (2012). Cost of action, perceived intention, positive reciprocity, and signalling model. 6th Asian Business Research Conference. Bangkok, Thailand.
Bolle, F. (1998). Rewarding trust: an experiment study. Theory and Decision, 45(1), 83-98.
Bolton, G. E., & Ockenfels, A. (2000). ERC: A theory of equity, reciprocity, and competition. The American Economic Review, 166-193.
Bolton, G. E., & Ockenfels, A. (2005). A stress test of fairness measures in models of social utility.
Economic Theory, 957-982.
Brülhart, M., & Usunier, J. C. (2004). Verified trust: reciprocity, altruism and noise in trust games. Centre for Economic Policy Research (CEPR) Discussion Paper.
Charness, G., & Rabin, M. (2002). Understanding social preferences with simple tests. The Quarterly Journal of Economics, 817-869.
Cox, J. C., & Deck, C. A. (2005). On the nature of reciprocal motives. Economic Inquiry, 623-635.
12
Also, the problem (P1) satisfies the second-order condition at ,
Csukás, C., Fracalanza, P., Kovács, T., & Willinger, M. (2008, June). The determinants of trusting and reciprocal behavior: evidence from and intercultural experiment. Journal of Economic Development, 33(1), 71-95.
Dufwenberg, M., & Kirchsteiger, G. (2004). A theory of sequential reciprocity. Games and Economic Behavior, 268-298.
Falk, A., & Fischbacher, U. (2006). A theory of reciprocity. Games and Economic Behavior, 293-315. Falk, A., Fehr, E., & Fischbacher, U. (2003). On the nature of fair behavior. Economic Inquiry, 20-26. Falk, A., Fehr, E., & Fischbacher, U. (2008). Testing theories of fairness- Intentions matter. Games and
Economic Behavior, 287-303.
Fehr, E., & Gächter, S. (2000). Fairness and Retaliation: The Economics of Reciprocity. Journal of Economic Perspectives, 159-181.
Fehr, E., & Schmidt, K. M. (1999). A theory of fairness, competition, and cooperation. The Quarterly Journal of Economics, 817-868.
Friedman, D., & Sunder, S. (1947). Experimental methods: a primer for economists. Cambridge University Press.
Geanakoplos, J., Pearce, D., & Stacchetti, E. (1989). Psychological games and sequential rationality.
Games and Economic Behavior, 60-79.
Guala, F., & Mittone, L. (2010). Paradigmatic experiments: the dictator game. Journal of Socio-Economics, 39, 578-584.
McCabe, K. A., Rigdon, M. L., & Smith, V. L. (2003). Positive reciprocity and intentions in trust games.
Journal of Economic Behavior and Organization, 267-275.
Stanca, L., Bruni, L., & Corazzini, L. (2009). Testing theories of reciprocity: Do motivations matter?
Journal of Economic Behavior and Organization.