Capital Flight and Transfer from
Resource-Rich Developing Countries
Demachi, Kazue
Graduate School of International Cooperation Studies, Kobe
University
29 September 2013
Online at
https://mpra.ub.uni-muenchen.de/50273/
Abstract
This paper analyzes the influence of international resource price movements on
capital outflows from resource-rich developing countries (RRDCs) by distinguishing
capital flight and capital transfers. The volume of capital flight and transfers are
calculated and their determinants are analyzed using macro-panel data constituting 21
resource-rich developing countries from 1990 to 2011. Through the regression analysis,
the linkage between capital flight and resource revenue as well as that between capital
flight and debt is suggested. The results of this analysis suggest the need to focus on
capital outflow from RRDCs through transnational companies.
1. INTRODUCTION
Countries with rich natural-resource endowment have experienced prolonged
economic stagnation from the 1980s to the 1990s. Many studies on this paradoxical
situation, named resource curse, have accumulated (e.g., Auty, 1990; Gelb and
associates, 1988; Karl, 1997; Sachs and Warner, 1995, 2001). The focus of the
resource-curse literature varies from Dutch disease (Corden and Neary, 1982; Corden,
1984; Cuddington, 1989), to economic volatility and policy pro-cyclicality (Budina et al,
2007; Nissanke, 2010), and rent-seeking activities, which represent the argument in the
arena of political economy (Hausmann and Rigobon, 2003; Karl, 1997).
Sachs and Warner (2001) use 1970–1989 data and visually and clearly
demonstrate the negative relationship between dependence on commodity exports and
per capita economic growth rate, which has become one of the stylized facts of the
resource curse. In fact, this same clear relationship cannot be replicated anymore with
the data for the new millennium. Since 2000, many resource-rich developing countries
(RRDCs) have been experiencing an influx of foreign direct investment (FDI) and
higher resource revenue and continue to register rapid economic growth rates. Today,
RRDCs appear to have overcome the resource curse and gained advantages that permit
them to boost their own economies. However, it is also true that large populations in
RRDCs still suffer from weak government institutions, immature financial systems,
poor public infrastructure, high unemployment, and poverty, regardless of the extent of
their resource incomes and their relatively high GDP growth rates (IMF, 2012).
This study investigates the influence of international resource price movements on
of resource revenue is not domestically invested but is simply consumed or flows
abroad. Drawing on this premise, this study calculates the volume of capital outflows
from RRDCs.
One reason for focusing on capital outflows from RRDCs is the similar
characteristics between the capital-flight ridden countries and the resource-curse
suffering countries. Noteworthy analyses on international capital movements have
focused on capital flight, mostly during the 1980s–1990s when many developing
countries (and private banks in developed countries) suffered from financial crises
(Cuddington, 1986, 1987, 1989; Dooley et al, 1986; Dornbusch, 1985; Lessard and
Williamson, 1987). These analyses offer great insight into and knowledge on the
conditions for and causes of capital flight from heavily indebted countries. The main
characteristics of countries that suffered heavy capital flight during this period include
currency overvaluation, high inflation rate, financial repression, high risk associated
with domestic assets, and above all, the inflow of foreign capital in the form of foreign
debt.
The above characteristics of countries that suffered heavy capital flight in the
1980s also apply to RRDCs. In particular, many RRDCs experienced an influx of
foreign capital in the form of resource revenues, especially in the new millennium when
international resource prices increased. Because many developing countries share weak
institutions and other economic characteristics, capital inflows as RRDCs’ resource
revenue are also suspected to be linked with capital outflows.
Another reason for focusing on capital outflows from the RRDCs is their
developed countries to hold their assets abroad or invest abroad to maximize their
investment returns (Lessard and Williamson, 1987: 201), there are good reasons to
believe that the increase in foreign asset holdings of RRDC residents is not entirely
clear. Although a typical RRDC receives huge resource revenues, its domestic
economies are still underdeveloped. More precisely, many RRDCs lack economic
infrastructure, effective health care and education systems, and domestic jobs. In sum,
many RRDCs are in need of additional domestic investment and possibly suffer from
domestic capital shortage despite their rich cash inflow.
To further develop the discussion on capital outflows in the context of RRDCs, this
paper distinguishes between capital flight and capital transfer. While both are
considered as capital outflow, capital flight is interpreted as the increase in private
foreign assets held by RRDC residents. Capital transfer, on the other hand, is the
outflow of capital, of which ownership is transferred to the residents living outside
RRDCs. In particular, this study focuses on the operation of private transnational
companies (TNCs) in RRDCs as an important conduit of these capital transfers. Capital
transfer is especially important in RRDCs because many TNCs operate within the
natural resource industries and their influence on the local economy is historically large
in many cases. As international resource prices increase, these TNCs are also expected
to be influenced by the change.
The remainder of this paper is organized as follows. Section 2 reviews stylized
facts on capital flight and summarizes the relationship between FDI and capital transfers
to investigate how these factors affect resource-rich countries. Section 3 presents
volumes. Section 4 presents a panel-data analysis on the determinants of capital
outflows using calculated data for 21 countries from 1990 to 2011. The final section
concludes.
2. CAPITAL FLIGHT AND CAPITAL TRANSFER
(a) Capital flight
Capital outflows from developing countries became a subject of debate during the
1980s’ Latin American debt crisis. A large portion of the foreign capital injected into
crisis-ridden countries as development assistance or new loans is suggested to have
“round-tripped” out of these countries into foreign bank accounts as private assets (Kant,
1996; Pastor, 1990). There is no formal definition of capital flight, and thus, the range of
capital movement included as capital flight and its estimated values varies depending on
a study’s aims and methods (Ajayi, 1995). On one hand, capital flight can be understood
as being rational profit maximization by the residents of developing countries, on the
other hand, it can be regarded as a way these residents protect their assets from their
local high-risk political and economic environment. These international capital
movements can be either legal or illegal.
Several authors note the harmful effects of capital flight on the country losing this
capital. For example, Cuddington (1986) and Pastor (1990) indicate that capital flight
destabilizes the domestic interest rate and exchange rate, which weaken the effect of
financial policies. Capital flight also accelerates inequality by distorting the distribution
of wealth. In addition, it could erode the potential tax base and simultaneously reduce
domestic investment.
economic policy are the primary forces triggering capital flight. People also transfer
their assets to overseas bank accounts, where the currency is more stable, when they see
signs of high inflation or an overvalued exchange rate in their countries (Ajayi, 1995;
Cuddington, 1986, 1987; Dornbusch, 1985; Lessard and Williamson, 1987; Pastor,
1990). Dornbusch (1985) also highlights that a large government budget deficit is
sometimes followed by either higher taxes or seigniorage, which also accelerate capital
flight. Furthermore, against the background of today’s globalized environment, it is
natural to expect investors to shift their assets abroad when the domestic financial sector
is underdeveloped, thus failing to present attractive investment opportunities. A weak
financial system also implies the absence of a legal system to protect depositors, which
is another possible cause of capital flight. Moreover, corruption among politicians and
high-profile government officers, who have relatively easier access to foreign currencies,
can exacerbate capital flight. International development aid from other governments
sometimes offers significant opportunities for capital flight because foreign lending is
tantamount to a supply of foreign currency (Ndikumana and Boyce, 2011b: 66–67).
In addition to the above-mentioned causes of capital flight, such pull factors as
higher overseas interest rates or the existence of tax havens and banks with a high
degree of secrecy are also considered to be good incentives for capital flight (Walter,
1987, 1989).
The most important point of the debate on capital flight is that the inflow of foreign
capital, whether debt or aid, is directly linked to capital flight. At first, some authors saw
capital flight in the 1980s as a theoretical and conceptual puzzle. This was because
counties. However, capital flight from Latin American countries has attracted so much
attention because private assets were accumulated by sacrificing the public sector whose
liabilities increased. Put differently, public capital flowed in as debt, of which creditors
were the residents outside the debtor country. This debt was then turned into the private
assets of residents of the debtor country who did not compensate for their gains.
Examining present-day RRDCs, there is huge inflow of foreign capital, but this can
be linked to capital outflows. Adding to this, the local economic and political situation
is not very different from the capital-flight-ridden countries discussed above.Indeed, as
Ndikumana and Boyce suggest, prices of natural resources such as crude oil are
commonly denominated and transacted in U.S. dollars, and thus, sales profits as well as
other natural-resource revenues, such as signing bonuses or royalties, can be sources of
additional private foreign assets for those who have access to them (Ndikumana and
Boyce, 2011b: 67–71). Moreover, if an RRDC is already experiencing an economic
structural transformation through the Dutch disease, the economy has already become
highly dependent on its natural resources while having let its other industrial sectors
decline. This economic situation is even more likely to induce capital flight due to
economic volatility and a high inflation rate, which are suggested as characteristics of
resource-dependent economies (Budina and Wijnbergen, 2008; Nissanke, 2010). With
the globalization of the financial services industry, it is not rare for even the residents of
less-developed countries to hold private assets abroad. Today, it may seem to be
anachronistic to simply criticize the outflow of private capital from developing
countries. However, an increase in private foreign assets can still be considered harmful.
investment outside the resource sector is not booming, regardless of the high-GDP
growth rate. Moreover, investment in the development of the resource sector is mainly
carried out by the TNCs through FDI. Given the relatively high-international resource
prices, resource revenues should have accumulated in RRDCs; however, the revenues
have not been redistributed or reinvested within their domestic economies.
(b) Capital transfer
The agent of capital outflows from RRDCs is not only private individual resident,
but also TNCs that are expected to play an important role. The ties between
governments and TNCs are particularly strong in resource-rich countries, where
resource extraction and the operation of natural resource industries are heavily
dependent on advanced technologies and huge capital provided by TNCs. For instance,
crude oil production in many former colonial countries was initiated by the foreign
private companies which later become TNCs, in cooperation with the colonial
governments. Indeed, these companies had waves of nationalization, and many
international oil companies formed joint ventures with these governments (Jones, 2005:
213–214). Nevertheless, international resource companies remained very influential
within RRDCs through the era of nationalization or confiscation until today. Karl (2007)
pointed out that in the case of oil companies operating within RRDCs, these companies
continue to generate huge profits from natural resource production.
It is worth noting that while the increase in foreign investment inflows to RRDCs
is welcomed, the proportion of profits in the local economy is expected to be small
(Auty, 2006; Ferguson, 2005, 2006). Moreover, in the value chain of energy products
unprocessed, and the majority share of product value is outside of RRDCs. Thus, a large
share of the profits that accrue to these natural resources is earned outside of RRDCs.
For example, Nigeria, one of the major African crude oil exporters, depends on crude
oil for more than 90% of its export earnings, but the country imports a large amount of
gasoline and other fossil fuels that are processed abroad (National Bureau of Statistics
Nigeria, 2011). This is partly due to Nigeria’s lack of domestic refining capacity. But
the policies of oil majors also matter. In general, it is more efficient and cost effective
for TNCs to produce higher value-added products in a location where stable electricity
is supplied, transportation is cheaper, and that is accessible to consumers.
While there is nothing wrong with this international corporate behavior in the
context of corporate management and profit maximization, it is the reason why FDI in
developing countries’ extractive industries is less of a benefit to host countries, as
suggested by Asiedue (2006). Because the higher value-adding processing phase takes
place outside of RRDCs, little technology and knowledge is diffused to the host
economy. Extractive industries in developing countries also have few forward or
backward linkages to other industrial sectors, and as a result, investment in the resource
sector does not spread to the other sectors of the local economy. Moreover, the industry
is very capital intensive and, consequently, does not produce much local employment
(Ross, 2012).
All of these characteristics of foreign investment in resource industries suggest that
while TNCs are expected to earn profits as international resource prices increase, their
earnings are less likely to be reinvested or distributed to the host economy but rather are
international resource price will increase capital transfers from RRDCs to the foreign
private companies.
While this analysis focuses on capital transfers via private companies, it is
noteworthy that these companies are also important conduits of capital flight from
developing countries. For instance, Ajayi (1995) suggests the possibility of capital flight
for tax evasion or avoidance. This activity seems to be common among not only private
individuals but also among private enterprises and TNCs.
Indeed, TNC activity is deeply related to capital flight when it transfers taxable
liquid assets for tax evasion or avoidance. Some literature suggests that the development
of tax havens and city states—such as Hong Kong and Singapore as well as the City of
London—which function as financial centers with tax breaks, are associated with
increases in tax evasion and avoidance, sometimes through TNCs’ use of shell
companies (Otusanya, 2011; Shaxon, 2011; Walter, 1987, 1989). Tax evasion and
avoidance are serious problems for industrialized countries that are the home base for
most TNCs. Nevertheless, both the society and economy of the host countries are more
seriously affected. Developing countries’ legal systems are often not yet fully mature
and there are many loopholes in corporate tax law. Meanwhile, capital outflow through
transnational corporations for tax evasion or avoidance reduces the tax base for the
developing country’s government, which possibly retards socioeconomic development
and impedes efforts to reduce poverty. In many RRDCs, such problems are more serious
due to their economy’s high dependence on TNCs and the profits that are earned
through domestic natural resource production. For example, Otusanya (2011) points out
such problems in Nigeria, where Chevron manipulated its accounts to avoid making tax
paying taxes.
Transfer pricing is another way through which TNCs derive capital from RRDCs.
It is suggested that TNCs charge minimum prices in their intra-firm trading to maximize
overall profits within the group as a whole (Jones, 1995: 213). An extreme application
of this type of transfer pricing is under-invoicing exports or over-invoicing imports. For
example, under- and over-invoicing were commonly observed in Nigeria during the
1970s and 1980s (Morgan Guaranty Trust Company, 1986: 14). These mechanisms are
also understood as a method of capital flight and a way to avoid paying taxes in the host
country, thereby depriving it of a rightful source of revenue. But it is difficult to
distinguish such transfer pricing as rational actions taken for profit maximization from
questionable behaviors perpetrated for tax evasion or avoidance. Moreover, it is difficult
to capture the size of such under- and over-invoicing because such transactions are
embedded in current account balances on the trade of goods and services in the
international balance of payment (BOP) statistics. Thus, capital flight through TNCs and
capital outflows through the mechanism of transfer pricing are not dealt with in this
paper.
3. ECONOMETRIC ANALYSIS
(a) Calculating capital flight
There are several traditional approaches to the estimation of capital flight in the
literature. The most widely used approach is the “residual method,” proposed by
Dornbusch (1985), and developed by others including Ndikumana and Boyce (2001).
This method treats capital flight (KF1) as residual, meaning that it does not appear on
data accumulated by the World Bank. Capital flight is defined by the equation below.
Foreign reserves increase (∆𝑅𝑅𝑅𝑅𝑅𝑅) + Current account deficit (𝐶𝐶𝐶𝐶 deficit) +
Long-term foreign investment outflow + KF1
= New debt inflow (∆𝐷𝐷𝑅𝑅𝐷𝐷𝐷𝐷) + Long-term foreign investment inflow. (1)
In this identity, long-term foreign investment consists of foreign direct investment
(FDI) and portfolio investment (PI). Thus,
𝐾𝐾𝐾𝐾1 = ∆𝐷𝐷𝑅𝑅𝐷𝐷𝐷𝐷+ (𝐾𝐾𝐷𝐷𝐹𝐹+𝑃𝑃𝐹𝐹)𝑛𝑛𝑅𝑅𝐷𝐷 −(∆𝑅𝑅𝑅𝑅𝑅𝑅+𝐶𝐶𝐶𝐶 deficit). (2)1
According to the “residual method,” capital flight is estimated as the residual,
which should be zero on an accounting basis when netting out net FDI, net Portfolio
investment, new debt inflow, capital account deficit, and additional foreign reserves.
Because most of the discussions in capital flight literature focus on the 1980s Latin
American debt crisis, the assumption underlying this identity is that the countries are
short of foreign reserves and run current account deficits, and are thus heavily indebted.
If a country is running a current account deficit, then the shortage must be filled by FDI
inflow, portfolio investment inflow, increasing international liabilities (borrowing), or
the reversal of the existing foreign reserves. However, looking at the RRDCs analyzed
in this study, especially since the new millennium, they are not typically running current
account deficits owing to the high international resource prices.
Moreover, it should be noted that this estimation is asymmetric as it includes only
asymmetry, this definition produces ambiguity in the interpretation of the negative value
for estimated capital flight. Negative FDI and portfolio investment inflows indicate that
FDI and portfolio investments are withdrawn. This may contribute to negative capital
flight estimates; however, this should not be simply regarded as a reversal of capital
flight. Interpretation of negative capital flight estimates requires caution when there is a
decrease in foreign reserves to fill the international payment gap.
Another strong assumption of the “residual method” is that foreign debt inflows in
turn flow out of the debtor country, like a “revolving door,” as indicated by Boyce
(1992). However, if a country earns a large resource windfall, the current account will
be in surplus and the country will pay back the external debt so that the net debt transfer
is negative, and foreign reserves may also somewhat increase. In such cases, the
calculated capital flight can become negative, and again, this value should not be
regarded as a reversal of capital flight. Drawing on the above observations, this analysis
extends the “residual method.” That is, capital flight is symmetrically calculated as
follows.
KF = net FDI + net portfolio + net debt transfer + CA balance + reserve change
(either positive or negative). (3)
The assumption is that if a country runs a current account surplus, it will pay back
its foreign debt and increase its foreign reserves, and there can still be capital flight.
This assumption is based on the perception that there are increasing numbers of foreign
bank branches, even in developing countries, and especially where transnational
accelerated financial globalization, it is getting easier for residents in developing
countries to access foreign bank accounts. Figure 1 shows the size of capital flight for
the 21 countries studied here. The list of the countries and the data sources used for the
estimation are described in Appendix a and b.
It should be noted that this estimation does not consider the long-term interest that
may accrue to foreign assets. Some authors, such as Hermes and Lensink (1992) and
Ndikumana and Boyce (2003), focus on the stock of capital flight and estimate the
amount of capital flight including accumulated interest. However, the weight of this
analysis is more on the annual change in capital flight, and thus prefers to consider the
simply calculated capital flight as the bottom line.
According to the estimation, the size and trend of capital flight for the period
1990–2011 significantly differs from those found in earlier studies, such as Ndikumana
and Boyce (2003, 2011a) and Schneider (2003). For example, although the studied time
period does not coincide, the estimated capital flight from Nigeria in Ndikumana and
Boyce (2011a) shows a positive sign for almost whole period, while the current figure
for capital flight takes a large, positive number only for some years. This applies to
other countries and only a limited number of countries show consistent, positive capital
flight throughout the entire sample period.
(b) Capturing capital transfer
The size and trend of the capital outflow from developing countries through
foreign private companies have not attracted much academic attention. While little
attempts have been made to estimate such values, it is difficult to determine the exact
available statistical data to roughly speculate the size and trend of the capital that flows
out of RRDCs through TNCs.
The amount of money earned by TNCs and thus taxed by host governments and
then sent home is recorded as primary income debit, which appears in the Current
Account section of the Balance of Payment statistics. This amount, by far,
underestimates the extent of repatriated earnings of foreign companies, since most
internationally operating companies use the system of transfer pricing and use other
accounting techniques to avoid and reduce tax payment, as described in the previous
section. Nevertheless, primary income statistics are one of the important proxies
available to capture the TNCs’ role as a conduit of international capital transfers.
Alternatively, secondary income debit is also added to the primary income debit to
be more precise. While secondary income in the BOP includes workers’ remittances,
this amount is not large relative to the income earned by corporations, and thus the size
and trend do not change much.
Figure 2 shows calculated capital transfer for the 21 countries studied here.
Because the size of capital transfer strongly depends on industry type, the size of the
host country’s economy, and its relationship with former colonial countries, it is difficult
to set a criterion with which one can judge whether the capital transfer is too large or
within an acceptable range. Nonetheless, this figure helps shed light on the extent of
TNC influence on host countries’ economies.
Summary statistics of calculated capital flight and outflow is shown in Table 1.
Some countries such as Azerbaijan in the late 2000s or Malaysia in 2008 show the large
share of capital flight in GDP as around 20%, but the mean value of capital flight across
(1987) for example, the capital flight from Latin American countries such as Argentina,
Mexico, and Venezuela in the 1970s and 80s, is estimated to be around 20% to 25% of
GDP on average. It is apparent that capital flight, on average, is not that serious as in
Latin American countries in the 1980s. On other hand, the share of capital outflow in
GDP is relatively larger. The countries with large capital outflow share are Guyana,
Zambia, Nigeria, and Kazakhstan, ranging from 20% to 40% of GDP in several years.
Comparing Figures 1 and 2 also shows that the average estimated size of capital transfer
as a share of GDP is far larger than that of capital flight. This is noteworthy because,
while historically capital flight has attracted academic interest, capital transfer has
received less attention.
4. PANEL ANALYSIS
(a) Model
This section analyzes the determinants of capital flight and transfer using a time
series panel. Of greatest interest to this analysis is the influence of international resource
price movements on capital flight and transfer. The sample includes 21 RRDCs whose
selection is based on their respective share of natural resource rent in GDP and data
availability. The sample period is 1990–2011. Some data is lacking for several countries,
making the panel unbalanced.
In this regression, the international resource price is substituted by a proxy. The
international economic trend simultaneously affects all countries, and many resource
price movements are correlated to each other. Using a common natural price variable for
all countries as an explanatory variable will induce cross-sectional correlations, which
natural resource rent (NRR) is used as a proxy for international resource price. NRR is
taken from the World Bank’s World Development Indicators (WDI), and it is calculated
as the difference between commodity price and average production cost, multiplied by
production quantity (World Bank, 2011). Because NRR captures the quantity of
resource production of the country by definition, the change in NRR should not be
understood as simply equivalent to the price change. However, as shown in Figure 3, the
movement of both NRR and natural resource price change are closely synchronized2.
Ndikumana and Boyce (2003) point out that capital flight has characteristics of
hysteresis and their estimation model includes a one-term lag for dependent variable.
This analysis also attempts to follow their method. In the regression, to circumvent the
unit-root process and serial correlation, capital flight is measured as a share of GDP and
is differentiated because capital flight is a flow data, and thus takes both positive and
negative values. On the contrary, capital transfer is also a flow data, but this is because
this figure takes only positive values and is equivalent to the capital stock paid by the
host economy to foreign corporations each year. Thus, the data for capita transfer is
used as a form of natural log difference. Possibly because of this technical difference
between capital flight estimation and capital transfer estimation, while the
auto-regression model fits quite well for capital flight, the inclusion of a lag does not
improve the fitness of the model for capital transfer estimation. Thus, the regression
model is denoted as below.
𝐾𝐾𝐾𝐾𝑖𝑖,𝑡𝑡= 𝐾𝐾𝐾𝐾𝑖𝑖,𝑡𝑡−1+𝑁𝑁𝑅𝑅𝑅𝑅𝑖𝑖,𝑡𝑡+𝑋𝑋𝑖𝑖,𝑡𝑡+𝜐𝜐𝑖𝑖,𝑡𝑡, (4)
In equation (3), 𝐾𝐾𝐾𝐾𝑖𝑖,𝑡𝑡 is the size of capital flight previously calculated, and in
equation (4), 𝐾𝐾𝐾𝐾𝑖𝑖,𝑡𝑡 denotes capital transfer captured by the definition described in the
previous section. X is a vector of the macroeconomic indices explained below, and 𝜐𝜐𝑖𝑖,𝑡𝑡
and 𝜂𝜂𝑖𝑖,𝑡𝑡 are error terms. The explanatory variables such as NRR and the ones included
in X are assumed to be exogenous to capital flight and capital transfer.
(b) Explanatory variables
The selection of explanatory variables here is based on capital flight literature as
discussed below. Most of the data is taken from the BOP and the WDI. The detailed
definition and data source is described in appendix c.
Public Debt Flow [DEBT]: If new capital inflows as foreign borrowing indeed induces
and accelerates capital flight, as suggested by Dornbusch (1985), Cuddington (1987),
Pastor (1990), and Boyce (1992), an increase in debt flow leads to an increase in capital
flight (KF1). On the other hand, if this relationship does not apply, it suggests that the
mechanism of the Latin American debt crisis is not universal, regardless of the
similarities in the economic and political situations in RRDCs. While it is notoriously
difficult to measure the amount of new debt transfer or flow, for technical reasons, the
annual change rate of total debt stock including short-term debt is used. This figure
includes publicly guaranteed debt as well as non-guaranteed private debt.
Natural Resource Rent [NRR]: When international price and resource revenue increase,
NRR also increases. The increase in resource revenue means an increase in foreign
residents, the increase in NRR leads to increased capital flight. Also, a natural resource
price increase should lead to higher profits for resource-extracting companies. If these
TNCs are shifting profits out of RRDCs, the increase in NRR will lead to higher capital
transfers.
Foreign Direct Investment inflow [FDI]: In the period studied, a large amount of FDI is
directed to RRDCs’ natural resource sector (World Economic Forum et al, 2011). Some
RRDCs are indeed improving their investment climate and attracting more FDI,
although investment in RRDCs is reported to be increasing regardless of political and
economic risk within the host country’s economies. This increased FDI inflows can be a
reflection of the favorable local economic situation, which leads to a decline in capital
flight. On the other hand, from the corporate side, the increased FDI must be linked to
an increase in current or future profits, thus leading to an increase in capital transfers.
Inflation rate [INFLATION]: Drawing on Cuddington (1987) and Dooley (1988),
this analysis includes the inflation rate as an explanatory variable, but not the real
interest rate for data incompleteness. It is expected that the higher the inflation rate, the
lower the real interest rate, and this will lead to capital flight. On the other hand, the
influence of inflation on capital transfers is ambiguous because TNCs deal with foreign
currencies, which are immune from the local currency’s value fluctuations.
Oil Rent Share [OIL RENTS]: The problems of the natural resource curse are
sometimes discussed in the context of crude oil producer countries and named as the
political, and social problems (Ross, 2012). To capture the special characteristics of oil
countries, a dummy variable can be included. However, there is no simple criterion for
an oil country. For example, Indonesia is indeed producing crude oil, but it is a net oil
importer, and the economy is less dependent on oil production compared to other
countries that produce an equivalent amount of crude oil. Thus, to capture an economy’s
dependence on crude oil production, the oil-rent share of GDP is employed instead of
the dummy.
Africa dummy [AFRICA]: Some estimations on capital flight from African countries
suggest the distinguishingly large size of capital flight from the natural resource-rich
countries such as Nigeria (Boyce and Ndikumana, 2001; Ndikumana and Boyce, 2003,
2011a, 2011b; Schneider, 2003). The World Bank report in 1993 noted the huge capital
flight from Latin America, adding that “…Sub-Saharan Africa stands much worse than
Latin America and the Caribbean” (World Bank, 1993: 24). Furthermore, World
Financial Markets issued by the Morgan Guaranty Trust Company also names Nigeria
alongside South Africa in the list of the 18 worst-affected countries from capital flight
(Morgan Guaranty Trust Company, 1986: 13). Thus, to capture African characteristics,
the Africa dummy is included for the Sub-Saharan African countries.
There are several additional variables suggested to have an influence on capital
flight in the literature. However, many of them (such as government budget deficit or
GDP) are strongly correlated with the international price movement and resource
revenue, and thus are avoided in this estimation. On the other hand, Cuddington (1986)
outflow. While capital controls influence the legal capital flow, the situation of capital
controls is complicated, and thus, it is difficult to obtain a series of indices on capital
control. Therefore, the existence of capital controls is not included in the regression.
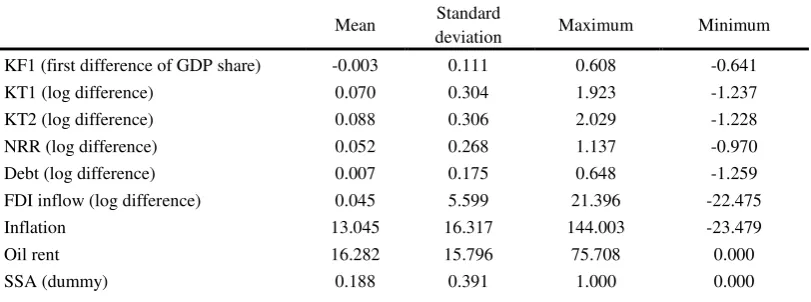
The summary statistics of the explanatory and dependent variables is shown in Table 2.
(c) Adequacy of the model and data
Macroeconomic analyses using panel data that consist of time series and
cross-county data, in many cases, uses the fixed effect model to mitigate the bias caused
by heterogeneity across the countries due to unobserved variables, such as technology,
institution, culture, or geography (de Mello, 1999). This analysis includes fixed effects
for each country, but the result of the F test failed to reject the null hypothesis that the
inclusion of an individual fixed effect for each country is redundant, and thus the fixed
effect model is not superior to the pooling model. Despite this result, and to control for
country characteristics and for comparison, the estimation results of the fixed effect
model are reported.
This analysis also decided to be cautious about the cross-section correlation. The
interest variable and NRR movement are highly correlated across countries because
they are affected by international price movements. To deal with this cross-sectional
correlation, the seemingly unrelated (SUR) model is employed (Avery, 1977).
Country selection is based on a total natural resource rent that is greater than 30%
of GDP, but the selection was strongly restricted to the available data. All countries are
developing countries and the GDP scale and industrial structure greatly differ among
countries. However, as mentioned above, these uncontrolled country characteristics do
GDP or converted to the growth rate to circumvent a heteroscedasticity bias or serial
correlation, as long as the conversions do not affect the interpretation of the value.
Moreover, the existence of panel-unit roots is tested using the Levin, Lin, and Chu test
(LLC test) and Breitung test for a common unit root across the cross section (Levin et al,
2002; Breitung, 2000). For the variables used in the regression, both tests rejected the
null hypothesis with the 1% significance level that the series have a unit root process
(Table 3).
(d) Results
Table 4 shows the regression results of the fixed effect model, and Table 5 shows
the results of the SUR model. In each model, a one-term lag of KF1 is large and
statistically significant. This can be interpreted as the hysteresis of capital flight, but this
can also be due to a weak serial correlation in KF1, even though the existence of the
unit-root process is rejected by tests.
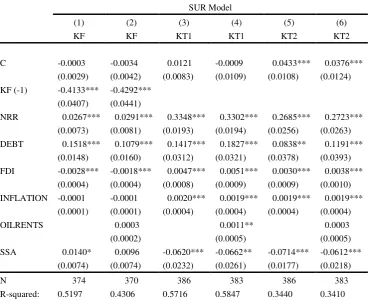
In the SUR model, NRR has a positive effect on capital flight and transfer,
although in the fixed effect model, it is not statistically significant on capital flight. This
result presents good reason to perceive a linkage between resource revenue and capital
flight, but it is possible that some specific countries strongly affect the results. On the
other hand, the positive effect of NRR on capital transfer implies that capital transfer
increases as international resource prices and corporate profits increase, thus the linkage
between the inflow of resource revenue and capital transfer also exists. While this is
quite a natural result, the coefficient size is noteworthy, as discussed below.
DEBT has positive, significant effects on capital flight and transfer, but the fixed
between capital inflow as new foreign borrowing and capital flight still exists, as
presented in the literature on Latin American debt in the 1980s. FDI has a negative
effect on capital flight in both models, implying that in an economy that is sound
enough to attract FDI, people do not feel the need to move their private assets abroad.
The effect of FDI on capital transfer is positive and significant in both models.
Contrary to the capital flight literature, INFLATION has a negative sign in both
models, but the coefficients are not statistically significant. This may be because, in
resource-rich countries, higher resource prices and economic growth are inevitably
associated with inflation. On the other hand, the effect on capital transfer is positive and
statistically significant, suggesting that higher inflation is associated with accelerated
capital transfers.
The oil resource rent share, OILRENTS, as an indicator of dependency on crude
oil, is positive but it is only statistically significant in the regression on capital transfer
in the SUR model. This can be interpreted to mean that oil countries’ characteristics are
not very different from those of other resource-rich countries, and thus the effect of the
oil-rent share is captured by NRR.
Finally, SSA included in the SUR model has a positive sign in the capital flight
estimation, although the statistical significance is on the border. Thus, the suggestion by
some studies that capital flight from African countries is much more serious than from
Latin American countries is weakly supported here. Contrarily, the Sub-Saharan Africa
dummy has a negative sign for the capital transfer estimation. This suggests that the
scale of capital transferred from Sub-Saharan African countries is less than that of other
regions. However, it should be noted that, on average, the African countries have
omitted from the figures declared as profits that are presented to the authorities.
While the equations are specified identically for both capital flight and transfer, the
coefficient of NRR in the regression of capital transfer turns out to be much larger.
From the estimation results in Table 4 and 5, a 1% change in NRR increases capital
flight as a share of GDP by about 0.027 to 0.035 percentage points on average. On the
other hand, a 1% change in foreign debt increases on an average of about 0.1 to 0.18
percentage points of capital flight as a share of GDP. This can be interpreted that the
borrowed capital inflow is more strongly related to the capital flight than earned capital
inflow.
On capital transfer, a 1% change in NRR increases capital transfer by 0.29 to
0.33% on average. While the change in NRR should not be directly interpreted as a
price change, there is a strong correlation between the two factors, and the international
resource price is very volatile. For example, on an annual basis, between 1990 and 2011,
the average annual crude oil price change rate was around 10%, but from 1999 to 2000,
the crude oil price jumped about 60%. In this extreme case, with the production cost and
quantity being equal, capital transfer from RRDCs is estimated to have increased by
about 17 to 20%.
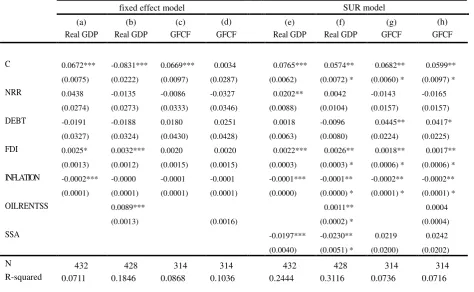
For comparison, the same set of explanatory variables is regressed on the real GDP
growth rate and on gross fixed capital formation, to examine NRR’s contribution. The
regression results are shown in Table 6. From the results, a 1% change in NRR
increased the GDP by only 0.02% in result (e) with SUR model. Moreover, the change
in NRR did not contribute to gross domestic capital formation, namely to domestic
transfer increases steadily and proportionally to the international resource price change,
while RRDCs’ economies do not benefit from price change as much as foreign
companies do.
5. CONCLUSION
This paper focuses on the capital outflow from RRDCs by calculating the amount
of capital flight and transfer from these countries. It also analyzes the determinants of
capital flight and transfer by using a macro panel data. Through the calculation of
capital flight and outflow, it is suggested that capital flight from RRDCs are not as
serious as the case of Latin American countries in the 1980s. The panel data analysis
suggests that the argument of previous literature on capital flight and its linkage with
public debt inflow still holds for the period 1990–2011. Changes in NNR as a proxy for
international resource price has an explanatory power on changes in capital flight and
transfer, and the effect of NNR on capital transfer is especially noteworthy.
The literature on capital flight has long discussed the domestic macroeconomic
situation and the failure of economic policy or institutional flaws as the causes of capital
flight. In other words, the causes of capital flight have been sought in capital-flight
suffering countries. However, this analysis of the 21 RRDCs analyzed here suggested
that the capital outflow through TNCs is much larger than capital flight. Although it is
natural that certain amount of capital is transferred as returns to FDI, the amount and
pace of capital transferred from RRDCs is greater and steadier than that at which
resource revenues of RRDCs contribute to the domestic economies. Because many
RRDCs’ economies are dependent on FDI in their natural resource industries, large
associated with economic development. Further study is needed to contribute to the
literature regarding the extent to which capital outflows from developing countries are
admissible, and the point at which they are considered excessive.
In recent years, international capital movement has substantially increased, and this
change should also have affected the developing countries so that the mechanism of
capital inflow to and outflow from developing countries should also have shifted. The
analysis of this shift is a task for future analysis.
As the Asian experience shows, the roles and contributions of FDI for developing
countries’ economies are crucial, as those countries are capital scarce and in need of
technology and investment. To prevent excess capital outflow, RRDCs’ governments
must provide conditions that attract domestic reinvestment. In other words, they must
establish the rule of law and foster reinvestment in the non-mining sectors. TNC
activities are expected to grow further in the future and their impact on developing
countries’ economies will also grow. This suggests the need to focus on the outflow of
References
Ajayi, S. I. (1995). Capital Flight and External Debt in Nigeria. AERC Research Paper,
35, African Economic Research Consortium.
Asiedu, E. (2006). Foreign Direct Investment in Africa: The Role of Natural Resources,
Market Size, Government Policy, Institutions and Political Instability. The World
Economy, 29(1), 63-77.
Auty, R. M. (1990). Resource-Based Industrialization: Sowing the Oil in Eight
Exporting Countries. Oxford: Clarendon Press.
Auty, R. M. (2006). Mining Enclave to Economic Catalyst: Large Mineral Projects in
Developing Countries. Brown Journal of World Affairs, 13(1), 135-145.
Avery, R. B. (1977). Error Components and Seemingly Unrelated Regressions.
Econometrica, 45(1), 199-209.
Barnes, S. T. (2005). Global Flows: Terror, Oil & Strategic Philanthropy. Review of
African Political Economy, 32(104/105), 235-252.
Boyce, J. K. (1992). The Revolving Door? The External Debt and Capital Flight: A
Philippine Case Study. World Development, 20(3), 335-349.
Boyce, J. K, & Ndikumana, L. (2001). Is Africa a Net Creditor? New Estimates of
Capital Flight from Severely Indebted Sub-Saharan African Countries, 1970-96.
Journal of Development Studies, 38(2), 27-56.
Breitung, J. (2000). The Local Power of Some Unit Root Tests for Panel Data. In B.
Baltagi (Ed.), Advances in Econometrics 15: Nonstationary Panels, Panel
Cointegration, and Dynamic Panels (pp. 161-178). Amsterdam: JAI Press.
Budina, N., Pang, G. & van Wijnbergen, S. (2007). Nigeria’s Growth Record: Dutch
Budina, N. & and van Wijnbergen, S. (2008). Managing Oil Revenue Volatility in
Nigeria: The Role of Fiscal Policy. In D. S. Go & J. Page (Eds.), Africa at a
Turning Point?: Growth, Aid, and External Shocks. Washington D.C.: World
Bank Publications.
Cuddington, J. T. (1986). Capital Flight: Estimates, Issues, and Explanations. Princeton
Studies in International Finance, 58, 1-40.
Cuddington, J. T. (1987). Macroeconomic Determinants of Capital Flight: An
Econometric Investigation. In D. R. Lessard & J. Williamson (Eds.), Capital
Flight and Third World Debt (pp. 85-100). New York: Institute for International
Economics.
Cuddington, J. T. (1989). Commodity Export Booms in Developing Countries. The
World Bank Research Observer, 4(2), 143-165.
Corden, W. M. & Neary, J. P. (1982). Booming Sector and De-Industrialisation in a
Small Open Economy. The Economic Journal, 92, 825-848.
Corden, W. M. (1984). Booming Sector and Dutch Disease Economics: Survey and
Consolidation. Oxford Economic Papers, new Series 36(3), 359-380.
de Mello Jr., L. R. (1997). Foreign direct investment in developing countries and
growth: A selective survey. The Journal of Development Studies,34(1), 1-34.
Dooley, M. (1988). Capital Flight: A Response to Differences in Financial Risks. IMF
Staff Papers, 35(3), 422-436.
Dooley, M., Helkie, W., Tryon, R. & Underwood, J. (1986). An Analysis of External
Debt Positions of Eight Developing Countries through 1990. Journal of
Dornbusch, R. (1985). External Debt, Budget Deficits, and Disequilibrium Exchange
Rates. In G. W. Smith & J. T. Cuddington (Eds.), International Debt and the
Developing Countries (pp. 213-235). Washington D.C.: World Bank.
Ferguson, J. (2005). Seeing Like an Oil Company: Space, Security, and Global Capital
in Neoliberal Africa. American Anthropologist,107(3), 377-382.
Ferguson, J. (2006). Global Shadows: Africa in the global order. Durham and London:
Duke University Press.
Gelb, A. H. (1988). Oil Windfalls: Blessing or Curse. Oxford: Oxford University Press.
Hermes, N. & Lensink, R. (1992). The Magnitude and Determinants of Capital Flight:
The Case for Six Sub-Saharan African Countries. De Economist, 140(4),
515-530.
International Monetary Fund (2009). Balance of Payment and International Investment
Position Manual: Sixth Edition. International Monetary Fund. Retrieved from
http://www.imf.org/external/pubs/ft/bop/2007/bopman6.htm.
International Monetary Fund (2012). Macroeconomic Policy Frameworks for
Resource-rich Developing Countries. International Monetary Fund. Retrieved
from http://www.imf.org/external/np/pp/eng/2012/082412.pdf.
International Monetary Fund (2013). Balance of Payments, CD-ROM.
Jones, G. (1993). British Multinational Banking 1830-1990. New York: Oxford
University Press.
Jones, G. (2005). Multinationals and Global Capitalism: from the Nineteenth to the
Twenty-first Century. Oxford and New York: Oxford University Press.
Kant, C. (1996). Foreign Direct Investment and Capital Flight. Princeton Studies in
Karl, T. L. (1997). Paradox of Plenty. Berkeley and Los Angeles: University of
California Press.
Karl, T. L. (2007). Ensuring Fairness. In M. Humphreys, J. D. Sachs & J. E. Stiglitz
(Eds.), Escaping Resource Curse (pp. 256-285). New York: Colombia
University Press.
Lessard, D. R. & Williamson, J. (1987). The Problem and Policy Responses. In D. R.
Lessard & J. Williamson (Eds.), Capital Flight and Third World Debt (pp.
201-254). Washington D.C.: Institute for International Economics.
Levin, A., Lin, C. F., & Chu, C. (2002). Unit Root Tests in Panel Data: Asymptotic and
Finite-Sample Properties. Journal of Econometrics, 108, 1–24.
Morgan Guaranty Trust Company (1986). World Financial Markets,March. New York:
Morgan Guaranty Trust Company of New York.
National Bureau of Statistics Nigeria (2011). Foreign Trade Statistics: Second Quarter
2011, 499. Abuja: National Bureau of Statistics.
Ndikumana, L. & Boyce, J. K. (2003). Public Debt and Private Assets: Explaining
Capital Flight from Sub-Saharan African Countries. World Development, 31 (1),
107-130.
Ndikumana, L. & Boyce, J. K. (2011a). Capital flight from sub-Saharan Africa: linkages
with external borrowing and policy options. International Review of Applied
Economics,25(2), 149-170.
Ndikumana, L. & Boyce, J. K. (2011b). Africa’s Odious Debts. London: Zed Books.
Nissanke, M. (2010). Commodity Market Structures, Evolving Governance and Policy
Issues. In M. Nissanke & G. Mavrotas (Eds.), Commodities, Governance and
York: Palgrave Macmillan.
Otusanya, O. J. (2011). The role of multinational companies in tax evasion and tax
avoidance: The case of Nigeria. Critical Perspective on Accounting, 22,
316-332.
Pastor, M., Jr. (1990). Capital Flight from Latin America. World Development, 18(1),
1-18.
Ross, M. (2012). The Oil Curse. Princeton: Princeton University Press.
Sachs, J. & Warner, A. W. (1995). Natural Resource Abundance and Economic Growth.
NBER Working Paper 5398. Cambridge, MA: NBER.
Sachs, J. & Warner, A. W. (2001). The Curse of Natural Resources. European
Economic Review 45, 827-838.
Schneider, B. (2003). Measuring Capital Flight: Estimates and Interpretations. Working
Paper 194. London: Overseas Development Institute.
Shaxson, N. (2011). Treasure Islands. London: Bodley Head/Random House.
Walter, I. (1987). The Mechanism of Capital Flight. In D. R. Lessard & J. Williamson
(Eds.), Capital Flight and Third World Debt (pp. 103-128). Washington, D.C.:
Institute for International Economics.
Walter, I. (1989). Secret Money. London: Unwin Hyman Limited.
World Bank (1993). Global Economic Prospects and the Developing Countries.
Washington D.C.:World Bank.
World Bank (2011). The Changing Wealth of Nations. Washington D.C.: World Bank.
World Bank (2013a). World Development Indicators. Retrieved from World DataBank,
http://databank.worldbank.org/data/.
http://databank.worldbank.org/data/.
World Economic Forum, the World Bank & the African Development Bank (2011). The
Africa Competitiveness Report 2011. Geneva: World Economic Forum.
Notes
1. In the BOP data, foreign reserve increase is regarded as an equivalent of capital
outflow, and thus, the figure is entered with a negative sign. Applying this BOP
notation to equation (2), 𝐾𝐾𝐾𝐾1 = ∆𝐷𝐷𝑅𝑅𝐷𝐷𝐷𝐷+ (𝐾𝐾𝐷𝐷𝐹𝐹+𝑃𝑃𝐹𝐹)𝑛𝑛𝑅𝑅𝐷𝐷+∆𝑅𝑅𝑅𝑅𝑅𝑅+𝐶𝐶𝐶𝐶deficit. In
the latest BOP updates, data after 2005 are organized in accordance with the Balance
of Payments and International Investment Position Manual, Sixth Edition (BPM6,
IMF 2009). For estimation in this analysis, new BOP data is also utilized and signs
are adjusted where relevant.
2. Among many metal and energy prices, crude oil prices are most strongly correlated to
Figure 3. Natural Resource Rent and Real Oil Price (annual growth rate)
Capital flight Capital transfer
Mean -0.0019 0.0796
Median -0.0011 0.0678
Maximum 0.2059 0.4348
Minimum -0.3911 0.0064
Std. Dev. 0.0530 0.0601
[image:37.595.86.404.109.211.2]
Observations 403 403
Table 2. Summary statistics of the panel data
Mean Standard
deviation Maximum Minimum
KF1 (first difference of GDP share) -0.003 0.111 0.608 -0.641
KT1 (log difference) 0.070 0.304 1.923 -1.237
KT2 (log difference) 0.088 0.306 2.029 -1.228
NRR (log difference) 0.052 0.268 1.137 -0.970
Debt (log difference) 0.007 0.175 0.648 -1.259
FDI inflow (log difference) 0.045 5.599 21.396 -22.475
Inflation 13.045 16.317 144.003 -23.479
Oil rent 16.282 15.796 75.708 0.000
[image:37.595.88.494.267.418.2]Table 3. Panel unit root test results
Series Test common unit root
Levin, Lin and Chua
Breitunga
KF Level (constant US$) -0.357 4.533
GDP share -2.200** 2.496
First difference of GDP share -15.332*** -2.218**
KT1 Level (constant US$) -0.923 2.828
GDP share -3.161*** -2.522***
Log difference -14.006*** -7.609***
KT2 Level (constant US$) -0.298 4.064
GDP share -3.207*** -2.787***
Log difference -12.740*** -8.240***
NRR Level (constant US$) -1.0877** 1.255
GDP share -3.850*** -1.080
Log difference -12.770*** -4.340***
Debt Level (constant US$) 0.102 3.765
GDP share -4.174*** 0.308
Log difference -14.814*** -4.213***
FDI Level (constant US$) -1.254 1.1417
GDP share -4.407*** -3.122***
Log difference -14.836*** -2.346***
Inflation Percentage from ba -39.226*** -6.067***
Oil rent GDP share -4.989*** -3.882***
a. Both unit root tests include individual intercept and trend. Lag lengths are selected according to the Schwartz Information Criterion.
fixed effect model
(1) (2) (3) (4) (5) (6)
KF KF KT1 KT1 KT2 KT2
C -0.0029 -0.0230 0.0198 -0.0292 0.0480** -0.0129
(0.0062) (0.0185) (0.0196) (0.0478) (0.0201) (0.0490)
KF(-1) -0.3714*** -0.3936*** (0.0517) (0.0526)
NRR 0.03480 0.0295 0.3093*** 0.2929*** 0.2732*** 0.2541***
(0.0212) (0.0221) (0.0552) (0.0587) (0.0568) (0.0602)
DEBT 0.1779*** 0.1364*** 0.0217 0.0560 -0.0413 -0.0041
(0.0332) (0.0358) (0.0852) (0.0922) (0.0877) (0.0946)
FDI -0.0037*** -0.0024** 0.0053** 0.0057** 0.0027 0.0036
(0.0010) (0.0010) (0.0025) (0.0026) (0.0026) (0.0027)
INFLATION -0.0001 -0.0001 0.0026** 0.0024** 0.0019* 0.0017
(0.0002) (0.0002) (0.0010) (0.0010) (0.0011) (0.0011)
OILRENTS 0.0012 0.0032 0.0039
(0.0011) (0.0028) (0.0028)
N 374 370 386 383 386 383
R-squared: 0.2346 0.2008 0.1923 0.1959 0.1541 0.1632
a. Standard errors in parenthesis.
[image:39.595.86.477.102.381.2]SUR Model
(1) (2) (3) (4) (5) (6)
KF KF KT1 KT1 KT2 KT2
C -0.0003 -0.0034 0.0121 -0.0009 0.0433*** 0.0376***
(0.0029) (0.0042) (0.0083) (0.0109) (0.0108) (0.0124) KF (-1) -0.4133*** -0.4292***
(0.0407) (0.0441)
NRR 0.0267*** 0.0291*** 0.3348*** 0.3302*** 0.2685*** 0.2723*** (0.0073) (0.0081) (0.0193) (0.0194) (0.0256) (0.0263) DEBT 0.1518*** 0.1079*** 0.1417*** 0.1827*** 0.0838** 0.1191***
(0.0148) (0.0160) (0.0312) (0.0321) (0.0378) (0.0393) FDI -0.0028*** -0.0018*** 0.0047*** 0.0051*** 0.0030*** 0.0038***
(0.0004) (0.0004) (0.0008) (0.0009) (0.0009) (0.0010) INFLATION -0.0001 -0.0001 0.0020*** 0.0019*** 0.0019*** 0.0019***
(0.0001) (0.0001) (0.0004) (0.0004) (0.0004) (0.0004)
OILRENTS 0.0003 0.0011** 0.0003
(0.0002) (0.0005) (0.0005)
SSA 0.0140* 0.0096 -0.0620*** -0.0662** -0.0714*** -0.0612*** (0.0074) (0.0074) (0.0232) (0.0261) (0.0177) (0.0218)
N 374 370 386 383 386 383
R-squared: 0.5197 0.4306 0.5716 0.5847 0.3440 0.3410
a. Standard errors in parenthesis.
[image:40.595.90.460.100.404.2]Table 6. Regression results on real GDP and gross fixed capital formation (GFCF)ab
fixed effect model SUR model
(a) (b) (c) (d) (e) (f) (g) (h)
Real GDP Real GDP GFCF GFCF Real GDP Real GDP GFCF GFCF
C 0.0672*** -0.0831*** 0.0669*** 0.0034 0.0765*** 0.0574** 0.0682** 0.0599** (0.0075) (0.0222) (0.0097) (0.0287) (0.0062) (0.0072) * (0.0060) * (0.0097) *
NRR 0.0438 -0.0135 -0.0086 -0.0327 0.0202** 0.0042 -0.0143 -0.0165 (0.0274) (0.0273) (0.0333) (0.0346) (0.0088) (0.0104) (0.0157) (0.0157)
DEBT -0.0191 -0.0188 0.0180 0.0251 0.0018 -0.0096 0.0445** 0.0417*
(0.0327) (0.0324) (0.0430) (0.0428) (0.0063) (0.0080) (0.0224) (0.0225)
FDI 0.0025* 0.0032*** 0.0020 0.0020 0.0022*** 0.0026** 0.0018** 0.0017** (0.0013) (0.0012) (0.0015) (0.0015) (0.0003) (0.0003) * (0.0006) * (0.0006) *
INFLATION -0.0002*** -0.0000 -0.0001 -0.0001 -0.0001*** -0.0001** -0.0002** -0.0002** (0.0001) (0.0001) (0.0001) (0.0001) (0.0000) (0.0000) * (0.0001) * (0.0001) *
OILRENTSS 0.0089*** 0.0011** 0.0004
(0.0013) (0.0016) (0.0002) * (0.0004)
SSA -0.0197*** -0.0230** 0.0219 0.0242 (0.0040) (0.0051) * (0.0200) (0.0202)
N 432 428 314 314 432 428 314 314
R-squared 0.0711 0.1846 0.0868 0.1036 0.2444 0.3116 0.0736 0.0716
a. Standard errors in parenthesis.
b. Dependent variables are in log difference form.
Appendix a. List of the countries included in the sample
Algeria Gabon a Papua New Guinea
Azerbaijan Guinea a Russia
Bolivia Guyana Syria
Chile Indonesia Venezuela
Congo a Kazakhstan Vietnam
Ecuador Malaysia Yemen
Egypt Nigeria a Zambia a
a. Categorized as Sub-Saharan African country in the analysis.
Appendix b. The data sources used for estimation of capital flight and transfer
Data Definition Source
FDI Net of foreign direct investment inflow and
outflow, current US$.
Balance of payment (IMF)
Portfolio investment Net of portfolio investment inflow and outflow, current US$.
Balance of payment (IMF)
Debt transfer Total change in external debt stocks, current US$.
International debt statistics (World Bank)
Capital account balance Balance on goods, services and incomes. Balance of payment (IMF) Foreign reserve change Annual change of reserved asset Balance of payment (IMF) Primary income debit Primary income, total debit, current US$. Balance of payment (IMF) Secondary income debit Secondary income, debit, current US$. Balance of payment (IMF)
Appendix c. The data sources used for the panel estimation
Data Definition Source
KF1 Calculated as described in the text. Converted to constant US$. ---
KT1 Calculated as described in the text. Converted to constant US$. --- KT2 Calculated as described in the text. Converted to constant US$. ---
NRR Total natural resource rent in level is calculated by multiplying the original data (% of GDP) with constant GDP.
World Development Indicators (World Bank)
DEBT External debt stocks, total. Original data in current US$ is converted to constant US$.
International debt statistics (World Bank)
FDI Foreign direct investment, net inflows in reporting economy. Converted to current US$.
International debt statistics (World Bank)
INFRATION Inflation, consumer prices (annual %). World Development
Indicators (World Bank)
OILRENTS Crude oil rent share in GDP. World Development
Indicators (World Bank)