Munich Personal RePEc Archive
The Effectiveness of Competition Policy:
An Econometric Assessment in
Developed and Developing Countries
Samà, Danilo
2013
The Effectiveness of Competition Policy:
An Econometric Assessment
in Developed and Developing Countries
∗
Danilo Sam`
a
†LUISS “Guido Carli” University of Rome
2013
Abstract
The ultimate objective of the present paper is to empirically investigate the effectiveness of competition policy in developed and developing countries. Although its importance is continuously increasing, the effectiveness of competition policy still seems to lack the attention that it would deserve. At the present state of art, the number of academic con-tributions that attempts to estimate its impact on relevant economic variables appears very limited, in particular for the less developed countries. However, an empirical litera-ture aimed at measuring in objective terms the effect of competition policy on economic growth is emerging, starting from narrow variables of interest, such as Gross Domestic Product and Total Factor Productivity. As a result, the principal aim of the current work is to contribute to this branch of research, focusing on broader indicators of market performance, in order to understand whether the presence of an antitrust authority has a significant impact, thus an effective utility, on the level of competition of a country.
Keywords: Competition Authorities, Competition Policy, Developed Countries, Devel-oping Countries, Economic Development, Economic Growth, Law & Economics, Market Concentration, Market Efficiency, Market Performance, New Institutional Economics, Po-litical Economy.
JEL Classification: C21; C26; K21; L40
∗The present paper was prepared during a visiting period at the Toulouse School of Economics (France). The
author, who remains the only responsible for the views expressed, would like to thank Prof. Roberto Pardolesi, Prof. Giuseppe Ragusa, Prof. Paul Seabright, Prof. Priscila Souza and Dr. Giacomo Luchetta for the kind comments and suggestions offered and Prof. Stefan Voigt for the access to the dataset hereby indicated as Voigt (2009). The dataset built for the purposes of the current work is available upon request.
†Ph.D. Candidate and Researcher in Economic Analysis of Competition Law and Law & Economics LAB
≪This was one of the best things about Lennon and McCartney, the competitive element within the team. It was great. But hard to live with≫.
Paul McCartney
1
Research Proposal
The ultimate objective of the present paper is to investigate empirically the effec-tiveness of competition policy in developed and developing countries. Although its importance is continuously increasing, competition policy still seems to lack the attention it would deserve. At the present state of art, the number of academic contributions that attempts to estimate its impact on relevant economic variables appears very limited, in particular for the less developed countries. However, an empirical literature aimed at measuring in objective terms the effect of competition policy on economic growth is emerging, starting from narrow variables of interest, such as Gross Domestic Product (GDP) and Total Factor Productivity (TFP).
As a result, the principal aim of the current work is to contribute to this branch of research, focusing on broader indicators of market performance, in order to un-derstand whether the presence of an antitrust authority has a significant impact, thus an effective utility, on the level of competition of a country. In other terms, the research question behind the current work is rather straightforward: is a com-petition authority active in a developed or developing country able to implement effectively its primary role? If not, which are the institutional functions and powers that should be strengthened?
2
Literature Review
According to the mainstream economic school of thought, competition is the critical process for a market economy to ensure the optimal allocation of resources and the highest level of social welfare. As it is common knowledge, in fact, competitive mar-kets enable consumers to purchase better products at lower prices and incentivize firms to improve the quality of the goods and services offered. However, notwith-standing its natural benefits, the functioning of competition is not automatic but must be sustained through an intervention by the state, which normally occurs with the adoption of a competition legislation and the creation of a competition authority predisposed to the role of promoter of market democracy. Nevertheless, despite the general consensus, at least from a theoretical standpoint, on the necessity of foster-ing competition in order to support economic efficiency and fairness on the markets, what appears extremely surprising is the almost absence of academic contributions trying to assess empirically the effectiveness of competition policy. In the present section, therefore, we provide a brief and exhaustive overview of the rather few re-sults obtained in the empirical literature.
Dutz and Vagliasindi (2000)1 are the first to overtake the traditional and subjec-tive indicators typical of the previous literature, which was limited to an evaluation of the competition legislations as “in the books”. The authors, in fact, exploiting cross-sectional data and looking at the actual practice in 18 transition countries, measure the effectiveness of the different competition policy regimes according to three criteria (i.e. 1. enforcement; 2. competition advocacy; 3. institutional effec-tiveness). The main result is a positive impact of competition policy on the intensity of competition, the latter as captured by an indicator of economy-wide enterprise mobility. However, the essential drawback of the study remains the low number of countries for which data are available.
Krakowski (2005)2, after a regression analysis for a sample of 101 countries, reaches two main conclusions: firstly, the experience of the competition authority and the institutional quality of the government explain a substantial part of the
1Dutz, M.A., Vagliasindi, M. (2000), Competition Policy Implementation in Transition
Economies: An Empirical Assessment, European Economic Review, Vol. 44, Elsevier, Amster-dam, The Netherlands, pp. 762-772.
2Krakowski, M. (2005), Competition Policy Works: The Effect of Competition Policy on the
perception of the effectiveness of competition policy; secondly, the perceived effec-tiveness of competition policy and the size of the economy are of significant influence on the perceived intensity of local competition, while the presence of an external protection policy seems to not have any impact.
Kee and Hoekman (2007)3
, analyzing a dataset of 42 countries and 18 industries from 1981 to 1998 and controlling for the number of firms and imports, study the effect of competition policy on a derived industry mark-up function of price over marginal cost, which is taken as a proxy for the intensity of competition. Although no significant impact is found, the authors observe that market entry is facilitated by the existence of a competition legislation, thus it has an indirect and positive effect on the level of domestic competition. The main drawback of the contribution is that it simply employs a binary variable indicating whether a competition policy regime is in force.
Petersen (2013)4
, using a dataset of 154 countries from 1960 to 2005, finds that competition policy has a strong effect on the level of GDP after ten years, whilst there is no relevant impact on the quality of democracy. Thus, economic decon-centration seems to not favor the transition to a democratic regime or to strength the stability of an established democracy. The most plausible reason for this might be that competition policy is not designed to prevent economic concentration at conglomerate and national level (fact that, in turn, could promote democracy) but only in particular and specific sectors. Also here, the main weakness of the study is that the effect of competition policy is merely controlled for by a dummy variable.
In the end, Buccirossiet al. (2013)5
estimate the impact of competition policy on productivity growth, analyzing a sample of 22 industries in 12 OECD countries from 1995 to 2005. In order to measure the effectiveness of the different competition policy regimes, the authors construct, principally on the base of a tailored questionnaire, a set of Competition Policy Indicators (CPIs), assessing, for each country and each
3
Kee, H.L., Hoekman, B. (2007), Imports, Entry and Competition Law as Market Disciplines, European Economic Review, Volume 51, Issue 4, Elsevier, Philidelphia, United States, pp. 831-858.
4
Petersen, N. (2013), Antitrust Law and the Promotion of Democracy and Economic Growth, Journal of Competition Law & Economics, Vol. 9, Oxford University Press, Oxford, United King-dom, pp. 593-636.
5
year, the antitrust infringements (the Antitrust CPI), the merger control process (the Mergers CPI), the institutional features (the Institutional CPI), the enforcement features (the Enforcement CPI) and all the information on the competition policy regime in a jurisdiction (the Aggregate CPI). The main conclusion is essentially a positive and significant relationship between competition policy and TFP. Although the only drawback of the contribution is the small size of the sample, exclusively restricted to a part of the OECD countries, the methodology adopted as well as the indicators built will certainly be very useful for future in-depth analyses and refinements.
3
Dataset Description
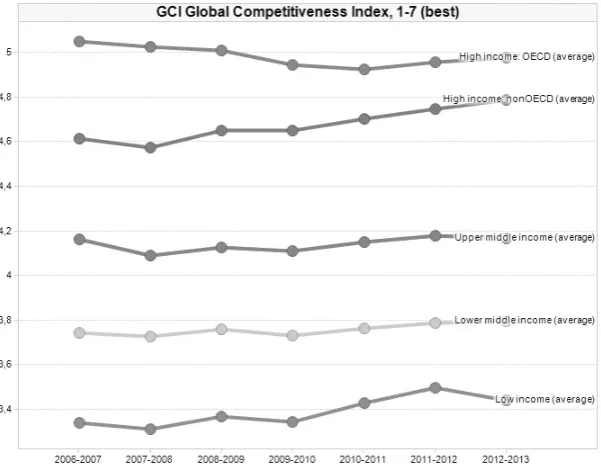
In the present paper, the empirical assessment has been divided into two main parts. The first part is dedicated to analyze developed and developing countries together, in order to obtain a general overview of the phenomenon studied, while the second part is devoted to examine exclusively developing countries, in order to understand whether the adoption of a competition policy regime should be among the priorities in the political agenda of an emerging country. The main reason for this distinction is to disentangle the effect of competition policy in such different contexts. This comparison may provide a better picture of the impact, also because in developing countries competition policy has been introduced only recently in comparison to developed countries (cf. Appendix A - Figure A.1 & A.2).
Accordingly, the first group includes the majority of OECD countries (i.e. 28 nations), whilst the second group includes all the developing countries for which data for the purposes of the current work are available (i.e. 51 nations). Hence, the total number of countries present in the sample is 79 (by 2008, 111 countries had enacted a competition legislation6
). The result is a cross-sectional dataset, created ad hoc merging several existing datasets, with 2008 as common reference year. At this stage, it is important to point out that in the empirical analysis at issue, in a broader sense, for competition policy we mean any national law which promotes market fairness by regulating anti-competitive conducts undertaken by firms, while for competition authority we mean any institution which is predisposed to its enforcement and is not sector specific.
6
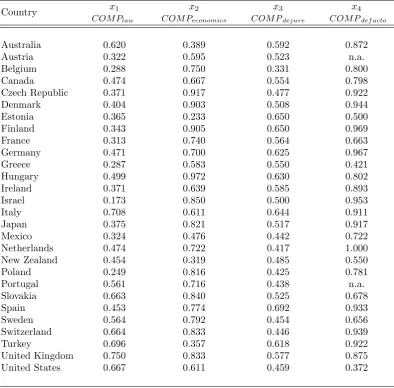
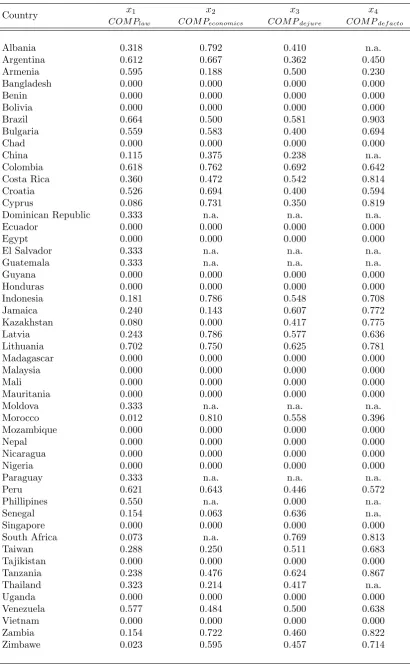
The independent variables block of our dataset, i.e. the set of input variables to be tested in order to verify if they are the cause of the phenomenon object of study, results from a questionnaire submitted to competition agencies worldwide in 2007 and from which four indicators relative to the institutional quality of competition policy of each country are derived and used in Voigt (2009)7
. In particular, the sur-vey, whose response rate is around 63%, was sent to 140 agencies belonging to the International Competition Network or participating to the Intergovernmental Group of Experts on Competition Law and Policy. The questionnaire was constructed so that respondants would not have to express personal perceptions but provide factual information about the national competition policies. For this reason, it is possible to state that the group of variables at issue is based on objective indicators and not subjective ones that instead might imply measurement errors (cf. Appendix A - Table A.1.1 & A.1.2).
The dependent variables block of our dataset, i.e. the set of output variables to be tested in order to verify if they are instead the effect of the phenomenon object of study, results from the Global Competitiveness Report, annually published by the World Economic Forum (2013), which assesses the class of factors, institutions and policies that influence the current and medium-term levels of economic prosperity of 144 different countries. Since 2004, the report proposes a wide range of data, based on 110 variables and 12 pillars, about areas such as competition, education, finance, health, infrastructure, institutions, labour and technology, mainly as a re-sult of over 15,000 surveys with leading business executives who are asked to rank the determinants of competitiveness of the respective countries. This corresponds to an average of 100 respondents per country. Interestingly for our purposes, the study offers the Global Competitiveness Indexes (GCI)8
measuring the microeconomic and macroeconomic foundations of national competitiveness worldwide (cf. Appendix A - Table A.2.1 & A.2.2).
In this regard, it is necessary to notice that, at least at the present state of art, there is a practical impossibility to find objective data about the intensity of market power, solution that would represent of course a first best scenario for our
7
Voigt, S. (2009),The Effects of Competition Policy on Development. Cross-Country Evidence Using Four New Indicators, The Journal of Development Studies, Volume 45, Issue 8, Routledge, London, United Kindom, pp. 1225-1248.
8
study. The basic reason for this limitation is that data such as level of concentration, mark-up on prices or number of market entries are available only for specific sectors of certain nations and in any case would remain rather insignificant if computed with respect to an entire economy. Thus, we are forced to proceed to a second best scenario, that is to recur to indicators of market performance obtained from evalu-ations expressed by business respondents about the personal opinion of a country’s intensity of competition. Despite the unavoidable drawbacks that this solution en-tails, being data extracted from surveys not perfectly objective, the present paper still desires to investigate at a macroeconomic and preliminary level whether the presence of a competition authority affects the degree of competition of a nation. Future research, having at its disposal more rigorous and significant data, could certainly provide further answers to the research question at issue.
4
Econometric Model
The econometric model developed for the present paper aims at estimating in de-veloped and developing countries the effect on market performance of competition policy, the latter evaluated according to four institutional indicators. These indi-cators, built in Voigt (2009) and originally used to assess empirically the impact of competition policy on TFP, basically reflect: 1. the substantive content of the competition law; 2. the degree to which the competition law incorporates an eco-nomic approach; 3. the formal independence of the competition authority; 4. the factual independence of the competition authority. In particular, as mentioned in the previous section, this set of indicators has been constructed as a result of a questionnaire formed of 30 questions and submitted to 140 competition authorities worldwide. Each institutional indicator has been adjusted and weighted in order to take a value between 0 and 1, where a greater value implies a higher degree of competition orientation or authority independence.
The second institutional indicator, concerning the degree to which the compe-tition law rely on an economic reasoning, results from 3 questions: the number of anti-competitive practices for which a rule of reason (i.e. case-by-case and effects-based approach) instead of a per se rule (i.e. formal and legal-effects-based approach) is applied; the number of concepts and theories developed by economists in recent years which are contemplated by the competition law (e.g. collective dominance, conglomerate effects, effects doctrine, leniency programs); in case of merger control, if efficiencies and remedies are set forth by the competition law, under the assump-tion that both instruments reflect a rule of reason rather than a per se rule.
The third institutional indicator, related to the formal independence of the com-petition authority, results from 13 questions: if the comcom-petition authority is super-vised by and subject to the power of the government; if members of the government can issue instructions to or overrule the decisions provided by the competition au-thority; if the decisions of the competition authority are subject to judicial review by the courts; if competition is the only objective pursued by the competition author-ity or there are other tasks; the number of competences assigned to the competition authority; the level of influence of the government on the appointment of the com-petition authority’s head; the length of service of the comcom-petition authority’s head; if the competition authority’s head can be re-elected and how can be dismissed; if there is a rule preventing reduction in wages for the officials; if there is a rule for the allocation of incoming cases among the officials; if the competition authority is required to publish the motivations of the decisions rendered.
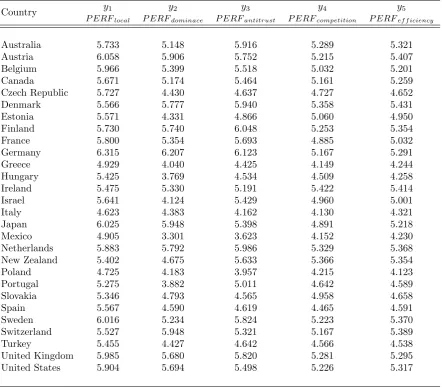
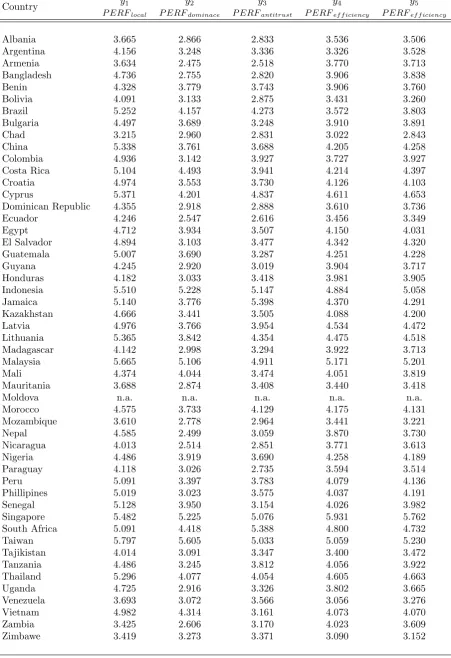
As a result, the four institutional indicators, which basically evaluate the degree of competition orientation and authority independence of developed and developing countries, are investigated in the current work on five indicators of market perfor-mance, being here interested in verifying whether the former has a direct effect on the latter. These five indicators of market performance, built by the World Eco-nomic Forum (2013), essentially measure: 1. the intensity of local competition; 2. the extent of market dominance; 3. the effectiveness of anti-monopoly policy; 4. the intensity of national competition; 5. the goods market efficiency. In particular, as mentioned in the previous section, this set of indicators has been extracted from the 6th
pillar (i.e. Goods Market Efficiency) of the Global Competitiveness Indexes (GCI), which in turn have been constructed as a result of over 15,000 surveys with leading business executives working in 144 countries worldwide. Each performance indicator has been adjusted and weighted in order to take a value between 1 and 7, where a greater value implies a higher degree of market efficiency.
The first performance indicator results from the question asked to business exec-utives to assess the intensity of competition in the respective local markets, ranging from limited to intense in most industries; the second performance indicator results from the question to characterize the corporate activity in the respective countries, ranging from dominated by a few business groups to spread among many firms; the third performance indicator results from the question to evaluate to what extent anti-monopoly policy promotes competition in the respective countries; the fourth and fifth performance indicators result from the questions to evaluate the intensity of competition and the goods market efficiency at aggregate and national level.
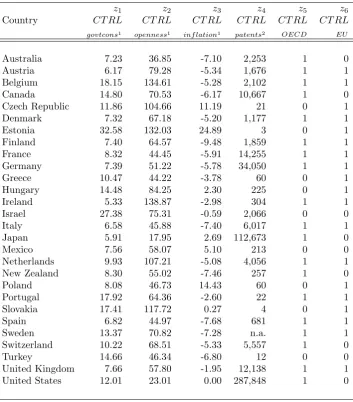
Accordingly, in our econometric model, the four institutional indicators are em-ployed as explanatory and independent variables, whilst the five performance indi-cators are used as explained and dependent variables. Nevertheless, all the variables that may affect the relationship between the variables of primary interest must be monitored, even though they may not be the focus of the study. Control variables, in fact, allow the econometrician to strictly measure the effect under examination, avoiding the so-called omitted-variables bias and improving the goodness of fit of the econometric model. Therefore, along the lines of Voigt (2009), we employ four standard economic control variables, such as the government consumption, the trade openness, the rate of inflation (Hestonet al., 2002)9
and the patents protection (U.S.
9
Com-Department of Commerce, 2005)10
, under the reasonable assumption that they are all factors which influence, positively or negatively, the establishment of a competi-tive environment. Moreover, we must consider two other control variables, that are an EU dummy, being present in our dataset countries members of the European Union subject not only to the respective national competition authorities but also to the vigilance exercised by the Directorate-General for Competition (DG COMP) of the European Commission, and an OECD dummy, being present in our dataset as well countries members of the Organisation for Economic Co-operation and De-velopment (OECD) which are characterized by a higher level of social welfare (cf. Appendix A - Table A.3.1 & A.3.2). The five control variables are the same for the five dependent variables, since the performance indicators are likely to be affected by similar dynamics. As a result, our regression equation can be written as follow:
P ERFi = α + β(COM Pi) + γ(CT RLi) + εi
Furthermore, the high intensity of competition typical of developed countries, as well as the high extent of market dominance typical of developing countries, might facilitate the establishment and the effectiveness of a competition authority. This mechanism raises the question of endogeneity, as reverse causality (i.e. the effect precedes the cause, contrary to normal causation) might emerge between the depen-dent and independepen-dent variables of our econometric model. In order to deal with this issue, we employ a further category of variables, that are the instrumental variables. In a nutshell, an instrument is a variable, not present in the regression equation, which affects the explained variable only through its effect on the explanatory vari-able, meaning that it is correlated with the latter but not with the (error term of the) former. Using an instrumental variable is therefore a method to clean out any endogenous relationship between dependent and independent variables, since we obtain new and filtered explanatory variables which can be correctly tested on the explained variables. In particular, in our econometric model, we use the same three instrumental variables for each of the four independent variables. Actually, endogeneity problems may still remain due to omitted variables. For this reason, as above-mentioned, we recur to several controls as well.
parisons at the University of Pennsylvania, Philadelphia, United States, available on the web-site pwt.sas.upenn.edu.
10
The first instrument is a dummy variable for former British colonies (Hestonet al., 2002). As proved by historical evidence, a common law legal system, typical of countries that in the past belonged to the British Empire, is more likely to adopt a competition policy regime than a civil law legal system, so that the rule of law influences the enforcement of an institution such as a competition authority. The second instrument is the age of democratic regime (Keeferet al., 2013)11, under the assumption that a country with a longer democratic tradition is in more suitable conditions to establish and enforce a competition policy regime. The third instru-ment is the ethnic and linguistic fractionalization (Alesina et al., 2003)12, element that traduces the difficulty of implementing valuable institutions (cf. Appendix A -Table A.4.1 & A.4.2).
We can now proceed with the estimation phase. At a first step, we will employ as estimation technique the Ordinary Least Squares (OLS), without and with con-trol variables, in order to carry out a preliminary assessment. At a second step, after evaluating the validity of the instruments chosen through the Sargan test, we will employ as estimation techniques the Two-Stage Least Square (2SLS) and the Generalized Method of Moments (GMM), being able to improve the prediction qual-ity of our econometric model exploiting the information provided by the instruments.
5
Estimation Results
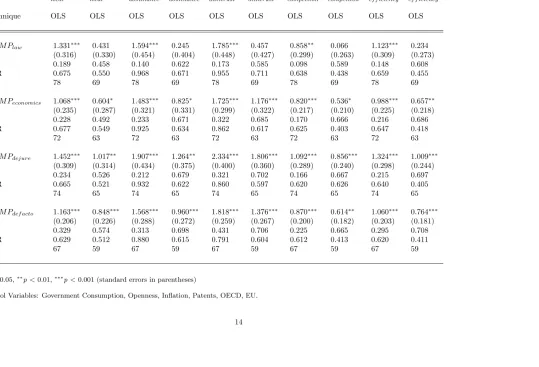
In order to obtain a general overview of the phenomenon object of study, as above-mentioned, firstly we analyze developed and developing countries together. From Table 1, which contains the OLS regression estimates without and with the stan-dard economic control variables, basically we can observe that all the institutional indicators present the desired sign, that is a positive impact on all the performance indicators, although rather marginal but more significant when control variables are considered. In words, this means that competition authorities, even tough to some extent, are usually able to implement effectively the role of promoters of fair
com-11Beck, T., Clarke, G., Groff, A., Keefer, P., Walsh, P. (2001), New Tools in Comparative
Political Economy: The Database of Political Institutions, World Bank Economic Review, The World Bank, Washington D.C., United States, pp. 165-176, available (updated to 2013) on the web-site www.worldbank.org.
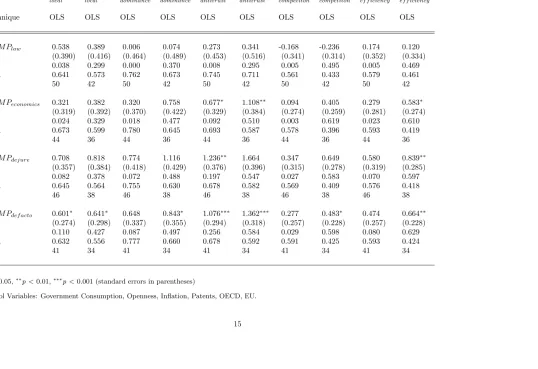
petition. From Table 2, which contains instead the OLS regression estimates when exclusively developing countries are examined, we can observe that only the formal independence of the competition authorities positively impacts on the performance indicators, while the degree to which the competition law incorporates an economic approach and the formal independence of the competition authority present a sig-nificant impact in a limited number of cases. On the contrary, the fact that an emerging country has adopted a specific legislation safeguarding competition seems to not have any real effect on the markets.
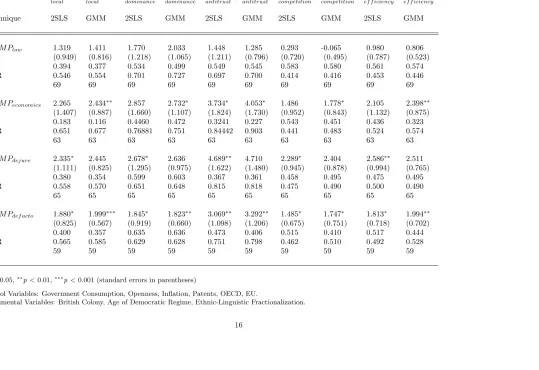
For a more sophisticated inference analysis based on estimation methods such as 2SLS and GMM it is necessary first of all to check the relevance of the instruments chosen. In an overidentified model like ours, where the number of instrumental vari-ables exceeds the number of explanatory varivari-ables, we can use the Sargan’s test to verify the validity of the instruments selected. The Sargan’s statistic, which is a particular case of the Hansen’s test for overidentified restrictions, is distributed as a Chi-Squared with K - L degrees of freedom, where K is equal to the number of instruments and L is equal to the numbers of endogenous regressors in the original model, under the null hypothesis that the error term is uncorrelated with the instru-ments. Therefore, in the present setting, we have two degrees of freedom, having for each regression equation three instruments and one endogenous regressor. The validity of the instruments for all four institutional indicators of both developed and developing countries has been tested. The result is similar for all, that is a p-value
higher than the standard level of significance of 0.05, thus we cannot reject the null hypothesis and we can conclude that the overidentifying restriction is valid. Con-sequently, even though this test has low power and provides no guarantee that the instruments used are valid, it brings further evidence to support the direction of our results.
matter most. Furthermore, the impact of the formal independence of competition
authorities appears strengthened in comparison to that one obtained through the
OLS estimation, whilst the presence of economists still maintains a positive effect
in some cases.
6
Policy Conclusions
In the present paper, the final aim has been essentially to investigate the
effective-ness of competition policy in developed and developing countries from an empirical
standpoint. It has shown that four competition indicators, originally built to explain
differences in productivity, once controlled with the proper economic and
institu-tional variables, seem to have an effect on five market indicators. Although not
particularly strong, the presence of a competition authority appears rather useful in
increasing the degree of competition of a country.
In particular, two are the main results that come to light. Firstly, as a general trend, apart from the mere adoption of a competition legislation by the national
parliaments, all the institutional indicators exercise a positive impact on the
mar-kets, therefore competition authorities seem to be effective in enhancing the level of
competitiveness of the respective countries. Secondly, as for the poorer countries,
with respect to which we are interested in verifying whether the enforcement of a
competition policy regime should be favored, what seems most important for its
effectiveness is above all to guarantee the factual independence of the authorities
predisposed. The essential reason for this should be found in the fact that the
qual-ity of the institutions of the developing countries is certainly lower than the one of the industrialized nations, being affected more frequently for example by cases of
corruption or government interference. In any case, one conclusion seems certain,
that is competition policy is not harmful to development.
However, as above-mentioned, it should be also taken into consideration that the
emerging countries, historically characterized by the nationalization of basic
indus-tries, are still adopting or constructing primordial competition policy frameworks,
results of which could be seen only in delay, so in the near future. Actually, to be
more precise, 81 of the 111 of the existing competition authorities worldwide have been created only in the last twenty years. Moreover, private enforcement, although
still in an embryonic phase even in the developed countries, could undoubtedly make
Table 1 -OLS Estimation of Performance Indicators on Competition Policy Indicators without/with Control Variables (Developed and Developing Countries)
Variables P ERF P ERF P ERF P ERF P ERF P ERF P ERF P ERF P ERF P ERF
local local dominance dominance antitrust antitrust competiton competiton ef f iciency ef f iciency
Technique OLS OLS OLS OLS OLS OLS OLS OLS OLS OLS
COM Plaw 1.331∗∗∗ 0.431 1.594∗∗∗ 0.245 1.785∗∗∗ 0.457 0.858∗∗ 0.066 1.123∗∗∗ 0.234 (0.316) (0.330) (0.454) (0.404) (0.448) (0.427) (0.299) (0.263) (0.309) (0.273)
R2 0.189 0.458 0.140 0.622 0.173 0.585 0.098 0.589 0.148 0.608
SER 0.675 0.550 0.968 0.671 0.955 0.711 0.638 0.438 0.659 0.455
N 78 69 78 69 78 69 78 69 78 69
COM Peconomics 1.068∗∗∗ 0.604∗ 1.483∗∗∗ 0.825∗ 1.725∗∗∗ 1.176∗∗∗ 0.820∗∗∗ 0.536∗ 0.988∗∗∗ 0.657∗∗ (0.235) (0.287) (0.321) (0.331) (0.299) (0.322) (0.217) (0.210) (0.225) (0.218)
R2 0.228 0.492 0.233 0.671 0.322 0.685 0.170 0.666 0.216 0.686
SER 0.677 0.549 0.925 0.634 0.862 0.617 0.625 0.403 0.647 0.418
N 72 63 72 63 72 63 72 63 72 63
COM Pdejure 1.452∗∗∗ 1.017∗∗ 1.907∗∗∗ 1.264∗∗ 2.334∗∗∗ 1.806∗∗∗ 1.092∗∗∗ 0.856∗∗∗ 1.324∗∗∗ 1.009∗∗∗ (0.309) (0.314) (0.434) (0.375) (0.400) (0.360) (0.289) (0.240) (0.298) (0.244)
R2 0.234 0.526 0.212 0.679 0.321 0.702 0.166 0.667 0.215 0.697
SER 0.665 0.521 0.932 0.622 0.860 0.597 0.620 0.626 0.640 0.405
N 74 65 74 65 74 65 74 65 74 65
COM Pdef acto 1.163∗∗∗ 0.848∗∗∗ 1.568∗∗∗ 0.960∗∗∗ 1.818∗∗∗ 1.376∗∗∗ 0.870∗∗∗ 0.614∗∗ 1.060∗∗∗ 0.764∗∗∗ (0.206) (0.226) (0.288) (0.272) (0.259) (0.267) (0.200) (0.182) (0.203) (0.181)
R2 0.329 0.574 0.313 0.698 0.431 0.706 0.225 0.665 0.295 0.708
SER 0.629 0.512 0.880 0.615 0.791 0.604 0.612 0.413 0.620 0.411
N 67 59 67 59 67 59 67 59 67 59
∗
p<0.05,∗∗
p<0.01,∗∗∗
p<0.001 (standard errors in parentheses)
Control Variables: Government Consumption, Openness, Inflation, Patents, OECD, EU.
Table 2 -OLS Estimation of Performance Indicators on Competition Policy Indicators without/with Control Variables (Developing Countries)
Variables P ERF P ERF P ERF P ERF P ERF P ERF P ERF P ERF P ERF P ERF
local local dominance dominance antitrust antitrust competiton competiton ef f iciency ef f iciency
Technique OLS OLS OLS OLS OLS OLS OLS OLS OLS OLS
COM Plaw 0.538 0.389 0.006 0.074 0.273 0.341 -0.168 -0.236 0.174 0.120
(0.390) (0.416) (0.464) (0.489) (0.453) (0.516) (0.341) (0.314) (0.352) (0.334)
R2 0.038 0.299 0.000 0.370 0.008 0.295 0.005 0.495 0.005 0.469
SER 0.641 0.573 0.762 0.673 0.745 0.711 0.561 0.433 0.579 0.461
N 50 42 50 42 50 42 50 42 50 42
COM Peconomics 0.321 0.382 0.320 0.758 0.677∗ 1.108∗∗ 0.094 0.405 0.279 0.583∗ (0.319) (0.392) (0.370) (0.422) (0.329) (0.384) (0.274) (0.259) (0.281) (0.274)
R2 0.024 0.329 0.018 0.477 0.092 0.510 0.003 0.619 0.023 0.610
SER 0.673 0.599 0.780 0.645 0.693 0.587 0.578 0.396 0.593 0.419
N 44 36 44 36 44 36 44 36 44 36
COM Pdejure 0.708 0.818 0.774 1.116 1.236∗∗ 1.664 0.347 0.649 0.580 0.839∗∗
(0.357) (0.384) (0.418) (0.429) (0.376) (0.396) (0.315) (0.278) (0.319) (0.285)
R2 0.082 0.378 0.072 0.488 0.197 0.547 0.027 0.583 0.070 0.597
SER 0.645 0.564 0.755 0.630 0.678 0.582 0.569 0.409 0.576 0.418
N 46 38 46 38 46 38 46 38 46 38
COM Pdef acto 0.601∗ 0.641∗ 0.648 0.843∗ 1.076∗∗∗ 1.362∗∗∗ 0.277 0.483∗ 0.474 0.664∗∗ (0.274) (0.298) (0.337) (0.355) (0.294) (0.318) (0.257) (0.228) (0.257) (0.228)
R2 0.110 0.427 0.087 0.497 0.256 0.584 0.029 0.598 0.080 0.629
SER 0.632 0.556 0.777 0.660 0.678 0.592 0.591 0.425 0.593 0.424
N 41 34 41 34 41 34 41 34 41 34
∗
p<0.05,∗∗
p<0.01,∗∗∗
p<0.001 (standard errors in parentheses)
Table 3 -2SLS and GMM Estimation of Performance Indicators on Competition Policy Indicators with Control and Instrumental Variables (Developed and Developing Countries)
Variables P ERF P ERF P ERF P ERF P ERF P ERF P ERF P ERF P ERF P ERF
local local dominance dominance antitrust antitrust competition competition ef f iciency ef f iciency
Technique 2SLS GMM 2SLS GMM 2SLS GMM 2SLS GMM 2SLS GMM
COM Plaw 1.319 1.411 1.770 2.033 1.448 1.285 0.293 -0.065 0.980 0.806
(0.949) (0.816) (1.218) (1.065) (1.211) (0.796) (0.720) (0.495) (0.787) (0.523)
R2 0.394 0.377 0.534 0.499 0.549 0.545 0.583 0.580 0.561 0.574
SER 0.546 0.554 0.701 0.727 0.697 0.700 0.414 0.416 0.453 0.446
N 69 69 69 69 69 69 69 69 69 69
COM Peconomics 2.265 2.434∗∗ 2.857 2.732∗ 3.734∗ 4.053∗ 1.486 1.778∗ 2.105 2.398∗∗
(1.407) (0.887) (1.660) (1.107) (1.824) (1.730) (0.952) (0.843) (1.132) (0.875)
R2 0.183 0.116 0.4460 0.472 0.3241 0.227 0.543 0.451 0.436 0.323
SER 0.651 0.677 0.76881 0.751 0.84442 0.903 0.441 0.483 0.524 0.574
N 63 63 63 63 63 63 63 63 63 63
COM Pdejure 2.335∗ 2.445 2.678∗ 2.636 4.689∗∗ 4.710 2.289∗ 2.404 2.586∗∗ 2.511
(1.111) (0.825) (1.295) (0.975) (1.622) (1.480) (0.945) (0.878) (0.994) (0.765)
R2 0.380 0.354 0.599 0.603 0.367 0.361 0.458 0.495 0.475 0.495
SER 0.558 0.570 0.651 0.648 0.815 0.818 0.475 0.490 0.500 0.490
N 65 65 65 65 65 65 65 65 65 65
COM Pdef acto 1.880∗ 1.999∗∗∗ 1.845∗ 1.823∗∗ 3.069∗∗ 3.292∗∗ 1.485∗ 1.747∗ 1.813∗ 1.994∗∗ (0.825) (0.567) (0.919) (0.660) (1.098) (1.206) (0.675) (0.751) (0.718) (0.702)
R2 0.400 0.357 0.635 0.636 0.473 0.406 0.515 0.410 0.517 0.444
SER 0.565 0.585 0.629 0.628 0.751 0.798 0.462 0.510 0.492 0.528
N 59 59 59 59 59 59 59 59 59 59
∗
p<0.05,∗∗p<0.01,∗∗∗p<0.001 (standard errors in parentheses)
Control Variables: Government Consumption, Openness, Inflation, Patents, OECD, EU.
Instrumental Variables: British Colony, Age of Democratic Regime, Ethnic-Linguistic Fractionalization.
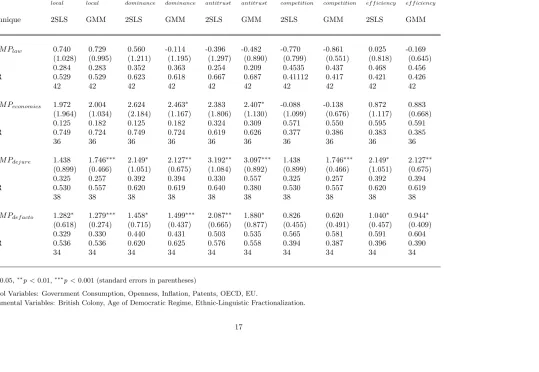
Table 4 -2SLS and GMM Estimation of Performance Indicators on Competition Policy Indicators with Control and Instrumental Variables (Developing Countries)
Variables P ERF P ERF P ERF P ERF P ERF P ERF P ERF P ERF P ERF P ERF
local local dominance dominance antitrust antitrust competition competition ef f iciency ef f iciency
Technique 2SLS GMM 2SLS GMM 2SLS GMM 2SLS GMM 2SLS GMM
COM Plaw 0.740 0.729 0.560 -0.114 -0.396 -0.482 -0.770 -0.861 0.025 -0.169
(1.028) (0.995) (1.211) (1.195) (1.297) (0.890) (0.799) (0.551) (0.818) (0.645)
R2 0.284 0.283 0.352 0.363 0.254 0.209 0.4535 0.437 0.468 0.456
SER 0.529 0.529 0.623 0.618 0.667 0.687 0.41112 0.417 0.421 0.426
N 42 42 42 42 42 42 42 42 42 42
COM Peconomics 1.972 2.004 2.624 2.463∗ 2.383 2.407∗ -0.088 -0.138 0.872 0.883
(1.964) (1.034) (2.184) (1.167) (1.806) (1.130) (1.099) (0.676) (1.117) (0.668)
R2 0.125 0.182 0.125 0.182 0.324 0.309 0.571 0.550 0.595 0.591
SER 0.749 0.724 0.749 0.724 0.619 0.626 0.377 0.386 0.383 0.385
N 36 36 36 36 36 36 36 36 36 36
COM Pdejure 1.438 1.746∗∗∗ 2.149∗ 2.127∗∗ 3.192∗∗ 3.097∗∗∗ 1.438 1.746∗∗∗ 2.149∗ 2.127∗∗
(0.899) (0.466) (1.051) (0.675) (1.084) (0.892) (0.899) (0.466) (1.051) (0.675)
R2 0.325 0.257 0.392 0.394 0.330 0.557 0.325 0.257 0.392 0.394
SER 0.530 0.557 0.620 0.619 0.640 0.380 0.530 0.557 0.620 0.619
N 38 38 38 38 38 38 38 38 38 38
COM Pdef acto 1.282∗ 1.279∗∗∗ 1.458∗ 1.499∗∗∗ 2.087∗∗ 1.880∗ 0.826 0.620 1.040∗ 0.944∗
(0.618) (0.274) (0.715) (0.437) (0.665) (0.877) (0.455) (0.491) (0.457) (0.409)
R2 0.329 0.330 0.440 0.431 0.503 0.535 0.565 0.581 0.591 0.604
SER 0.536 0.536 0.620 0.625 0.576 0.558 0.394 0.387 0.396 0.390
N 34 34 34 34 34 34 34 34 34 34
∗
p<0.05,∗∗p<0.01,∗∗∗p<0.001 (standard errors in parentheses)
Control Variables: Government Consumption, Openness, Inflation, Patents, OECD, EU.
References
[1] Alesina, A. et al. (2003), Fractionalization, Journal of Economic Growth, Vol-ume 8, Issue 2, pp. 155-194.
[2] Aten, B., Heston, A., Summers, R. (2002),Penn World Table, Center for Inter-national Comparisons at the University of Pennsylvania, Philadelphia, United States, available on the web-site pwt.sas.upenn.edu.
[3] Beck, T., Clarke, G., Groff, A., Keefer, P., Walsh, P. (2001), New Tools in Comparative Political Economy: The Database of Political Institutions, World Bank Economic Review, The World Bank, Washington D.C., United States, pp. 165-176, available (updated to 2013) on the web-site www.worldbank.org.
[4] Buccirossi, P., Ciari, L., Duso, T., Spagnolo, G., Vitale, C. (2013), Competi-tion Policy and Productivity Growth: An Empirical Essessment, The Review of Economics and Statistics, Vol. 95(4), MIT Press, Cambridge, United States, pp. 1324-1336.
[5] Kee, H.L., Hoekman, B. (2007),Imports, Entry and Competition Law as Market Disciplines, European Economic Review, Volume 51, Issue 4, Elsevier, Philidel-phia, United States, pp. 831-858.
[6] Krakowski, M. (2005), Competition Policy Works: The Effect of Competition Policy on the Intensity of Competition. An International Cross-Country Com-parison, Hamburg Institute of International Economics, Discussion Paper No. 332, Hamburg, Germany, pp. 1-18.
[7] Papadopoulos, A.S. (2010), The International Dimension of EU Competition Law and Policy, Cambridge University Press, Cambridge, United Kindom, pp. 1-362.
[8] Petersen, N. (2013), Antitrust Law and the Promotion of Democracy and Eco-nomic Growth, Journal of Competition Law & EcoEco-nomics, Vol. 9, Oxford Uni-versity Press, Oxford, United Kingdom, pp. 593-636.
[10] Voigt, S. (2009), The Effects of Competition Policy on Development. Cross-Country Evidence Using Four New Indicators, The Journal of Development Studies, Volume 45, Issue 8, Routledge, London, United Kindom, pp. 1225-1248.
Appendix A - Descriptive Data
Figure A.1 -Global Competitiveness Index Heat Map
Source: World Economic Forum (2013)
Figure A.2 -Global Competitiveness Index
Source: World Economic Forum (2013)
Table A.1.1 -Competition Policy Indicators: Developed Countries (Independent Variables)
Country COM Px1 x2 x3 x4
law COM Peconomics COM Pdejure COM Pdef acto
Australia 0.620 0.389 0.592 0.872
Austria 0.322 0.595 0.523 n.a.
Belgium 0.288 0.750 0.331 0.800
Canada 0.474 0.667 0.554 0.798
Czech Republic 0.371 0.917 0.477 0.922
Denmark 0.404 0.903 0.508 0.944
Estonia 0.365 0.233 0.650 0.500
Finland 0.343 0.905 0.650 0.969
France 0.313 0.740 0.564 0.663
Germany 0.471 0.700 0.625 0.967
Greece 0.287 0.583 0.550 0.421
Hungary 0.499 0.972 0.630 0.802
Ireland 0.371 0.639 0.585 0.893
Israel 0.173 0.850 0.500 0.953
Italy 0.708 0.611 0.644 0.911
Japan 0.375 0.821 0.517 0.917
Mexico 0.324 0.476 0.442 0.722
Netherlands 0.474 0.722 0.417 1.000
New Zealand 0.454 0.319 0.485 0.550
Poland 0.249 0.816 0.425 0.781
Portugal 0.561 0.716 0.438 n.a.
Slovakia 0.663 0.840 0.525 0.678
Spain 0.453 0.774 0.692 0.933
Sweden 0.564 0.792 0.454 0.656
Switzerland 0.664 0.833 0.446 0.939
Turkey 0.696 0.357 0.618 0.922
United Kingdom 0.750 0.833 0.577 0.875
United States 0.667 0.611 0.459 0.372
Source: Voigt (2009)
Indicators
x1= Substantive Content of the Competition Law
x2= Degree to which the Competition Law incorporates an Economic Approach
x3= Formal Independence of the Competition Authority
x4= Factual Independence of the Competition Authority
Table A.1.2 -Competition Policy Indicators: Developing Countries (Independent Variables)
Country COM Px1 x2 x3 x4
law COM Peconomics COM Pdejure COM Pdef acto
Albania 0.318 0.792 0.410 n.a.
Argentina 0.612 0.667 0.362 0.450
Armenia 0.595 0.188 0.500 0.230
Bangladesh 0.000 0.000 0.000 0.000
Benin 0.000 0.000 0.000 0.000
Bolivia 0.000 0.000 0.000 0.000
Brazil 0.664 0.500 0.581 0.903
Bulgaria 0.559 0.583 0.400 0.694
Chad 0.000 0.000 0.000 0.000
China 0.115 0.375 0.238 n.a.
Colombia 0.618 0.762 0.692 0.642
Costa Rica 0.360 0.472 0.542 0.814
Croatia 0.526 0.694 0.400 0.594
Cyprus 0.086 0.731 0.350 0.819
Dominican Republic 0.333 n.a. n.a. n.a.
Ecuador 0.000 0.000 0.000 0.000
Egypt 0.000 0.000 0.000 0.000
El Salvador 0.333 n.a. n.a. n.a.
Guatemala 0.333 n.a. n.a. n.a.
Guyana 0.000 0.000 0.000 0.000
Honduras 0.000 0.000 0.000 0.000
Indonesia 0.181 0.786 0.548 0.708
Jamaica 0.240 0.143 0.607 0.772
Kazakhstan 0.080 0.000 0.417 0.775
Latvia 0.243 0.786 0.577 0.636
Lithuania 0.702 0.750 0.625 0.781
Madagascar 0.000 0.000 0.000 0.000
Malaysia 0.000 0.000 0.000 0.000
Mali 0.000 0.000 0.000 0.000
Mauritania 0.000 0.000 0.000 0.000
Moldova 0.333 n.a. n.a. n.a.
Morocco 0.012 0.810 0.558 0.396
Mozambique 0.000 0.000 0.000 0.000
Nepal 0.000 0.000 0.000 0.000
Nicaragua 0.000 0.000 0.000 0.000
Nigeria 0.000 0.000 0.000 0.000
Paraguay 0.333 n.a. n.a. n.a.
Peru 0.621 0.643 0.446 0.572
Phillipines 0.550 n.a. 0.000 n.a.
Senegal 0.154 0.063 0.636 n.a.
Singapore 0.000 0.000 0.000 0.000
South Africa 0.073 n.a. 0.769 0.813
Taiwan 0.288 0.250 0.511 0.683
Tajikistan 0.000 0.000 0.000 0.000
Tanzania 0.238 0.476 0.624 0.867
Thailand 0.323 0.214 0.417 n.a.
Uganda 0.000 0.000 0.000 0.000
Venezuela 0.577 0.484 0.500 0.638
Vietnam 0.000 0.000 0.000 0.000
Zambia 0.154 0.722 0.460 0.822
Zimbawe 0.023 0.595 0.457 0.714
Table A.2.1 -Performance Indicators: Developed Countries (Dependent Variables)
Country P ERFy1 y2 y3 y4 y5
local P ERFdominace P ERFantitrust P ERFcompetition P ERFef f iciency
Australia 5.733 5.148 5.916 5.289 5.321
Austria 6.058 5.906 5.752 5.215 5.407
Belgium 5.966 5.399 5.518 5.032 5.201
Canada 5.671 5.174 5.464 5.161 5.259
Czech Republic 5.727 4.430 4.637 4.727 4.652
Denmark 5.566 5.777 5.940 5.358 5.431
Estonia 5.571 4.331 4.866 5.060 4.950
Finland 5.730 5.740 6.048 5.253 5.354
France 5.800 5.354 5.693 4.885 5.032
Germany 6.315 6.207 6.123 5.167 5.291
Greece 4.929 4.040 4.425 4.149 4.244
Hungary 5.425 3.769 4.534 4.509 4.258
Ireland 5.475 5.330 5.191 5.422 5.414
Israel 5.641 4.124 5.429 4.960 5.001
Italy 4.623 4.383 4.162 4.130 4.321
Japan 6.025 5.948 5.398 4.891 5.218
Mexico 4.905 3.301 3.623 4.152 4.230
Netherlands 5.883 5.792 5.986 5.329 5.368
New Zealand 5.402 4.675 5.633 5.366 5.354
Poland 4.725 4.183 3.957 4.215 4.123
Portugal 5.275 3.882 5.011 4.642 4.589
Slovakia 5.346 4.793 4.565 4.958 4.658
Spain 5.567 4.590 4.619 4.465 4.591
Sweden 6.016 5.234 5.824 5.223 5.370
Switzerland 5.527 5.948 5.321 5.167 5.389
Turkey 5.455 4.427 4.642 4.566 4.538
United Kingdom 5.985 5.680 5.820 5.281 5.295
United States 5.904 5.694 5.498 5.226 5.317
Source: World Economic Forum (2013)
Indicators
y1= Intensity of Local Competition
(“How would you assess the intensity of competition in the local markets in your country?”) [1 = limited in most industries; 7 = intense in most industries]
y2= Extent of Market Dominance
(“How would you characterize corporate activity in your country?”) [1 = dominated by a few business groups; 7 = spread among many firms]
y3= Effectiveness of Anti-Monopoly Policy
(“To what extent does anti-monopoly policy promote competition in your country?”) [1 = does not promote competition; 7 = effectively promotes competition]
Aggregate Indicators
y4= Competition [1 = min; 7 = max]
Table A.2.2 -Performance Indicators: Developing Countries (Dependent Variables)
Country P ERFy1 y2 y3 y4 y5
local P ERFdominace P ERFantitrust P ERFef f iciency P ERFef f iciency
Albania 3.665 2.866 2.833 3.536 3.506
Argentina 4.156 3.248 3.336 3.326 3.528
Armenia 3.634 2.475 2.518 3.770 3.713
Bangladesh 4.736 2.755 2.820 3.906 3.838
Benin 4.328 3.779 3.743 3.906 3.760
Bolivia 4.091 3.133 2.875 3.431 3.260
Brazil 5.252 4.157 4.273 3.572 3.803
Bulgaria 4.497 3.689 3.248 3.910 3.891
Chad 3.215 2.960 2.831 3.022 2.843
China 5.338 3.761 3.688 4.205 4.258
Colombia 4.936 3.142 3.927 3.727 3.927
Costa Rica 5.104 4.493 3.941 4.214 4.397
Croatia 4.974 3.553 3.730 4.126 4.103
Cyprus 5.371 4.201 4.837 4.611 4.653
Dominican Republic 4.355 2.918 2.888 3.610 3.736
Ecuador 4.246 2.547 2.616 3.456 3.349
Egypt 4.712 3.934 3.507 4.150 4.031
El Salvador 4.894 3.103 3.477 4.342 4.320
Guatemala 5.007 3.690 3.287 4.251 4.228
Guyana 4.245 2.920 3.019 3.904 3.717
Honduras 4.182 3.033 3.418 3.981 3.905
Indonesia 5.510 5.228 5.147 4.884 5.058
Jamaica 5.140 3.776 5.398 4.370 4.291
Kazakhstan 4.666 3.441 3.505 4.088 4.200
Latvia 4.976 3.766 3.954 4.534 4.472
Lithuania 5.365 3.842 4.354 4.475 4.518
Madagascar 4.142 2.998 3.294 3.922 3.713
Malaysia 5.665 5.106 4.911 5.171 5.201
Mali 4.374 4.044 3.474 4.051 3.819
Mauritania 3.688 2.874 3.408 3.440 3.418
Moldova n.a. n.a. n.a. n.a. n.a.
Morocco 4.575 3.733 4.129 4.175 4.131
Mozambique 3.610 2.778 2.964 3.441 3.221
Nepal 4.585 2.499 3.059 3.870 3.730
Nicaragua 4.013 2.514 2.851 3.771 3.613
Nigeria 4.486 3.919 3.690 4.258 4.189
Paraguay 4.118 3.026 2.735 3.594 3.514
Peru 5.091 3.397 3.783 4.079 4.136
Phillipines 5.019 3.023 3.575 4.037 4.191
Senegal 5.128 3.950 3.154 4.026 3.982
Singapore 5.482 5.225 5.076 5.931 5.762
South Africa 5.091 4.418 5.388 4.800 4.732
Taiwan 5.797 5.605 5.033 5.059 5.230
Tajikistan 4.014 3.091 3.347 3.400 3.472
Tanzania 4.486 3.245 3.812 4.056 3.922
Thailand 5.296 4.077 4.054 4.605 4.663
Uganda 4.725 2.916 3.326 3.802 3.665
Venezuela 3.693 3.072 3.566 3.056 3.276
Vietnam 4.982 4.314 3.161 4.073 4.070
Zambia 3.425 2.606 3.170 4.023 3.609
Zimbawe 3.419 3.273 3.371 3.090 3.152
Table A.3.1 -Socio-Economic Variables: Developed Countries (Control Variables)
Country
z1 z2 z3 z4 z5 z6
CT RL CT RL CT RL CT RL CT RL CT RL
govtcons1 openness1 inf lation1 patents2 OECD EU
Australia 7.23 36.85 -7.10 2,253 1 0
Austria 6.17 79.28 -5.34 1,676 1 1
Belgium 18.15 134.61 -5.28 2,102 1 1
Canada 14.80 70.53 -6.17 10,667 1 0
Czech Republic 11.86 104.66 11.19 21 0 1
Denmark 7.32 67.18 -5.20 1,177 1 1
Estonia 32.58 132.03 24.89 3 0 1
Finland 7.40 64.57 -9.48 1,859 1 1
France 8.32 44.45 -5.91 14,255 1 1
Germany 7.39 51.22 -5.78 34,050 1 1
Greece 10.47 44.22 -3.78 60 0 1
Hungary 14.48 84.25 2.30 225 0 1
Ireland 5.33 138.87 -2.98 304 1 1
Israel 27.38 75.31 -0.59 2,066 0 0
Italy 6.58 45.88 -7.40 6,017 1 1
Japan 5.91 17.95 2.69 112,673 1 0
Mexico 7.56 58.07 5.10 213 0 0
Netherlands 9.93 107.21 -5.08 4,056 1 1
New Zealand 8.30 55.02 -7.46 257 1 0
Poland 8.08 46.73 14.43 60 0 1
Portugal 17.92 64.36 -2.60 22 1 1
Slovakia 17.41 117.72 0.27 4 0 1
Spain 6.82 44.97 -7.68 681 1 1
Sweden 13.37 70.82 -7.28 n.a. 1 1
Switzerland 10.22 68.51 -5.33 5,557 1 0
Turkey 14.66 46.34 -6.80 12 0 0
United Kingdom 7.66 57.80 -1.95 12,138 1 1 United States 12.01 23.01 0.00 287,848 1 0
Source: Hestonet al. (2002)(1), US Department of Commerce (2005)(2)
z1= Government Consumption
(“Government share of Real Gross Domestic Price Level between 1990 and 2000”)
z2= Openness
(“Exports plus imports divided by Real Gross Domestic Price Level between 1990 and 2000”)
z3= Inflation
[Rate of inflation between 1990 and 2000 with United States = 0]
z4= Patents
(“Number of patents for invention for country of origin granted by the US Department of Commerce between 1993 and 1997”)
z5= OECD
(“Did the country belong to the Organisation for Economic Co-operation and Development in 2008?”) [0 = no; 1 = yes]
z6= EU
Table A.3.2 -Socio-Economic Variables: Developing Countries (Control Variables)
Country
z1 z2 z3 z4 z5 z6
CT RL CT RL CT RL CT RL CT RL CT RL
govtcons1 openness1 inf lation1 patents2 OECD EU
Albania 23.99 45.20 13.51 0 0 0
Argentina 14.50 20.29 -1.60 152 0 0
Armenia 33.64 113.53 61.83 1 0 0
Bangladesh 10.54 25.73 -5.94 0 0 0
Benin 12.15 63.83 -10.98 n.a. 0 0
Bolivia 18.21 47.91 0.28 1 0 0
Brazil 24.69 15.03 -5.91 305 0 0
Bulgaria 34.69 105.93 22.87 16 0 0
Chad 25.23 48.94 -15.36 0 0 0
China 25.28 38.75 -0.51 271 0 0
Colombia 19.57 30.28 1.69 n.a. 0 0
Costa Rica 21.18 89.76 11.81 14 0 0
Croatia 34.87 90.68 -6.64 23 0 0
Cyprus 22.30 99.01 0.96 9 0 1
Dominican Republic 19.76 66.05 0.81 2 0 0
Ecuador 21.16 51.34 -1.89 3 0 0
Egypt 10.11 45.96 -6.13 12 0 0
El Salvador 16.68 54.88 7.03 2 0 0
Guatemala 14.11 42.35 8.93 7 0 0
Guyana 32.56 203.64 -5.69 0 0 0
Honduras 16.74 96.77 6.77 2 0 0
Indonesia 19.02 48.54 -10.74 23 0 0
Jamaica 24.70 113.31 11.33 3 0 0
Kazakhstan 22.95 67.86 6.75 2 0 0
Latvia 26.98 98.92 132.99 0 0 1
Lithuania 27.87 117.23 49.87 3 0 1
Madagascar 13.28 46.46 -5.39 0 0 0
Malaysia 18.66 162.34 -1.48 59 0 0
Mali 20.87 57.25 -17.75 0 0 0
Mauritania 27.73 96.50 -15.66 0 0 0
Moldova 33.79 113.06 -2.08 0 0 0
Morocco 16.78 49.01 -7.73 4 0 0
Mozambique 28.03 52.17 -2.57 n.a. 0 0
Nepal 23.17 50.36 -9.67 n.a. 0 0
Nicaragua 32.60 103.89 16.05 1 0 0
Nigeria 13.22 70.06 3.83 3 0 0
Paraguay 19.59 84.81 -0.45 0 0 0
Peru 12.92 26.60 -5.00 10 0 0
Phillipines 16.79 75.06 -2.68 17 0 0
Senegal 17.27 76.85 -17.68 0 0 0
Singapore 7.41 313.93 0.05 324 0 0
South Africa 25.87 43.15 -6.13 529 0 0
Taiwan 14.45 91.05 -3.84 8206 0 0
Tajikistan 21.96 144.37 -15.94 n.a. 0 0
Tanzania 23.08 49.44 13.46 0 0 0
Thailand 14.12 83.72 -6.01 34 0 0
Uganda 27.38 32.11 -7.90 3 0 0
Venezuela 15.40 58.22 15.62 133 0 0
Vietnam 18.52 74.50 25.23 0 0 0
Zambia 24.55 76.12 -6.32 0 0 0
Zimbawe 18.73 73.62 -14.25 6 0 0
Table A.4.1 -Socio-Economic Variables: Developed Countries (Instrumental Variables)
Country iv1 iv2 iv3
britishcolony1 agedemregime2 ethnic
−linguistic3
Australia 1 111 0.093
Austria 0 79 0.107
Belgium 0 154 0.555
Canada 1 145 0.712
Czech Republic 0 46 0.322
Denmark 0 93 0.082
Estonia 0 36 0.506
Finland 0 95 0.132
France 0 119 0.103
Germany 0 63 0.168
Greece 0 122 0.158
Hungary 0 22 0.152
Ireland 1 91 0.121
Israel 1 64 0.344
Italy 0 64 0.115
Japan 0 60 0.012
Mexico 0 12 0.542
Netherlands 0 91 0.105
New Zealand 1 155 0.397
Poland 0 30 0.118
Portugal 0 52 0.047
Slovakia 0 19 0.254
Spain 0 44 0.417
Sweden 0 95 0.060
Switzerland 0 164 0.531
Turkey 0 55 0.320
United Kingdom 1 132 0.121
United States 1 212 0.490
Source: Hestonet al. (2002)(1), Keeferet al. (2013)(2), Alesinaet al. (2003)(3)
Indicators
iv1 = British Colony
(“Was the country a British colony?”) [0 = no; 1 = yes]
iv2 = Age of Democratic Regime
(“Number of consecutive years a democratic regime has been established in the country”)
iv3 = Ethnic-Linguistic Fractionalization
Table A.4.2 -Socio-Economic Variables: Developing Countries (Instrumental Variables)
Country iv1 iv2 iv3
britishcolony1 agedemregime2 ethnic
−linguistic3
Albania 0 10 0.220
Argentina 0 29 0.339
Armenia 0 4 0.127
Bangladesh 1 0 0.045
Benin 0 154 0.787
Bolivia 0 30 0.740
Brazil 0 28 0.541
Bulgaria 0 22 0.402
Chad 0 0 0.862
China 0 0 0.154
Colombia 0 75 0.601
Costa Rica 0 183 0.237
Croatia 0 12 0.369
Cyprus 1 48 0.094
Dominican Republic 0 17 0.429
Ecuador 0 22 0.655
Egypt 0 6 0.184
El Salvador 0 21 0.198 Guatemala 0 16 0.512
Guyana 1 0 0.620
Honduras 0 13 0.187
Indonesia 0 13 0.735
Jamaica 1 53 0.413
Kazakhstan 0 0 0.617
Latvia 0 36 0.587
Lithuania 0 29 0.322 Madagascar 0 17 0.879
Malaysia 1 12 0.588
Mali 0 14 0.691
Mauritania 0 0 0.615
Moldova 0 19 0.554
Morocco 0 0 0.484
Mozambique 0 0 0.693
Nepal 1 6 0.663
Nicaragua 0 17 0.484
Nigeria 1 11 0.851
Paraguay 0 20 0.169
Peru 0 24 0.657
Phillipines 0 25 0.239
Senegal 0 12 0.694
Singapore 1 4 0.386
South Africa 1 101 0.752
Taiwan 0 20 0.274
Tajikistan 0 0 0.511
Tanzania 1 0 0.735
Thailand 1 16 0.634
Uganda 1 4 0.930
Venezuela 0 43 0.497
Vietnam 0 0 0.238
Zambia 1 5 0.781
Zimbawe 1 9 0.387
Appendix B - Descriptive Statistics
Table B.1.1 -Competition Policy Indicators: Developed Countries
Independent Variable Observations Mean Standard Deviation Min Max
x1 -COM Plaw 28 0.461 0.157 0.173 0.750
x2 -COM Peconomics 28 0.692 0.192 0.233 0.972
x3 -COM Pdejure 28 0.531 0.088 0.331 0.692
x4 -COM Pdef acto 28 0.798 0.178 0.372 1
Table B.1.2 -Competition Policy Indicators: Developing Countries
Independent Variable Observations Mean Standard Deviation Min Max
x1 -COM Plaw 51 0.207 0.233 0 0.702
x2 -COM Peconomics 44 0.284 0.322 0 0.810
x3 -COM Pdejure 46 0.275 0.269 0 0.769
x4 -COM Pdef acto 41 0.349 0.365 0 0.902
Table B.2.1 -Performance Indicators: Developed Countries
Dependent Variable Observations Mean Standard Deviation Min Max
y1 -P ERFlocal 28 5.580 0.411 4.623 6.315
y2 -P ERFdominance 28 4.974 0.795 3.301 6.207
y3 -P ERFantitrust 28 5.200 0.688 3.623 6.123
y4 -P ERFcomp 28 4.921 0.413 4.130 5.422
y5 -P ERFef f iciency 28 4.971 0.449 4.123 5.431
Table B.2.2 -Performance Indicators: Developing Countries
Dependent Variable Observations Mean Standard Deviation Min Max
y1 -P ERFlocal 50 4.590 0.647 3.215 5.797
y2 -P ERFdominance 50 3.522 0.754 2.474 5.605
y3 -P ERFantitrust 50 3.630 0.740 2.518 5.398
y4 -P ERFcomp 50 4.021 0.556 3.022 5.931
y5 -P ERFef f iciency 50 3.994 0.574 2.843 5.762
Table B.3.1 -Socio-Economic Variables: Developed Countries
Control Variable Observations Mean Standard Deviation Min Max
z1-CT RLgovtcons 28 11.618 6.472 5.330 32.579
z2-CT RLopenness 28 69.729 32.506 17.953 138.871
z3-CT RLinf lation 28 -1.725 7.686 -9.477 24.889
z4-CT RLpatents 27 18,528 58,182 3 287,848
z5-CT RLOECD 27 0.667 0.4804 0 1
Table B.3.2 -Socio-Economic Variables: Developing Countries
Control Variable Observations Mean Standard Deviation Min Max
z1-CT RLgovtcons 51 21.170 6.812 7.414 34.868
z2-CT RLopenness 51 77.379 49.859 15.029 313.927
z3-CT RLinf lation 51 3.760 23.757 -17.753 132.993
z4-CT RLpatents 46 221.304 1208.163 0 8206
z5-CT RLOECD 47 0 0 0 0
z6-CT RLEU 50 0.06 0.240 0 1
Table B.4.1 -Socio-Economic Variables: Developed Countries
Instrumental Variable Observations Mean Standard Deviation Min Max
iv1 -I Vbritishcolony 28 0.25 0.441 0 1
iv2 -I Vagedemregime 28 86.61 50.04 12 212
iv3 -I Vethnic−linguistic 28 0.253 0.194 0.012 0.712
Table B.4.2 -Socio-Economic Variables: Developing Countries
Instrumental Variable Observations Mean Standard Deviation Min Max
iv1 -I Vbritishcolony 51 0.275 0.451 0 1
iv2 -I Vagedemregime 51 23.529 35.492 0 183
Appendix C.1 - Estimation (Developing and Developed Countries)
Table C.1.1.1 -OLS Estimation of Performance Indicators on Competition Policy Indicators without/with Control Variables (Substantive Content of the Competition Law as Independent Variable)
Variables P ERF P ERF P ERF P ERF P ERF P ERF P ERF P ERF P ERF P ERF
local local dominance dominance antitrust antitrust competiton competiton ef f iciency ef f iciency
Technique OLS OLS OLS OLS OLS OLS OLS OLS OLS OLS
COM Plaw 1.331∗∗∗ 0.431 1.594∗∗∗ 0.245 1.785∗∗∗ 0.457 0.858∗∗ 0.066 1.123∗∗∗ 0.234
(0.316) (0.330) (0.454) (0.404) (0.448) (0.427) (0.299) (0.263) (0.309) (0.273)
CT RLgovtcons -0.020 -0.033∗ -0.011 -0.021∗ -0.024∗
(0.011) (0.014) (0.014) (0.009) (0.009)
CT RLopenness 0.003 0.005∗∗ 0.004∗ 0.006∗∗∗ 0.006∗∗∗
(0.002) (0.002) (0.002) (0.001) (0.001)
CT RLinf lation -0.002 -0.003 -0.006 0.001 0.001
(0.004) (0.005) (0.005) (0.003) (0.003)
CT RLpatents 0.000 0.000 0.000 0.000 0.000
(0.000) (0.000) (0.000) (0.000) (0.000)
CT RLOECD 0.356 1.017∗∗∗ 1.139∗∗∗ 0.618∗∗ 0.721∗∗∗
(0.227) (0.278) (0.294) (0.181) (0.188)
CT RLEU 0.369 0.315 0.488∗ 0.133 0.068
(0.185) (0.226) (0.239) (0.147) (0.153)
costant 4.550∗∗∗ 4.791∗∗∗ 3.570∗∗∗ 3.854∗∗∗ 3.664∗∗∗ 3.540∗∗∗ 4.089∗∗∗ 4.070∗∗∗ 4.011∗∗∗ 4.094∗∗∗
(0.121) (0.266) (0.174) (0.324) (0.171) (0.344) (0.115) (0.212) (0.118) (0.220)
R2 0.189 0.458 0.140 0.622 0.173 0.585 0.098 0.589 0.148 0.608
SER 0.675 0.550 0.968 0.671 0.955 0.711 0.638 0.438 0.659 0.455
N 78 69 78 69 78 69 78 69 78 69
∗
Table C.1.1.2 -OLS Estimation of Performance Indicators on Competition Policy Indicators without/with Control Variables (Degree the Competition Law incorporates an Economic Approach as Independent Variable)
Variables P ERF P ERF P ERF P ERF P ERF P ERF P ERF P ERF P ERF P ERF
local local dominance dominance antitrust antitrust competiton competiton ef f iciency ef f iciency
Technique OLS OLS OLS OLS OLS OLS OLS OLS OLS OLS
COM Peconomics 1.068∗∗∗ 0.604∗ 1.483∗∗∗ 0.825∗ 1.725∗∗∗ 1.176∗∗∗ 0.820∗∗∗ 0.536∗ 0.988∗∗∗ 0.657∗∗
(0.235) (0.287) (0.321) (0.331) (0.299) (0.322) (0.217) (0.210) (0.225) (0.218)
CT RLgovtcons -0.020 -0.037∗∗ -0.016 -0.0223∗∗ -0.025∗∗
(0.011) (0.013) (0.013) (0.008) (0.009)
CT RLopenness 0.004∗ 0.006∗∗ 0.006∗∗ 0.007∗∗∗ 0.007∗∗∗
(0.002) (0.002) (0.002) (0.001) (0.001)
CT RLinf lation -0.002 -0.003 -0.005 0.000 0.001
(0.004) (0.004) (0.004) (0.003) (0.003)
CT RLpatents 0.000 0.000 0.000 0.000 0.000
(0.000) (0.000) (0.000) (0.000) (0.000)
CT RLOECD 0.368 0.913∗∗∗ 1.031∗∗∗ 0.554∗∗ 0.679∗∗∗
(0.222) (0.257) (0.250) (0.163) (0.169)
CT RLEU 0.171 -0.030 0.0220 -0.077 -0.172
(0.215) (0.248) (0.241) (0.158) (0.164)
costant 4.490∗∗∗ 4.656∗∗∗ 3.444∗∗∗ 3.701∗∗∗ 3.483∗∗∗ 3.322∗∗∗ 4.001∗∗∗ 3.881∗∗∗ 3.926∗∗∗ 3.900∗∗∗
(0.131) (0.281) (0.179) (0.324) (0.167) (0.315) (0.121) (0.206) (0.125) (0.214)
R2 0.228 0.492 0.233 0.671 0.322 0.685 0.170 0.666 0.216 0.686
SER 0.677 0.549 0.925 0.634 0.862 0.617 0.625 0.403 0.647 0.418
N 72 63 72 63 72 63 72 63 72 63
∗
p<0.05,∗∗p<0.01,∗∗∗p<0.001 (standard errors in parentheses)
Table C.1.1.3 -OLS Estimation of Performance Indicators on Competition Policy Indicators without/with Control Variables (Formal Independence of the Competition Authority as Independent Variable)
Variables P ERF P ERF P ERF P ERF P ERF P ERF P ERF P ERF P ERF P ERF
local local dominance dominance antitrust antitrust competiton competiton ef f iciency ef f iciency
Technique OLS OLS OLS OLS OLS OLS OLS OLS OLS OLS
COM Pdejure 1.452∗∗∗ 1.017∗∗ 1.907∗∗∗ 1.264∗∗ 2.334∗∗∗ 1.806∗∗∗ 1.092∗∗∗ 0.856∗∗∗ 1.324∗∗∗ 1.009∗∗∗
(0.309) (0.314) (0.434) (0.375) (0.400) (0.360) (0.289) (0.240) (0.298) (0.244)
CT RLgovtcons -0.021 -0.036∗∗ -0.015 -0.022∗ -0.025∗∗
(0.011) (0.013) (0.012) (0.008) (0.008)
CT RLopenness 0.004∗ 0.006∗∗∗ 0.006∗∗ 0.007∗∗∗ 0.007∗∗∗
(0.002) (0.002) (0.002) (0.001) (0.001)
CT RLinf lation -0.003 -0.005 -0.008 -0.001 -0.000
(0.004) (0.004) (0.004) (0.003) (0.003)
CT RLpatents 0.000 0.000∗ 0.000 0.000 0.000
(0.000) (0.000) (0.000) (0.000) (0.000)
CT RLOECD 0.297 0.862∗∗ 0.938∗∗∗ 0.509∗∗ 0.623∗∗∗
(0.212) (0.253) (0.243) (0.162) (0.165)
CT RLEU 0.218 0.078 0.159 -0.019 -0.098
(0.184) (0.219) (0.210) (0.140) (0.143)
costant 4.425∗∗∗ 4.549∗∗∗ 3.381∗∗∗ 3.543∗∗∗ 3.385∗∗∗ 3.131∗∗∗ 3.960∗∗∗ 3.778∗∗∗ 3.874∗∗∗ 3.801∗∗∗
(0.139) (0.265) (0.194) (0.316) (0.179) (0.303) (0.129) (0.202) (0.133) (0.206)
R2 0.234 0.526 0.212 0.679 0.321 0.702 0.166 0.667 0.215 0.697
SER 0.665 0.521 0.932 0.622 0.860 0.597 0.620 0.626 0.640 0.405
N 74 65 74 65 74 65 74 65 74 65
∗
Table C.1.1.4 -OLS Estimation of Performance Indicators on Competition Policy Indicators without/with Control Variables (Factual Independence of the Competition Authority as Independent Variable)
Variables P ERF P ERF P ERF P ERF P ERF P ERF P ERF P ERF P ERF P ERF
local local dominance dominance antitrust antitrust competiton competiton ef f iciency ef f iciency
Technique OLS OLS OLS OLS OLS OLS OLS OLS OLS OLS
COM Pdef acto 1.163∗∗∗ 0.848∗∗∗ 1.568∗∗∗ 0.960∗∗∗ 1.818∗∗∗ 1.376∗∗∗ 0.870∗∗∗ 0.614∗∗ 1.060∗∗∗ 0.764∗∗∗
(0.206) (0.226) (0.288) (0.272) (0.259) (0.267) (0.200) (0.182) (0.203) (0.181)
CT RLgovtcons -0.021 -0.033∗ -0.015 -0.022∗ -0.024∗∗
(0.011) (0.013) (0.013) (0.009) (0.009)
CT RLopenness 0.004∗ 0.006∗∗∗ 0.006∗∗ 0.007∗∗∗ 0.007∗∗∗
(0.002) (0.002) (0.002) (0.001) (0.001)
CT RLinf lation -0.002 -0.004 -0.007 -0.000 0.001
(0.004) (0.004) (0.004) (0.003) (0.003)
CT RLpatents 0.000∗ 0.000∗ 0.000 0.000 0.000
(0.000) (0.000) (0.000) (0.000) (0.000)
CT RLOECD 0.205 0.792∗∗ 0.737∗∗ 0.443∗ 0.542∗∗
(0.225) (0.270) (0.265) (0.182) (0.181)
CT RLEU 0.202 0.078 0.123 -0.017 -0.100
(0.184) (0.222) (0.218) (0.149) (0.148)
costant 4.340∗∗∗ 4.448∗∗∗ 3.286∗∗∗ 3.487∗∗∗ 3.326∗∗∗ 3.145∗∗∗ 3.914∗∗∗ 3.780∗∗∗ 3.811∗∗∗ 3.765∗∗∗
(0.132) (0.264) (0.185) (0.317) (0.167) (0.311) (0.129) (0.213) (0.131) (0.212)
R2 0.329 0.574 0.313 0.698 0.431 0.706 0.225 0.665 0.295 0.708
SER 0.629 0.512 0.880 0.615 0.791 0.604 0.612 0.413 0.620 0.411
N 67 59 67 59 67 59 67 59 67 59
∗
p<0.05,∗∗p<0.01,∗∗∗p<0.001 (standard errors in parentheses)