Raman imaging through a single multimode
fibre
I
VANG
USACHENKO, M
INGZHOUC
HEN,
ANDK
ISHAND
HOLAKIA*SUPA, School of Physics and Astronomy, University of St Andrews, Fife, KY16 9SS, UK *[email protected]
Abstract: Vibrational spectroscopy is a widespread, powerful method of recording the molec-ular spectra of constituent molecules within a sample in a label-free manner. As an example, Raman spectroscopy has major applications in materials science, biomedical analysis and clin-ical studies. The need to access deep tissues and organs in vivo has triggered major advances in fibre Raman probes that are compatible with endoscopic settings. However, imaging in con-fined geometries still remains out of reach for the current state of art fibre Raman systems without compromising the compactness and flexibility. Here we demonstrate Raman spectro-scopic imaging via complex correction in single multimode fibre without using any additional optics and filters in the probe design. Our approach retains the information content typical to traditional fibre bundle imaging, yet within an ultra-thin footprint of diameter 125µm which is the thinnest Raman imaging probe realised to date. We are able to acquire Raman images, including for bacteria samples, with fields of view exceeding 200µm in diameter.
Published by The Optical Society under the terms of theCreative Commons Attribution 4.0 License. Further distribution of this work must maintain attribution to the author(s) and the published article’s title, journal citation, and DOI.
OCIS codes: (350.4855) Optical tweezers or optical manipulation; (300.6450) Spectroscopy, Raman; (070.6120) Spa-tial light modulators; (110.2350) Fiber optics imaging; (110.7348) Wavefront encoding.
References and links
1. O. Stevens, I. E. Iping Petterson, J. C. C. Day, and N. Stone, “Developing fibre optic Raman probes for applications in clinical spectroscopy,” Chem. Soc. Rev. 45, 1919–1934 (2016).
2. I. Latka, S. Dochow, C. Krafft, B. Dietzek, and J. Popp, “Fiber optic probes for linear and nonlinear Raman appli-cations - Current trends and future development,” Las. Phot. Rev. 7, 698–731 (2013).
3. K. A. Esmonde-White, F. W. L. Esmonde-White, M. D. Morris, and B. J. Roessler, “Fiber-optic Raman spectroscopy of joint tissues,” Analyst 136, 1675–1685 (2011).
4. K. St-Arnaud, K. Aubertin, M. Strupler, M. Jermyn, K. Petrecca, D. Trudel, and F. Leblond, “Wide-field sponta-neous Raman spectroscopy imaging system for biological tissue interrogation,” Opt. Lett. 41, 4692–4695 (2016). 5. J. C. C. Day and N. Stone, “A subcutaneous Raman needle probe,” Appl. Spectrosc. 67, 349–354 (2013). 6. L. V. Doronina-Amitonova, I. V. Fedotov, A. B. Fedotov, and A. M. Zheltikov, “High-resolution wide-field Raman
imaging through a fiber bundle,” Appl. Phys. Lett. 102, 1–4 (2013).
7. T. Yamanaka, H. Nakagawa, M. Ochida, S. Tsubouchi, Y. Domi, T. Doi, T. Abe, and Z. Ogumi, “Ultrafine fiber Raman probe with high spatial resolution and fluorescence noise reduction,” J. Phys. Chem. C 120, 2585–2591 (2016).
8. Y. Hattori, Y. Komachi, T. Asakura, T. Shimosegawa, G. I. Kanai, H. Tashiro, and H. Sato, “In vivo Raman study of the living rat esophagus and stomach using a micro-Raman probe under an endoscope,” Appl. Spectrosc. 61, 579–584 (2007).
9. I. E. Iping Petterson, J. C. C. Day, L. M. Fullwood, B. Gardner, and N. Stone, “Characterisation of a fibre optic Raman probe within a hypodermic needle,” Anal. Bioanal. Chem. 407, 8311–8320 (2015).
10. T. ˇCižmár and K. Dholakia, “Shaping the light transmission through a multimode optical fibre: complex transfor-mation analysis and applications in biophotonics,” Opt. Express 19, 18871–18884 (2011).
11. S. M. Popoff, G. Lerosey, R. Carminati, M. Fink, A. C. Boccara, and S. Gigan, “Measuring the transmission matrix in optics: an approach to the study and control of light propagation in disordered media,” Phys. Rev. Lett. 104, 1–4 (2010).
12. I. N. Papadopoulos, S. Farahi, C. Moser, and D. Psaltis, “High-resolution, lensless endoscope based on digital scanning through a multimode optical fiber,” Biomed. Opt. Express 4, 260–270 (2013).
13. Y. Choi, C. Yoon, M. Kim, T. D. Yang, C. Fang-Yen, R. R. Dasari, K. J. Lee, and W. Choi, “Scanner-free and wide-field endoscopic imaging by using a single multimode optical fiber,” Phys. Rev. Lett. 109, 1–5 (2012).
#290634 https://doi.org/10.1364/OE.25.013782
14. T. ˇCižmár and K. Dholakia, “Exploiting multimode waveguides for pure fibre-based imaging,” Nat. Commun. 3, 1027 (2012).
15. S. Bianchi and R. Di Leonardo, “A multi-mode fiber probe for holographic micromanipulation and microscopy,” Lab Chip 12, 635–639 (2012).
16. J. Ma and Y. S. Li, “Fiber Raman background study and its application in setting up optical fiber Raman probes,” Appl. Opt. 35, 2527–2533 (1996).
17. J. V. Thompson, G. A. Throckmorton, B. H. Hokr, and V. V. Yakovlev, “Wavefront shaping enhanced Raman scattering in a turbid medium,” Opt. Lett. 41, 1769–1772 (2016).
18. M. Plöschner, T. Tyc, and T. ˇCižmár, “Seeing through chaos in multimode fibres,” Nat. Photon. 9, 529–535 (2015). 19. T. ˇCižmár, M. Mazilu, and K. Dholakia, “In situ wavefront correction and its application to micromanipulation,”
Nature Phot. 4, 388–394 (2010).
20. F. Pedregosa, G. Varoquaux, A. Gramfort, V. Michel, B. Thirion, O. Grisel, M. Blondel, P. Prettenhofer, R. Weiss, V. Dubourg, J. Vanderplas, A. Passos, D. Cournapeau, M. Brucher, M. Perrot, and E. Duchesnay, “Scikit-learn: machine learning in Python,” J. Mach. Learn. Res. 12, 2825–2830 (2011).
21. M. Montes-Usategui, E. Pleguezuelos, J. Andilla, and E. Martín-Badosa, “Fast generation of holographic optical tweezers by random mask encoding of Fourier components,” Opt. Express 14, 2101–2107 (2006).
22. ASTM standard E1840, “Standard guide for Raman shift standards for spectrometer calibration,”http://www. astm.org/Standards/E1840.
23. F. L. Galeener, “Band limits and the vibrational spectra of tetrahedral glasses,” Phys. Rev. B 19, 4292–4297 (1979). 24. L. F. Santos, R. Wolthuis, S. Koljenovi´c, R. M. Almeida, and G. J. Puppels, “Fiber-optic probes for in vivo Raman
spectroscopy in the high-wavenumber region,” Anal. Chem. 77, 6747–6752 (2005).
25. S. A. Strola, J.-C. Baritaux, E. Schultz, A. C. Simon, C. Allier, I. Espagnon, D. Jary, and J.-M. Dinten, “Single bacteria identification by Raman spectroscopy,” J. Biomed. Opt. 19, 111610 (2014).
26. S. Stöckel, J. Kirchhoff, U. Neugebauer, P. Rösch, and J. Popp, “The application of Raman spectroscopy for the detection and identification of microorganisms,” J. Raman Spectrosc. 47, 89–109 (2015).
27. T. Vankeirsbilck, A. Vercauteren, W. Baeyens, G. Van der Weken, F. Verpoort, G. Vergote, and J. P. Remon, “Appli-cations of Raman spectroscopy in pharmaceutical analysis,” Trends Anal. Chem. 21, 869–877 (2002).
28. C. Shende, W. Smith, C. Brouillette, and S. Farquharson, “Drug stability analysis by Raman spectroscopy,” Phar-maceutics 6, 651–662 (2014).
29. M. Vueba, M. Pina, and L. Batista de Carvalho, “Conformational stability of ibuprofen: assessed by DFT calcula-tions and optical vibrational spectroscopy,” J. Pharm. Sci. 97, 845–859 (2008).
30. M. Boczar, M. J. Wójcik, K. Szczeponek, D. Jamróz, A. ZieÌ ˛aba, and B. Kawałek, “Theoretical modeling of infrared spectra of aspirin and its deuterated derivative,” Chem. Phys. 286, 63–79 (2003).
31. S. Engelsen, “Raman spectra of carbohydrates,” http : //www.models.life.ku.dk/~specarb/ lactose.html.
32. J. Komárková, H. Montoya, and J. Komárek, “Cyanobacterial water bloom of Limnoraphis robusta in the Lago Mayor of Lake Titicaca. Can it develop?” Hydrobiologia 764, 249–258 (2015).
33. M. Li, P. C. Ashok, K. Dholakia, and W. E. Huang, “Raman-activated cell counting for profiling carbon dioxide fixing microorganisms,” J. Phys. Chem. A 116, 6560–6563 (2012).
34. I. V. Ermakov, M. Sharifzadeh, M. Ermakova, and W. Gellermann, “Resonance Raman detection of carotenoid antioxidants in living human tissue,” J. Biomed. Opt. 10, 064028 (2005).
35. L. Rimai, M. E. Heyde, and D. Gill, “Vibrational Spectra,” J. Am. Chem. Soc. 95, 4493–4501 (1973).
36. H. Yamakoshi, K. Dodo, A. Palonpon, J. Ando, K. Fujita, S. Kawata, and M. Sodeoka, “Alkyne-tag Raman imaging for visualization of mobile small molecules in live cells,” J. Am. Chem. Soc. 134, 20681–20689 (2012).
37. K. Czamara, K. Majzner, M. Z. Pacia, K. Kochan, A. Kaczor, and M. Baranska, “Raman spectroscopy of lipids: a review,” J. Raman Spectrosc. 46, 4–20 (2015).
38. D. E. Bugay, J.-O. Henck, M. L. Longmire, and F. C. Thorley, “Raman Analysis of Pharmaceuticals,” in “Handbook of vibrational spectroscopy,” D. E. Pivonka, ed. (John Wiley & Sons, Ltd, Chichester, UK, 2007), pp. 1–24. 39. A. C. De Luca, M. Mazilu, A. Riches, C. S. Herrington, and K. Dholakia, “Online fluorescence suppression in
modulated Raman spectroscopy,” Anal. Chem. 82, 738–745 (2010).
40. M. Chen, N. McReynolds, E. C. Campbell, M. Mazilu, J. Barbosa, K. Dholakia, and S. J. Powis, “The use of wavelength modulated Raman spectroscopy in label-free identification of T lymphocyte subsets, natural killer cells and dendritic Cells,” PLOS ONE 10, 1–14 (2015).
41. S. Dochow, D. Ma, I. Latka, T. Bocklitz, B. Hartl, J. Bec, H. Fatakdawala, E. Marple, K. Urmey, S. Wachsmann-Hogiu, M. Schmitt, L. Marcu, and J. Popp, “Combined fiber probe for fluorescence lifetime and Raman spec-troscopy,” Anal. Bioanal. Chem. 407, 8291–8301 (2015).
42. S. Farahi, D. Ziegler, I. Papadopoulos, D. Psaltis, and C. Moser, “Dynamic bending compensation while focusing through a multimode fiber,” Opt. Express 21, 510–512 (2013).
43. R. Y. Gu, R. N. Mahalati, and J. M. Kahn, “Design of flexible multi-mode fiber endoscope,” Opt. Express 23, 26905–26918 (2015).
44. A. M. Caravaca-Aguirre, E. Niv, D. B. Conkey, and R. Piestun, “Real-time resilient focusing through a bending multimode fiber,” Opt. Express 21, 12881–12887 (2013).
1, 298–310 (1996)
46. H. Park and T. W. Lebrun, “Parametric force analysis for measurement of arbitrary optical forces on particles trapped in air or vacuum,” ACS Photonics 10, 1451–1459 (2015)
1. Introduction
The inelastic scattering of light leads to a characteristic Raman spectra that is indicative of the constituent atoms and molecules present within a given sample. This powerful label-free vibrational spectroscopy approach has found a myriad of applications. In particular Raman analysis has immense promise for biomedical applications including a variety of fibre-based systems with clinical relevance [1, 2]. Fibre probes for Raman analysis range greatly in size from around 1 cm [3, 4] down to sub-mm dimensions [5–7]. It has been identified that small Raman probes may enable new applications: sub-mm probes may be used in endoscopy [8], penetrate skin [5] tissue or solid organs and enable new forms of needle probes [9], or be part of a core biopsy needle. However, size constraints limit design options for the sub-mm probes, with single-pixel volumetric Raman detection often being the only available option, as advances are required to circumvent the issues of incorporating filters an lenses at this small scale. The notable exception of a small footprint Raman imaging is the use of a 300µm fibre bundle [6] for Raman spectroscopy at the fibre facet. The application in this study was restricted to the immediate proximity of the fibre tip, with a resolution limited by the inter-core spacing.
Separately over the last few years, correction methods through complex (scattering) media have enabled a number of microscopy modalities to be applied through a multimode fibre, whether using transmission matrix measurement [10, 11] or digital phase conjugation [12]. Re-flection [13] and fluorescence [14] microscopies, as well as optical trapping [15] have been demonstrated. Importantly these are in the absence of any additional optics at the fibre output. However, to the best of our knowledge, Raman endoscopy through a single multimode fibre has not been demonstrated. This is particularly challenging given the very weak signal and strong background signal from the fibre material [16]. This is an area that would dramatically benefit from ultra-thin fibre probes, enabling Raman acquisition in challenging scenarios. We note that wavefront optimization was used to enhance by 20% the Raman signal from TiO2particles [17] behind a scattering medium, but the method provided no imaging capability.
In this letter, we report the smallest footprint Raman imaging fibre probe reported to date. It is based on a single 125µm diameter (50µm core) multimode fibre for both the excitation and collection of Raman signal, in the absence of any filters and focusing optics. Using the trans-mission matrix (TM) approach [10] we perform wavefront correction to focus light beyond the distal end of the fibre to diffraction-limited spots atλ =532 nm, with a spatial resolution and collection efficiency governed by the fibre NA of 0.22. We can perform either point Raman ac-quisition, or collect images by digitally scanning the corrected spot. The nature of the correction means we can also scan this spot at given distance from the distal end of the fibre with a trade off
in terms of collection efficiency and field of view (FOV). In this way, we achieve a field of view of 200µm diameter, which is notably larger than the fibre size. Due to the dimensions and in-expensive nature of the fibre it lends itself to clinical applications where its ultra small diameter may permit enhanced access to organs in-vivo and applications within confined geometries.
2. Materials and methods
2.1. Experimental setup
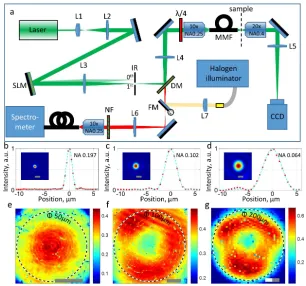
The experimental setup is shown on the Fig. 1(a). The output beam of a λ = 532 nm laser (Verdi-5V, Coherent, Santa Clara, CA) was expanded using a telescope (lenses L1, L2) and projected onto the active area of a spatial light modulator (LCOS-SLM X14168-01, Hamamatsu, Hamamatsu, JP). The wavefront correction was performed in the first diffraction order, which was isolated in the Fourier plane using an iris. The SLM plane was relayed to the entrance pupil of a 10×NA 0.25 objective (Newport) which focused the light onto the proximal facet (with respect to the light source) of a single multimode fibre (Thorlabs, AFS50/125Y, low-OH, 50µm core, NA 0.22, 140 mm long). The fibre facet was thus placed conjugate to the Fourier plane of the SLM. A quarter-wave plate placed before the objective converted the beam polarisation to circular, which is well-preserved in multimode fibres [18].
The multimode fibre was cleaved and stripped of the jacket, then connected on both ends using 2.5 mm diameter ferrules (CF128, Thorlabs, Newton, NJ). It was observed that with the jacket present on the fibre, it exhibits fluorescence signal an order a magnitude stronger than the silica Raman signal from the same fibre. While we found that prolonged exposure to ∼50 mw at 532 nm significantly reduced the fluorescence, the jacket was removed to minimize the background.
Phase masks projected onto the SLM were then used to focus the light into diffraction-limited spots either 50µm, 270µm, or 450µm behind the proximal facet of the MMF, resulting in a 50µm,100µm, and200µm fields of view, respectively. A discussion on the choice of FOV and fibre-sample distance is provided in the Appendix: A1. Choice of FOV. The Raman light scattered from the sample was collected and guided back through the same fibre probe, passing through appropriate filters (RasorEdge 532 dichroic and 532 notch, Semrock, Rochester, NY) and sent into an imaging spectrometer (Shamrock 303i with Newton EMCCD, Andor, Belfast, UK) via a collection fibre and a custom F-matcher. We used a 500 nm blazed 600 lines/mm grating, and the entrance slit of the spectrometer was set to 200µm (measured FWHM spectral resolution 32 cm−1 at 1000 cm−1 and 25 cm−1 at 3000 cm−1). The speckle patterns from the fibre were recorded in transmission geometry using a CCD camera (piA640-210gm, Basler, Ahrensburg, Germany)
2.2. Correction algorithm
Controlling the light field on the distal end of the multimode fibre is an established technique which relies on the prior acquisition of the complex fibre transmission matrix (TM)Mi j. The matrix relates a set of input modesxigenerated by an SLM to a set of output modesyi(camera pixels) in a linear manner:yi =Mi jxj[11]. The calibration procedure is performed as follows:
1. A set of input SLM modesxj is chosen, of which one is selected as a reference (x0).
2. A probe input mode and the reference mode, with an introduced phase shift between them, are sent through the fibre: x0+xjei
n−1
2πN,n ∈ {1, ...,N}. An image of the output
modes intensityyi nis recorded for each phase shift (N=5 in our case).
3. Complex interference coefficients for the probed input mode are deduced from the ac-quired image sequence for every output mode (pixel):Mi j=P
n yniei
n−1 2πN.
4. The steps 2-3 are repeated for all the input modesxj.
phase-Fig. 1. Experimental setup and performance. (a) Schematics of the optical setup (multi-mode fibre, MMF; dichroic mirror, DM; notch filter, NF; flip mirror, FM; lenses, L). (b-d)
Beam shape on the fibre axis at 50µm, 270µm, and 450µm away from the facet,
respec-tively. Scale bars are 3µm. (e-g) Power fraction in the focus at the corresponding distances,
resulting in50µm,100µm, and200µm FOVs. Grey scale bars are 20µm, total bar
length in (g) is 40µm.
only SLM, it can be shown that the optimum field is obtained by simply taking the phase of the resulting SLM maskxj, ignoring its amplitude [15].
For a50µm FOV we use 575 SLM segments as input modes [19], which correspond to plane waves with a well-defined wavevector k⊥ at the fibre input facet. For100µm and 200µm FOVs we chose 2300 plane waves at the SLM [15] for the input modes, which gave focused spots on the input fibre facet.
[image:5.612.153.459.95.381.2]2.3. Focus after correction
To measure focusing efficiency of the beam across FOVs we recorded camera images of the spots for different positions, and related the total intensity within the Airy disk (comprising the first bright ring) to the total intensity from the fibre. The focusing efficiency profiles are shown on Figs. 1(e)-1(g). A slightly higher overall efficiency is measured for the100−200µm FOVs, as compared to the50µm FOV, and it is likely due to a higher number of modes used for the beam optimization.
For the50µm FOV, the efficiency profiles is uniform and close to 40% in the centre but decreases towards the edges, where not all k⊥ can contribute to the focus. The situation for 100−200µm FOV is strikingly different, with centre part being weaker than the peripheral regions. Due to geometry, the on-axis focal spot at 270−450µm distance cannot be accessed by highestk⊥components. It has been shown before that mode groups with differentk⊥(radial modes) are only weakly coupled [14], so the power sent into highestk⊥ radial modes cannot strongly contribute to the spot. However, as the focus moves towards the edge of FOV, the maximumk⊥ for which the focal point is accessible, increases. As the modes within a given radial group can efficiently couple between each other, the focusing efficiency towards the edges increases as well.
However, the inter-group coupling of radial modes is still present. If we assume such coupling to be zero, the theoretical maximum for on-axis focusing efficiency would roughly scale as inverse square of the distance from the facet (see Appendix: A2. Focusing efficiency remarks). This gives values of 0.18 and 0.06 for distances of 270µm and 450µm distances, respectively. At the same time, the measured values are both significantly higher scoring around 0.3, which signifies that the power is redistributed within the fibre from higherk⊥ modes, for which the focal spot is not directly accessible, towards the lowerk⊥ modes. It has been shown that the coupling between different radial mode groups is suppressed in a perfect straight fibre without defects, while it is appears in a deformed fibre [18]. Coincidentally, we used a fibre bent at 90 degrees, thus improving focusing efficiency at large distances from the fibre, by allowing power to migrate between radial mode groups.
Images of a focused spot are shown on the insets of Figs. 1(b)-1(d). The intensity profiles along one dimension are each fitted to an Airy pattern to extract the effective NA. The fit yields an NA of 0.2 for the50µm FOV, slightly smaller than the fibre nominal NA 0.22. This occurs as we preselected the input modes based on their coupling efficiency into the fibre, and the highestk⊥modes were left out by applying a threshold. For the100µm and200µm FOVs, the NA were 0.1 and 0.064 respectively, which is slightly higher than the predicted values of 0.09 and 0.055, respectively. Additionally, the intensity profile on (d) clearly shows side lobes stronger than that of an Airy pattern fit. For a given focusing NA, strong side lobes and narrow core are properties seen in Bessel beams, which lack lowk⊥components. The higher effective NA observed suggests that the beam far from the fibre facet is no longer Gaussian, i.e. the higher k⊥components dominate over the lower ones, making the beam a hybrid between Gaussian and Bessel. The possible reason for this is that the highestk⊥ components reaching the focal spot are enhanced by higher radial modes coupling into them.
2.4. Spectral unmixing and Raman imaging
fibre background), each contributing with a certain weightWji. Mathematically, this means that the measurement matrix can be decomposed asA≈C·W, withC,W >0, as neither weights nor spectral components can be negative. To find the matricesC,W we use a non-negative matrix factorization procedure (NMF) implemented in Python [20]. The optimization problem consists of findingC,W such that they minimize the objective function
kA−C·WkFro2 +αkWk1. (1)
The first term is a Frobenius norm of the approximation errorP
i,j|aij|2, the second term is an L1 norm P
i,j|Wji| introduced to reinforce sparseness of the weight vectors, andα is an empirical numerical factor. As the pixels were smaller than the sample clusters we imaged, a single pixel usually contained background, plus a dominant Raman signal from the pharma-ceutical present, other contributions being zero. The choice of sparse weights ensured that the obtained components corresponded to individual chemical spectra and not to a particular linear combination of them, which is typical for e.g. the principal component analysis.
The weights vectors were normalized to have zero minima and unit maxima, so thatW ∈ [0,1]. The componentsCi were scaled accordingly to conserve the matrix productC·W, and thus effectively represented maximal absolute counts for each component for a 5 s acquisition time.
The obtained normalized weights were used to construct Raman images. To improve image contrast the black level was set to 0.05 for all images, i.e. the [0.05,1] region was linearly mapped to [0,1], and the values below 0.05 were set to 0. For Raman imaging of pharmaceu-ticals, RGB false color images were constructed with different colour channels representing different compounds. Colour (R,G,B)=(0,0,0) corresponded to black, while (R,G,B)=(1,1,1) to white colour. For 50µm and 100µm FOV diameters, the paracetamol and ibuprofen normal-ized weights were assigned to the red and the green channels, respectively, and the blue channel was set to zero. The200µm FOV images contained clusters of four different chemicals while the RGB colourspace has only three dimensions. To deal with this, the paracetamol, ibuprofen, and aspirin weights were assigned to red, green, and blue channels, respectively. The fourth component, lactose, was represented by a 4th false colour (white), which resulted in adding its intensity to all three RGB channels simultaneously:
R = Wparacetamol+Wlact o se (2)
G = Wi bu pro fen+Wlact o se (3)
B = Wa s piri n+Wlact o se (4)
Additionally, the pixels in the image corners for200µm FOV, which fell outside the desig-nated FOVs, were cropped out before the NMF procedure.
Note that that if the constraint Eq. (1) is no longer enforced, the matrix decomposition is not unique. Thus, for a given transformation matrixT, a new set of components and weights can be obtained, such as the decomposition remains valid:
C∗=C·T, W∗=T−1W (5)
A≈C·W =C∗·W∗ (6)
2.5. SNR evaluation
The signal to noise ratio (SNR) for imaging was estimated based on single-shot spectra as the maximal signal count over the image related to the noise of the background in the correspond-ing wavenumber range. The background was assumed to follow Poissonian distribution with standard deviation equal to the square root of the average counts. The SNR of the recovered spectral components (quality of spectrum determination) was estimated differently, as those were not based on single-shot measurements but rather on total signal acquired during imaging. Instead of the background noise, the maximal spectral value was related to the standard devi-ation of the signal in 2000-2500 cm−1with no Raman signatures from the compounds studied in this work.
2.6. Raman spectroscopy of a trapped particle
To acquire both the Raman signal from the particle and the background reference, a total of five spectra were acquired for different beam configurations. The first configuration is a single focus trapping the bead. For other four configurations, the light is split in two foci such that in all instances one spot traps the particle. The remaining part of the beam is diverted to four different spots in the background region around the trapped particle. This two-foci beam is encoded by the two individual spot masks combined using the random mask approach [21].
2.7. Sample preparation
Polystyrene suspension A suspension of polystyrene beads (Thermo Scientific 7510A,
11µm mean diameter,≤ 18% coefficient of variation) was placed on a standard glass cover-slip (No 1, 24 mm×50 mm) and dried to form agglomerations.
M. smegmatis Mycobacterium smegmatis (NCTC 8159), were grown at 37oC in Middle-brook 7H9 medium (FLUKA) supplemented with 4 ml of 50% glycerol (for 450 ml) (Sigma-Aldrich) and 0.05% Tween80 (Fisher BioReagents). An aliquot (1mL) of bacterial suspension were heat inactivated by exposure to a temperature of 80oC for 20 minutes. The inactivated aliquot was then smeared on a glass coverslip.
Pharmaceuticals Commercially available pharmaceutical tablets of paracetamol (Aspar
Pharmaceuticals Ltd, UK), aspirin (Galpharm Pharmaceuticals Ltd, UK), ibuprofen (Galpharm Pharmaceuticals Ltd, UK) were ground and mixed together on a glass slide for imaging. Apart from the active compound, the tablets additionally contained lactose (ibuprofen, aspirin), su-crose (ibuprofen), and sodium disulphite (paracetamol).
L. robusta The bacterial strain Limnoraphis robusta was purchased from Culture Collec-tion of Algae and Protozoe (CCAP strain 1446/4, Scottish Marine institute, Oban, Scotland, UK) and kept in a medium mixture ASW:BG, exposed to indoor ceiling fluorescent lighting at standard levels. Bacterial filaments were placed on glass coverslip and immersed in the storage medium during the acquisition.
3. Results
3.1. Imaging of polystyrene beads
(spectra of individual compounds) and normalized weights (contribution of the corresponding spectral component to a given pixel in the image, see Materials and Methods: Spectral unmixing and Raman imaging).
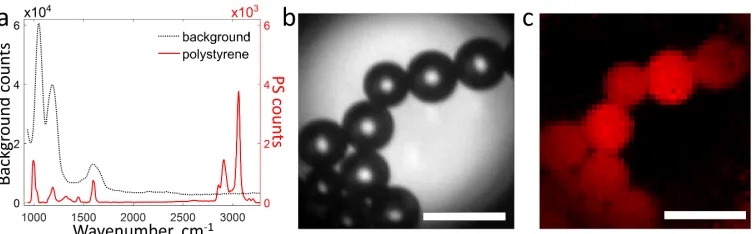
The spectral components corresponding to the background (black dotted line) and polystyrene (red solid line) are shown in Fig. 2(a). The background spectra contains strong Ra-man peaks from silica within the fibre in the 900-1600 cm−1region [23], as well as broad, near constant fluorescence signal also originating from the fibre. The red curve in Fig. 2(a) clearly shows characteristic Raman peaks associated with polystyrene [22], notably at 1001 cm−1 and 3054 cm−1. By comparing the silica and polystyrene Raman peak intensities, we note that the background is 10-50 times stronger than the Raman signal at low wavenumbers (900-1600 cm−1). The fluorescence background around the 2500-3200 cm−1is uniform and weaker than the Raman background at lower wavenumbers. It is of similar amplitude to the polystyrene Raman peaks at those wavenumbers. This spectral region was chosen for Raman imaging with our fibre probe.
[image:9.612.119.497.319.436.2]Figure 2(c) shows normalized pixel-wise weights of the polystyrene spectral component, which effectively form a Raman image. Note the gradual fading of the signal towards the edge of the image due to weaker focusing (see Materials and Methods: Correction algorithm) and reduced collection efficiencies (see Appendix: A1. Choice of FOV) .
Fig. 2. Raman imaging of polystyrene particles dried on a glass coverslip. (a) Background (black dotted) and polystyrene (red solid) spectral information (treated as described in the
Methods). Note the different scales for the two curves. (b) Bright field image of the particles.
(c) Weights for polystyrene spectral components, showing a Raman image of the particle
distribution. Scale bars are 20µm.
3.2. Imaging ofM. smegmatis
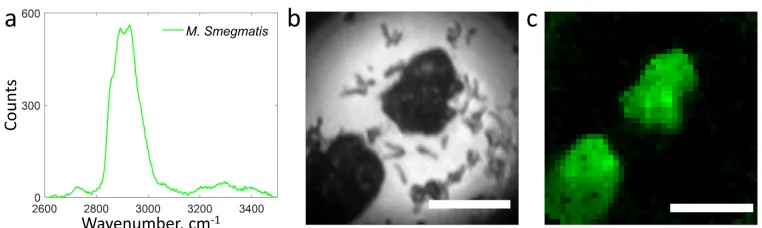
We also apply our fibre Raman imaging to clusters of heat-inactivated bacteria M. smegmatis at 50µm from the distal end of the fibre with a 50µmFOV. To address the signal intensity fading towards the edges as seen for the polystyrene image (see Fig. 2(c)), we modulated the excitation power across the FOV, such that we maintain a constant power at focus (20 mW, see Materials and Methods: Focus after correction). As seen in Fig. 3(c), this partially alleviated the signal non-uniformity across the FOV, but the collection efficiency profile (see Appendix: A1. Choice of FOV) may also be taken into account. However, stronger modulation requires more power to be discarded, thus is only feasible if the system is not limited by the available laser power.
Fig. 3. Raman imaging of M. smegmatis bacterium clusters. (a) Spectral intensity in the
2600-3500 cm−1region. (b) Bright field image of bacterial clusters, also showing the
pres-ence of individual bacteria. (c) Normalized weights for the spectral component shown in (a) to create a Raman image. Note we presently do not have the sensitivity to observe
indi-vidual bacteria. Scale bars are 20µm.
Despite lower information content than the fingerprint region (500–1800 cm−1), the 2900 cm−1 peak has proven useful for differentiating bacteria species either solely, or in conjunction with the fingerprint range [25,26]. Additionally, we studied the repeatability of the acquired bacterial spectra for N = 15 clusters (data not shown) to verify that the variance did not exceed 10% across the main peak.
3.3. Identification of pharmaceuticals based on Raman images
Raman scattering is widely used for pharmaceutical analysis and identification [27,28] and thus this serves as a further demonstration of our novel fibre probe and its imaging capability. Here, we image and identify clusters of paracetamol, ibuprofen, aspirin tablets, all of which contain lactose, a common additive found in painkillers. For the sample, preparation, drug tablets were ground and mixed on a glass coverslip. The Raman images were acquired using three different settings as follows:
1. sample at 50µm from the fibre,50µm FOV, central NA=0.2, power of 12−20 mW at the sample.
2. sample at 270µm from the fibre,100µm FOV, central of NA=0.1, 26−36 mW power.
3. sample at 450µm from the fibre,200µm FOV, central NA=0.06, 20−50 mW power.
The power at the sample was estimated as a product of total transmitted intensity with the focusing efficiency which is not uniform across the FOVs. The non-uniformities can in principle be compensated for by corresponding modulation of the input power as seen in figure 3.
The results are shown on the Fig. 4, with the rows of Figs. 4(a)-4(c), 4(d)-4(f), and 4(g)-4(i) corresponding to FOVs of 50 µm, 100 µm, and 200µm diameter, respectively. The smaller FOVs were used to image two pharmaceutical compounds (paracetamol and ibuprofen), while a 200µm FOV was sufficient to locate and image all four pharmaceutical compounds.
shown in red, green, blue, and white, respectively (see Methods: Spectral unmixing and Raman imaging).
Fig. 4. Raman imaging of paracetamol and ibuprofen clusters for a50µm (a-c),100µm
(d-f), and200µm (g-i) field of view. (a,d,g) Spectral components for paracetamol (dashed
red), ibuprofen (solid green), aspirin (dot-dash blue), lactose (dotted black). (b,e,h) Bright field image of drug clusters. (c,f,i) Raman image of drug clusters with red for paracetamol,
green for ibuprofen, blue for aspirin, and white for lactose. White scale bars are 20µm. Full
scale bars on (h,i) are 40µm.
3.4. Resonance Raman spectroscopy of cyanobacteria
are attributed to carotenoids, with the underlying slope indicating the fluorescent background from the bacteria. The bands are assigned as follows: the strongerν1 peak at 1510 cm−1 orig-inates from C=C stretching,ν2 at 1150 cm−1 is from C-C stretching, andν3 at 1000 cm−1 is from C-CH3deformation [35].
Fig. 5. Raman signal from cyanobacterium Limnoraphis robusta (a), and a trapped 11µm
polystyrene bead (b).
3.5. Optical trapping and Raman spectroscopy of a single polystyrene bead
Our approach can also combine Raman spectroscopy with optical trapping performed through the very same multimode fibre. We generate a 2D optical trap in water to immobilize 5µm and 11µm polystyrene beads against a coverslip 50µm from the fibre facet, for Raman spectra to be taken. To provide a background reference, the beam was split in two foci, one keeping to hold the particle trapped with a fraction of power, while other pointing to a part of the FOV devoid of any particles (see Methods: Raman spectroscopy of a trapped particle).
The estimated power at the focal spot was 50 mW, the acquisition time was 20 s per spectrum, and the spectra were treated using NMF. We additionally measured the trap stiffness as a func-tion of power, and found it to be∼0.35 pN/µm/mW for 5µm and∼0.1 pN/µm/mW for 11µm beads (see Appendix: A3. Optical trap stiffness). The Raman spectrum of a 11µm particle is shown on Fig. 5(a) and its composition (polystyrene) can be clearly identified (see Fig. 2(a)).
4. Discussion
We have presented the thinnest fibre Raman imaging probe up to date, suitable for endoscopic applications in biomedical analysis. The approach has proved highly versatile, with applications including single-point Raman spectroscopy, Raman imaging of individual samples including bacteria, or a mixture of compounds, and finally, a Raman spectroscopy of optically trapped objects. It is instructive to place our fibre probe in context and discuss some future directions of study and potential hurdles one might envisage.
On the other hand, compounds exhibiting resonantly enhanced Raman such as aforemen-tioned carotenoids, typically have an extremely strong signal dominant over the fibre back-ground. Apart from cyanobacteria addressed in this work, those are contained in a range of human tissues and have been validated as useful biomarkers [34]. These can be detected using our fibre system. Fibre probes has been previously designed for carotenoid screening inside tissues [34] and our imaging capability would add value to such diagnostics.
The fibre luminescence background in the 2000–3500 cm−1range, as well as the fluorescence from the imaged sample, can in principle be eliminated using wavelength-modulated Raman scattering (WMRS) [39, 40]. In this method, the wavelength modulation of the excitation light in WMRS translates into the modulation of Raman signal, which allows for extracting it from non-Raman and non-resonant background and attaining a higher signal to noise ratio. To adapt our fibre method to WMRS, the SLM holograms would have to be updated to account for the change of wavelength. We note that the main fibre background in the coveted fingerprint region originates from silica Raman peaks which are thus immune to the WMRS and can only be removed by background subtraction. This would merit a future study.
For a given power and acquisition time, the signal/noise ratio of a single-shot spectrum is lim-ited by the statistical background fluctuations which we estimate as the shot noise of the back-ground counts. In our case, the SNR ranged from 9 to 21 (ibuprofen and lactose at200µm FOV). For imaging applications with subsequent matrix decomposition into spectral compo-nents and weights, the single-shot spectra served to determine the chemical composition of a given pixel, i.e. the intensity of the pixel. Thus, the imaging SNR was that of a typical single shot spectrum. On the other hand, the spectral components obtained from our decomposition take into account all pixels that contain spectra from a given compound. This means we eff ec-tively have a longer acquisition time proportional to the total amount of that compound in the FOV. As a consequence, the spectra we have extracted from images have a much higher SNR than individual single-shot Raman spectra. As an example, a spectral component from a trapped polystyrene bead is much noisier (Fig. 5(b), SNR≈165,Tacq=20 s) than the same component obtained from the PS imaging (Fig. 2(a), SNR≈820,Tacq=5 s, see Methods: SNR evaluation) despite a 4×longer pixel acquisition time.
In practice, the measured imaging SNR& 10 allows for trade-offs to be made to the probe design at the cost of this SNR advantage. For example, the fibre length can be increased up to 1 m, or weaker Raman signals may be recorded at the immediate vicinity of the distal end of a short fibre. Finally, excitation power and acquisition time can be increased. However in the latter case, the total exposure may become an issue for cell/tissue viability.
The probe also offers flexibility in choosing the FOV size as a function of the distance from the sample to the fibre tip. The trade offfor an increased FOV is lower resolution and reduced collection efficiency. The focusing efficiency remains approximately the same thanks to power redistribution between different modes within the fibre, and the number of resolved points (ratio ofFOV to the spot size) also remains relatively constant due to the constant number of modes. The collection efficiency – angular size of the fibre core as seen from the focus – decreases with the inverse square of the distance from the fibre end (see Appendix: A2. Focusing efficiency re-marks). However, for a given total number of pixels, a bigger FOV lends itself for imaging more extended (thicker) clusters, producing a stronger signal and thus partially alleviating the weak collection. Hence, as we have demonstrated, FOVs well in excess of the physical fibre diameter are accessible without compromising image and spectral SNRs. This represents a substantial advantage and we may potentially image walls in endoscopic settings, e.g. blood vessels.
acquisi-tion. Single-shot wavefront measurement with digital phase conjugation [12] may be a better approach for those fibres.
Such a wavefront shaping approach for fibre correction can also be directly applied to com-mercially available fibre Raman probes [41] to convert them directly into imaging devices. At the cost of larger probe size, they offer excellent background suppression due to in-line filters and different fibres for excitation and detection, and improved collection efficiency due to fo-cusing optics.
Obstacles of our approach towards clinical implementation of this Raman imaging system are dictated by the nature of the fibre transmission matrix and its acquisition. Firstly, there is the sensitivity of the TM to deformation of the fibre, which impedes the desired flexibility of the probe. Second is the need to access the distal end of the fibre during the calibration, which is not practical in endoscopic settings. However, recent advances in wavefront shaping overcome these issues and allow for correcting the TM without direct access to the fibre distal tip, either by using a holographic virtual beacon [42], or by using a partially reflecting fibre distal tip [43]. These approaches together with use of fast digital micromirror devices (DMD) [44] can pave the way towards fast bending-resilient Raman endoscopy with an ultra-thin fibre probe.
Our ultra thin probe opens up various perspectives for Raman applications including those in endoscopy especially for retrieving Raman signals from biomedical samples. The imaging modality of the probe was implemented by digitally scanning the excitation beam on the distal end of the fibre by applying different phase masks on the SLM. The approach has applications ranging from Raman spectroscopy of optically trapped matter to Raman imaging of mixture of chemical compounds or bacteria. Additionally, we have a 200µm-diameter imaging FOV, which exceeds the 125µm diameter of the fibre, and covers an area sixteen times that of the fibre core. We believe this may open up new opportunities to record Raman spectra in clinical and biomedical studies and in other environments where access is restricted.
Appendix
A1. Choice of FOV
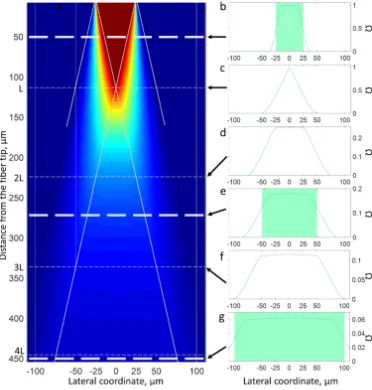
Imaging with a given multimode fibre can be done with different FOVs, depending on the dis-tance from the sample plane to the fibre tip. As the imaging plane is set further away, the acces-sible FOV increases, while the effective NA and the collection efficiency decreases. In our paper we use FOV of 50µm and 100µm diameter, and choose optimum separation between fibre tip and the sample in terms of uniformity and average efficiency over the desired range. Figure 6(a) shows the normalized collection efficiency of a point source as a function of distance from the fibre and lateral coordinate. The efficiency is calculated as an intersection of a spherical sector representing the solid angle at which the fibre core is seen from a given point, with the NA=0.22 acceptance cone of the fibre. The value is further normalized to one.
For the FOV comparable in size with the fibre core (50µm) it is optimal to set the sample as closely to the fibre as possible, in which case the maximal collection efficiency is preserved over the most of the FOV. To avoid touching the sample on the coverslip we select separation distance at 50 µm, which gives the collection profile shown on Fig. 6(b). The green overlay shows the desired FOV.
The closest distance at which the collection efficiency is non-zero over 100µm circle is L = Rcot (arcsin (N A)) ≈ 110.8 µm (Fig. 6(c)), however it is highly non-uniform. Putting fibre at 3Lgives a uniform collection profile over the whole field of view, but at cost of highly reduced normalized efficiency (≈ (1/3)2, Fig. 6(f)). For our experiment we choose the fibre-sample separation of 270µm≈2.43L, which combines relatively uniform profile with higher efficiency than at 3L. The green overlay shows the desired FOV.
Fig. 6. Normalized collection efficiency as a function of source position. (a) 2D map of
collection efficiency. Solid lines depict 0.22 NA divergence. (b-f) Efficiency profiles at
(b) 50µm=0.45L, (c) 110.8µm=L, (d) 221.6µm=2L, (e) 270µm≈2.43L, (f) 332.4µm=
3L.
towards the edges of the FOV.
It should be noted that the Raman imaging contrast will also be affected by variations of beam focusing efficiency at large distances, which is not included in the calculations above. The focusing efficiency is discussed in Methods section of the main manuscript.
A2. Focusing efficiency remarks
It has been previously shown [14] that the radial mode groups in cylindrically symmetric mul-timode fibers do not strongly couple between each other. Making the assumption of zero cou-pling between such radial modes, we estimate maximal theoretical focusing efficiency given the uniform illumination of the fiber in thek−space. Let the total input power of 1 be uniformly distributed in thek−space over a circle of radiusKdetermined by the fiber maximal NA:
K= 2π
λ N A (7)
whereλis the wavelength. The power density in thek−space is then (πK2)−1.
At the centre of the fibre axis at a distancedfrom the output facet, the apparent angular size of the fibre core is arctan(R/d), which corresponds to thekma x=2λπsin(arctan(R/d)).
Provided that all the modes from a given 2πk dkring are directed to the focus, the maximum power in the focus is thus given by:
P= 2
K2
mi n(km a x,K)
Z
0
k dk =min(k 2
ma x
K2 ,1). (8)
For distances smaller thanL, the maximum powerP=1. BeyondLford≫ R, the integral scales approximately as inverse square of distance:
A3. Optical trap stiffness
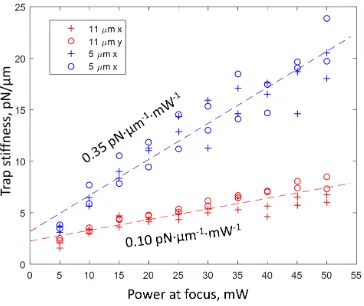
The stiffness of optical trap was measured for PS particles of 5µm and 11µm diameter at powers 5-50 mW using the equipartition theorem:
k=kbT/ D
x2E.
To obtain the particle positions we recorder 3000-frame videos with frequency of 409.5 Hz. Then, the coordinates were determined using the particle trapping toolbox for Matlab (Math-works, MA, US) [45]. Then, the variancesDx2E
were determined after subtracting the linear drift.
The cumulative data for two particles of each size is shown on the Fig. 7, for bothx−and y−directions. The totality of points for a given bead size was fitted with a linear function to extract the stiffness estimate. The fit gives 0.3 and 0.1 pN/um/mW for 5µm and 11µm beads, respectively. It should be noted that the equipartition is based on the variance which is a biased estimator. Notably, any noise in the system leads to an overestimate of the variance and thus underestimate of the stiffness. At the same time at low powers, the variance is underestimated due to the finite acquisition time, which leads to an overestimate of the trap stiffness. Addi-tionally, as the particles were pushed against a coverslip, an increased friction may result in an overestimate of the optical stiffness.
[image:16.612.217.399.423.576.2]Optical trapping quantification was beyond the scope of this paper, so we did not perform additional stiffness measurement with other techniques. However, the measured estimate agrees well with values reported in literature [46]. The authors trap 20µm polystyrene particles in air and vacuum, with λ=1064 nm, with NA≈0.32. The diameter to wavelength ratio is close to that used in our paper (11µm at 532 nm), and the NA is∼ 50% higher than we used. They measure 0.096 pN·µm−1·mW−1trap stiffness, which is in a good agreement with our value of 0.1 pN·µm−1·mW−1measured for 11µm particles in similar conditions.
Fig. 7. Trap stiffness for 5µm and 11µm spheres as a function of power.
Funding
Acknowledgments