Self-Reflection and Personal Physicalization Construction
Alice Thudt
1Uta Hinrichs
2Samuel Huron
3Sheelagh Carpendale
11
InnoVis Group
2SACHI Group
3Télécom ParisTech
University of Calgary, Canada
University of St Andrews, UK
Université Paris-Saclay, France
[email protected] [email protected] [email protected] [email protected]
ABSTRACT
Self-reflection is a central goal of personal informatics systems, and constructing visualizations from physical tokens has been found to help people reflect on data. However, so far, construc-tive physicalization has only been studied in lab environments with provided datasets. Our qualitative study investigates the construction of personal physicalizations in people’s domestic environments over 2–4 weeks. It contributes an understanding of (1) the process of creating personal physicalizations, (2) the types of personal insights facilitated, (3) the integration of self-reflection in the physicalization process, and (4) its benefits and challenges for self-reflection. We found that in construc-tive personal physicalization, data collection, construction and self-reflections are deeply intertwined. This extends previous models of visualization creation and data-driven self-reflection. We outline how benefits such as reflection through manual con-struction, personalization, and presence in everyday life can be transferred to a wider set of digital and physical systems.
ACM Classification Keywords
H.5.m. Information Interfaces and Presentation (e.g. HCI): Miscellaneous
Author Keywords
Self-Reflection; Constructive Visualization; Personal Data
INTRODUCTION
“Active, persistent, and careful consideration of any be-lief or supposed form of knowledge in light of the grounds that support it, and the further conclusions to which it tends, constitutes reflective thought.”Dewey, 1910 [14] As Dewey’s definition highlights, reflection requires active engagement with our experiences. Personal data can be used as “grounds that support” such reflections to draw conclu-sions for our actions, thoughts, character, and, ultimately, foster self-knowledge. Supporting data-driven reflection has become an active research topic in HCI and information visu-alization (e.g., [3, 22, 32]) with a focus on goals, processes, favourable conditions, insight types, and levels of reflection, as well as the development of tools for collecting and pre-senting personal data—often in form of visualizations—to Permission to make digital or hard copies of all or part of this work for personal or classroom use is granted without fee provided that copies are not made or distributed for profit or commercial advantage and that copies bear this notice and the full citation on the first page. Copyrights for components of this work owned by others than the author(s) must be honored. Abstracting with credit is permitted. To copy otherwise, or republish, to post on servers or to redistribute to lists, requires prior specific permission and/or a fee. Request permissions from [email protected].
CHI 2018,April 21–26, 2018, Montreal, QC, Canada
© 2018 Copyright held by the owner/author(s). Publication rights licensed to ACM. ISBN 978-1-4503-5620-6/18/04. . . $15.00
DOI:https://doi.org/10.1145/3173574.3173728
foster reflection. But even millennia before these research fields existed, people have created and reflected on physical representations of data (i.e.,physicalizations[28]; see [15]), to track, for example, menstrual cycles [52], or personal ac-complishments [20]. The manual construction of personal visualizations using simple physical building blocks persists until today (e.g., Hunger’s Lego time tracking physicaliza-tion [23]). The constructive visualizaphysicaliza-tion paradigm [25] is promising for supporting self-reflection as it fosters active engagement with the data and draws on simple and familiar actions and materials [25], rather than requiring learning and navigating interface components [51]. However, so far, the manual construction of visualizations has not been studied in a personal context. Previous empirical studies were conducted in lab environments with test datasets.
To address this gap, we have investigated how people manu-ally construct physicalizations of their own data and within their personal environment over a 2–4 week period. Our main goal is to gain an in-depth understanding of how constructive physicalization approaches are applied in personal contexts. Our analysis reveals details about how people approached the creation of their physicalizations and suggests that this process allows for personal reflections that are deeply intertwined with the manual construction. From this first exploration of physi-calization construction in a personal context, we contribute (1) a description of the construction process, (2) a list of reflection types it facilitated, (3) a description how these reflections are embedded into manual construction, and (4) a discussion of benefits and challenges of physical visualization construction for reflection. These contributions lead to design considera-tions for transferring our findings on physical visualization construction to a wider set of digital and physical tools for personal reflection, and outline avenues for future research.
RELATED WORK
Our work draws on research on self-reflection in personal informatics and visualizations, and visualization construction.
Understanding Data-Driven Reflection
phases[33]. Others explore how to createfavourable condi-tionsfor reflection, for example, allowing time to reflect [2, 18, 21], and supporting iterative inquiry [2]. Cox et al. distinguish twotypesof “digital epiphanies”, resulting in acceptance or behaviour change [13]. A survey of professionals’ reflective practices, describes descriptive, dialogic, transformative, and critical reflectionlevels[18]. However, meta-reviews of self-tracking [29] and reflective informatics research [3] found that studies often do not explicitly focus on insights and reflective processes or provide evidence of “reflective thought beyond simply looking at the data” [3]. Our work considers “reflection itself as a meaningful activity” [3] and differentiates reflection types and processes in a personal visualization context.
Studying Self-Reflection Using Personal Visualizations
Reflection is often supported through personal visualizations (see [22] for an overview). Particularly visualization systems aiming at self-understanding are predominantly evaluated in controlled experiments measuring accuracy and efficiency [22]. Such studies cannot reveal complex reflective thoughts beyond examining data [47]. Choe et al. include “self-reflections” by considering contextual information, confirmation, or con-tradiction of existing knowledge, and future predictions in their characterization of Quantified Selfers’ visualization in-sights [8]. In a following think-aloud study using a custom visualization tool, fewer high-level reflections were reported, possibly due to the tool or the lab study [9]. We extend this pre-vious work by describing how self-reflection can be supported by and embedded in manual construction.
Constructing Visualizations & Physicalizations
A growing body of work explores how to involve people in visualization creation through familiar [19] and novel digital tools [38], sketching [48], digital fabrication [40, 45], manual construction [25, 51], and crafting [40]. This act of active creation can be beneficial for reflection. For example, Walny et al. report a spectrum of data-related insights from sketching data [48]. Nissen and Bowers describe how involving people in digital fabrication and crafting of personal data can support meaning making and reflection [40]. We explore the manual construction of personal data from familiar physical mate-rials. Constructive visualization (i.e., manually assembling tokens to represent data) has been described as a dynamic, expressive, and simple way to construct physical and digi-tal representations [25]. Studies investigating this paradigm found that it allows novices to author visualizations [25] and spend more time on data-related actions compared to using Excel [51]. The constructive paradigm has been adopted by digital visualization tools such as iVoLVER [39] which shows potential to support more “thoughtful exploration” compared to more automated tools [38]. Researchers who used con-structive approaches in workshops [16, 24, 26] and classroom settings [50] further highlight the pedagogic potential of the approach. While 3D printing of personal physicalizations with pre-defined data mappings has been found to be a promising approach [30, 44], the manual construction of one’s own map-pings has only been studied in lab environments with provided datasets. Our work explores the constructive paradigm using physical materials in a real-world personal setting, focusing specifically on its potential for supporting self-reflection.
STUDY METHODOLOGY
Our qualitative study aimed at exploring constructive physi-calizations of personal data in the realistic setting of people’s own homes over a time period of at least two weeks.
Study Design
Our methodology combined a diary study method [6] with semi-structured interviews and was organized into four parts: an introductory workshop; a pre-interview; a physicalization activity of at least two weeks at home; and an exit interview.1
Introductory Group Workshop & Pre-Interview
We conducted a workshop to familiarize participants with the basics of working with data and of mapping data to visual variables. After a brief presentation, participants tried the pro-cess in groups of 2–3. Each group received a fictional dataset about a personal topic (e.g., expenses, dreams, headaches) as well as a variety of physical materials (e.g., plasticine, beads). To simulate an ongoing physicalization activity, groups were asked to decide on their physical mapping only based on the data summary and then reveal the dataset line-by-line after representing each data point. Groups then discussed each oth-ers’ physicalizations. Last, participants received a look-up sheet1summarizing the presentation to take home and were asked to think about (1) a personal topic and their motivation for exploring it, (2) data they wanted to capture, (3) a visual mapping using the provided physical materials, and (4) a way to integrate the construction process into their daily routines. We discussed these topics in individual pre-interviews, sched-uled at the convenience of participants. They also received a construction kit containing beads (8 colours, 3 sizes), plas-ticine and pins (8 colours each), tape (10 colours), thread (2 colours), labels, measuring tape, and a foam core board.1
Diary Method: Constructing Visualizations at Home
Next, participants constructed data about their chosen topic at home for a self-selected time period of at least 2 weeks. We asked participants to follow a continuous process, where each new activity constituting a data point is integrated into the evolving physicalization. We further encouraged them to doc-ument their process with photos and notes in diary entries sent to us via email. Each participant received five email check-ins during their physicalization activity containing questions about potential challenges or adjustments to their process, discover-ies and reflections, habits formed around the physicalization, and an invitation to share free-form thoughts and pictures.
Exit Interview
After the physicalization activity we met participants in their homes for a final interview and documented how the physical-ization was integrated into their personal space. During the 1–2 hour semi-structured interview we covered participants’ reflections and insights from the physicalization activity, in-tegration with routines, environment, and social context, and their thoughts on the physical approach to personal logging. In preparation, we tailored interview questions within these topic areas to each participant based on their dairy updates.
Participants
We aimed to recruit participants with diverse backgrounds and an interest in personal data. We distributed recruitment
posters on campus, in coffee shops, and community centres and through mailing lists and meetup groups. Nine partici-pants took part in our study (3 male, 6 female; aged 18–65). Six were university students (e.g., Design, Musicology, and Education), a stay-at-home mom, a teacher, and a college instructor. Their visualization expertise ranged from no experi-ence (n=1), occasional encounters in media, work or personal use (n=5), regular use for work or personal interest (n=2), to regular visualization creation of in a professional context (n=1). Seven participants had experience with personal data tracking using automated (n=2) or manual apps (n=4) or paper (n=1), typically to gain awareness of personal patterns (n=4).
Data Collection & Analysis
We video-recorded all interviews, collected participants’ di-ary entries and picture updates and photographed the final physicalization in its domestic context. Subsequently, all exit interviews were transcribed and the transcripts as well as par-ticipant diaries were coded by two researchers following a thematic analysis approach [4]. We applied two coding passes. In the first open coding pass, we coded participant statements following the main interview themes. The specific codes from the first pass were collaboratively analyzed to extract construc-tion process steps, types of personal reflecconstruc-tions and insights as well as benefits and challenges of the physicalization process. We then applied a focussed axial coding step [11] to relate the types of reflections to the construction process steps. We describe our findings in the following three sections.
CONSTRUCTIVE PHYSICALIZATION PROJECTS
Despite the time commitment of 5 to 25 minutes per day, all 9 participants engaged in the physicalization activity through-out their self-selected time period (14 to 28 days). Two partic-ipants have continued their physicalization process since. Chosen themes included activities and hobbies (n=5), health and fitness (n=3), mood (n=2), and work (n=1). Goals for tracking included gaining a better awareness of personal pat-terns (n=8), developing strategies to improve one’s life (n=5), self-motivation (n=4), and reminiscing (n=1). Some partic-ipants specified several goals and themes. Particpartic-ipants col-lected numerical, categorical, temporal and location data. Six participants included data about their subjective experience. Participants kept partial (n=5), full (n=2), or no (n=2) external specifications of their mapping, either in form of legends in the physicalization (n=4) or separate from it (n=3). The choices of construction materials varied as well: 8 participants used the beads to represent their data; 3 used plasticine, 2 used pins and string, and 1 used tape in their physical mapping. Materials were also used as aids (e.g. to hold tokens in place), for labeling, and decorative purposes. The created physical-izations take various forms (for an overview see Figure 1): 5 participants used the provided foam core board as a base, 3 integrated their physicalizations directly into the domestic environment, and 1 created a wearable physicalization. We describe each project focussing on (1) the motivation, (2) the collected data and physical mapping, and (3) the main benefits and insights people gained.2
2See supplemental material (pp.10–18) for additional pictures
[P1] Workouts:P1 wanted to create a“sport autobiography” of his workouts that adequately“portrays”this central part of his identity. He also aimed to use the physicalization to develop a workout routine that contributes to his well-being while facilitating his ambitious fitness goals. He used colours to represent his physical activities (e.g., running, swimming, biking; see Fig. 1.1). Intensities of workouts are marked with tape around the board, and durations are shown using beads next to the tape and in the centre of the board. The physicalization is laid out as a“race track”with start and finish flags, emphasizing P1’s“story”. He found that the manual construction fostered“deep thinking". The process paired with his knowledge on athletic training let P1 develop a workout routine that allowed his body to recover.
[P2] Hip Pain:P2 is experiencing severe hip pain and wanted create a physicalization to see how his pain progresses. His physicalization shows the intensity of the pain in the number of medium sized beads, the“walkability”in their colour, and his pain killer intake in the small beads for each day grouped on a piece of plasticine (see Fig. 1.2). After 5 days, P2 noticed that his pain is“very complex”and, thus, decided to add“difficulty of changing position”as an additional attribute (shown by the colour of a large bead) to more fully describe his experience. He stated that, while he did not use his physicalization directly in communication with a medical specialist, it helped him to become more aware of the intricacies of his condition.
[P3] Mood:P3 wanted to understand how being active affects her mood and to create a decorative artefact that would pos-itively affect her mood, because“it looks nice”. P3 created a bead ornament daily to decorate branches in her kitchen (see Fig. 1.3). She logged her data in 4-hour intervals, each represented by one bead with size showing P3’s mood and colour showing whether she was active, social, or home. Tak-ing materials with her while on-the-go allowed P3 to log her mood throughout the day. This ongoing constructing helped P3 gain an awareness of her mood which positively affected her reflections in the evening when hanging her day’s orna-ment into the branches:“Instead of going to bed thinking ‘it’s been a bad day’, you can see: ok, I’ve put a lot of big beads on, so it must have been a good day.”Contrary to P3’s expectation her activities did not have“any influence on the mood”.
[P4] Nutrition and Bowel Movements: P4 wanted to
1
2
3
4
5
6
[image:4.612.91.526.62.374.2]7
8
9
Figure 1. Overview of all 9 participants’ projects. The topics are: (1) workouts, (2) hip pain, (3) mood, (4) nutrition and bowel movements, (5) distractions during writing, (6) enjoyment of activities, (7) meditation, (8) places visited in a new city, (9) recipes for homemade care products.
[P5] Distractions during Writing:P5 created wearable phys-icalizations of distractions during her thesis writing. She an-ticipated that wearing them would motivate her to be focussed. She made one bracelet/necklace for each work day with one stitch representing 3 minutes of work and beads showing times of distraction (see Fig. 1.5). Work sessions are separated with purple beads. The colour of other beads shows whether tasks for each session were accomplished. Because“the process has not been as motivational as expected”, P5 started using the physicalization“in an explorative way”. This approach helped her develop more productive work strategies. The pro-cess further encouraged her to become“more compassionate” with her own ways of working.
[P6] Activities and Enjoyment: P6 wanted to understand
“where [her] time goes”. She logged 6 different activities (e.g., meditation, work, etc.) shown as different coloured beads, each representing one hour, with their size showing enjoyment (see Fig. 1.6). Aesthetic appeal was a central goal in P6’s design and is reflected in the circular layout of strings that each represent one day. P6 sometimes experienced the man-ual construction process as“tedious”. However, the invested effort made her feel“attached”to her physicalization.
[P7] Meditation: P7 created his physicalization to monitor and improve the“consistency”of his meditations and to un-derstand how forms of guidance affect the“quality”of med-itations. He represented meditation duration in the horizon-tal position of pins on a board in his meditation space (see
Fig. 1.7). The aggregated duration of all meditations per day is marked with a thread connecting consecutive days. Hand-rolled plasticine balls on the pins represent P7’s experienced quality of meditations (size) and the type of guidance (colour). The sensual aspect of the plasticine fit with P7’s mindfulness practice and allowed him to apply a“continuous”scale for meditation quality. He describes the visualization as a way to “keep [him] honest”, reward for his consistency, and prop to
have an“open dialogue”with friends about meditation.
[P8] Places Visited in a New City:P8 designed her physical-ization as a memento of her time in the city to which she just moved. She marked visited places with pins on two maps (city overview and detail of downtown; see Fig. 1.8). Pin colours represent types of places (e.g., restaurant or bar) and beads on the pins show how much she enjoyed each place (colour), and how long she stayed (size). P8 looked back on her day during construction, deciding:“If I like the place and I want to keep that memory in my life.”She describes herself as“very neutral” and found rating her enjoyment difficult. For her, the process was“helpful”in becoming more decisive. It motivated her “to go out more”, but also to adjust her expectations:“I will at
least do something new. One thing per day.”
[P9] Recipes for DIY Care Products: P9 creates her own
physicalization physical mapping data summary
data design mapping design DESIGN PHASE
DATA CONSTRUCTION PHASE steps repeated for each new activity
realization adjustments
contextual knowledge
separate log
prepared tokens
experience of new activity
integration preparing tokens
( separate logging )
[image:5.612.56.298.62.187.2]logging representation combined logging &representation
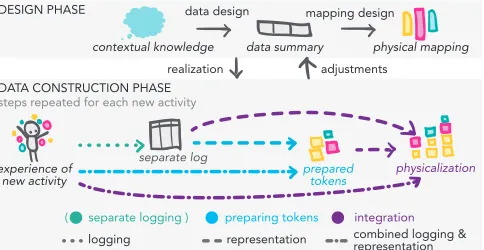
Figure 2. The physicalization process starts with a design phase. During the subsequent data construction phase, new data is repeatedly gathered and represented, either in separate or combined steps.
the recipe and to“actually play with them a bit more [...], sort of like Lego and just build [the recipe].” P9 used the finished“bead recipe”for making the product and to“label” its container. The physical construction has since replaced her previous approach of planning recipes on paper:“Translating from the written to the quantity is for me a bit more challenging than from the physical bead to the quantity of the thing.”
CONSTRUCTION PROCESS
As instructed by our study protocol, participants did not start their projects from pre-existing data but followed what we call an ongoing “data construction process” where data was collected and integrated into an evolving physicalization.
Design Phase
All projects began with aDesign Phase(see Fig. 2, top). Partic-ipants first decided on their topic and goals based oncontextual knowledgeabout their lives. Then they created adata sum-mary, including decisions on data attributes, possible catego-rizations, scales, and possible value ranges of attributes. Next, participants developed a physical mapping, deciding on how to map their data to the physical materials. Participants also con-sidered how daily data construction can fit into their everyday routines. During the design activity participants took notes, sketched, or experimented with the physical materials. With their designs in mind, participants engaged in physicalization— theData Construction Phase. Some participants adjusted their designs as part of their ongoing construction process.
Data Construction Phase
From our interview analysis we identified a series of steps (see Fig. 2, bottom) that were repeated during the construction phase as new experiences are physicalized:
Separate Logging:Three participants logged data digitally or
on paper in a textual, numerical or visual format, separate from their physicalization. One participant kept a complete separate log, and two relied on partial logs or occasional memory aids. Six participants did not create a separate log.
Preparing Tokens:To transform new data into physical form,
participants selected tokens (e.g., by picking a pin of a cer-tain colour), created intermediate constructs (e.g., by counting and arranging beads), or created customized tokens from mal-leable materials (e.g., by forming a plasticine ball of a certain size). Participants prepared tokens based on their separate logs (see previous step) or translated aspects of their experiences
directly into physical tokens (most often; n=7). This step resulted in one or more tokens describing the new data.
Integration:Next, participants integrated the prepared tokens
into their evolving physicalization, sometimes spatially arrang-ing them to represent further attributes of their experience (n=7). Values of these additional attributes were read from their log (n=3) or derived directly from experience (n=4). This step resulted in a physicalization that integrates the new data point in context of previously added data points.
While the individual steps described above are conceptually separate, they were intertwined by participants into a fluid process. For instance, only two participants created an in-termediate construct of prepared tokens, temporally separate from its integration into the physicalization. Further, while data capture and representation are commonly discussed as separate in self-tracking [32], we only observed this clear sep-aration in the case of one participant. All other participants combined tracking and representation of some or all data at-tributes in their construction process. To illustrate the different phases and steps, we describe processes of P5 and P7.
P5 followed an elaborate process. During writing she took notes on distraction times and captured writing tasks in a time tracking app (→separate logging). She then translated this data into a visual pattern for creating a bracelet on paper. Next, she counted the beads for the physicalization, while deciding whether tasks were accomplished (→preparing tokens). To craft the bracelet she followed her pattern using the prepared beads (→integration). Before completing the activity after 3 weeks, P5 pinned all bracelets to a foam core board, and added information about working hours from her app.
P7 transformed his meditation experience directly into phys-ical form. After each meditation he formed a plasticine ball, intuitively adjusting its size to match the felt quality of his focus (→preparing tokens). He then pinned the ball to a board in a position showing duration and date (→integration).
REFLECTION AS PART OF CONSTRUCTION
Next we describe the reported types of reflections, how they were embedded in the physical construction process, and the benefits and challenges of this process for self-reflection.
Types of Personal Reflections and Insights
The insights participants gained from their reflections ranged in levels of depth from simple data readings to contemplations of personal values and attitudes.
Reflection on Data:Insights directly derived from the data.
All participants made such observations that included the iden-tification of patterns, trends, correlations and relationships of attributes within the data (cf. [8]). For example, P7 recognized a trend suggesting personal growth:“You see, I start off doing a couple [of meditations], and they were not very good, and then eventually they improved.”Reflections on data allowed participants to answer personal questions. For example, P4 re-alized that eating larger amounts of vegetables was correlated with the occurrence of her daughter’s bowel movements.
Reflection on Context:Interpretations of data in the light of
personal meaning and implications from the physicalization and confirm or correct previous expectations:“I expected that I would go downtown a lot. But, actually, I didn’t go down-town that much. Only near my house.”[P8]. Furthermore, the physicalization activity enabled predictions. For example, P4 was able to predict her daughter’s bowel movements based on food intake as visible in the physicalization. The activity further triggered new questions to explore. For example, P5 became curious about the impact of working with other people on her concentration. Physicalizations also triggered reminisc-ing about events related to the shown data:“Just doing this and seeing this [physicalization] makes me remember those days. So, it can be like a journal.”[P8; places visited].
Reflection on Action:Motivation and development of
action-able strategies.Considering both data and contextual knowl-edge, participants developed strategies to achieve personal goals or improve their well-being: “Sometimes I take two aspirin pills at a time, and I found that, I can still achieve a similar effect just by taking one pill, and that would be much better for my stomach.”[P2; hip pain]. The awareness of her writing progress encouraged P5 to test new strategies she de-veloped through the physicalization activity:“I changed my writing process a lot thanks to this visualization. I realized that working in longer sessions was more beneficial for my writing process. I could have these longer threads with no beads [times without distractions]. So the day after that, you can see they are getting longer and longer.”[P5; distractions].
For some, the physicalization activity directly influenced be-haviours in a positive way. For example, the enjoyable process motivated P4c to go to the bathroom more frequently:“The tracking affected her behaviour, because she was motivated, so she tried to go more. Making these sculptures at night before bed was really fun for her. She’d look forward to it all day.”[P4]. The prospect of capturing accomplishments also influenced participants actions. For example, P8 visited more places, to be able to add new pins to her map: “If someone asked me, I never rejected [laughs]. I’d go everywhere!”. The tangible manifestation of personal habits also helped partic-ipants stick to their personal goals: “It was almost keeping me accountable to myself. It’s very hard to hide to yourself that you’re not meditating as much.”[P7]. Sometimes, how-ever, reflections on actions led to negative emotional responses such as“stress”[P8] or pressure, although some highlighted associated motivational effects. Some participants expressed disappointment when reflecting on their actions. For instance, P6“regretted”, lost opportunities for activities:“I definitely had time to do that. Like, why didn’t I do that?” Still, she experienced these critical reflections as“useful”to understand “why [she] made these decisions”[P6; activity enjoyment]. Few
days into her project P8 reported:“I realized my life is kind of boring. I did not do anything new but just everyday routine.” However, P8’s experience changed over time:“in retrospect I did many things for the 2 or 3 weeks.”
Reflection on Values:Contemplation of one’s character,
val-ues and attitudes. Participants related data readings to their values and motives: “[Points to small red beads] Here, I didn’t enjoy the times with my friends. But it’s good that I did it, because we haven’t talked in so long. So it’s good that
I spent that time cultivating the relationship.”[P6; activity enjoyment]. For some participants such reflections changed previous attitudes. For instance, it helped P8 become more de-cisive in considering which activities bring her joy:“I usually I don’t decide it that much. But for this [physicalization activ-ity] I tried to decide my enjoyment. So, actually, it was helpful and good for me!". For P2 [hip pain], the activity increased his confidence in communicating his condition:“Sometimes when you go see a doctor, you just feel there’s something wrong [but] you can’t really express it. I feel that, because I keep track of this, I’m a bit more in tune with my pain, and so I have more confidence when I explain what’s going on.” In-terestingly, four participants who initially intended to improve their behaviour, were able accept some habits through the project. For instance, P5 [distractions] reconsidered her high expectations:“Be a little bit more compassionate about your writing, but not too much [laughs]. Finding that balance was a good discovery. And not feeling guilty.”She further states: “You should not be so strict in evaluating what is success.”
To summarize, the four reflection types described above led to (1) insights directly from the data, (2) interpretations of the data in the light of personal context and pre-existing beliefs, (3) motivation and development of actionable strategies, and (4) contemplations of personal values and attitudes. It is im-portant to note that some reported reflections on context, and most reflections on actions and values can be characterized as “transformative” [18], thus leading to changes in actions and
personal beliefs.
Embedding Reflection in the Construction Process
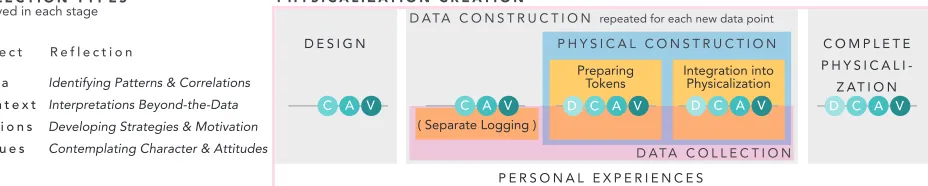
To gather considerations for supporting reflection, we ana-lyzed how reflection types were related to process steps of the physicalization activity (see Fig. 3).
Reflection during Design Phase.Reflection already started
( Separate Logging )
D E S I G N C O M P L E T E
P H Y S I C A L I -Z AT I O N Preparing
Tokens Integration intoPhysicalization
D ATA C O L L E C T I O N P H Y S I C A L C O N S T R U C T I O N D ATA C O N S T R U C T I O N repeated for each new data point
P H Y S I C A L I Z AT I O N C R E AT I O N R E F L E C T I O N T Y P E S
observed in each stage
P E R S O N A L E X P E R I E N C E S Identifying Patterns & Correlations
Interpretations Beyond-the-Data Developing Strategies & Motivation Contemplating Character & Attitudes Da t a
Co n t e x t
Ac t i o n s
Va l u e s
S u b j e c t R e f l e c t i o n
D C A V D C A V
D C A V C A V
[image:7.612.84.548.67.160.2]C A V
Figure 3. An integrated process of personal physicalization creation and self-reflection. Circles show which types of insights participants described during each step of the physicalization creation.
from triggering negative feelings of guilt or pressure. For ex-ample, P5 [distractions] deliberately chose colours that“were both equally energetic and free of judgement. It’s not like red and green.”P1’s colour choices express his excitement about his athletic“life-style”.
Reflection during Separate Logging.While only three
par-ticipants created data logs separate from the physicalization, we found evidence that this separate logging step can enable reflection (cf. [7, 10]). For example, when jotting down her writing distractions, P5 noticed that although she kept getting distracted, her work was still productive (→context). Separate logging further enabled reflection-in-action [42]: It provided P5 with a“clear picture of the status in that moment”, al-lowing her to directly adjust her strategies: “You lose your focus, then you work 9 minutes, then you lose your focus for about 6 minutes [...] and then I mean: just stop working! And that’s when I stopped the session.”For P5, categorizing new data points even led to considerations of personal→values, for example, to decide what constitutes work and what is a distraction. In contrast, the other two participants created sep-arate logs mainly as a memory aid. For example, P2 [hip pain] used it to keep track of his pain killer intake during the day. However, he stated that adding to the log did not spur direct insights:“I would just log and then I don’t even try to reflect on it, because it’s just like a bunch of words. [...] I wouldn’t even bother reading a part in the past basically.”
Reflection when Preparing Tokens.Participants comments
reveal that the token preparation step encouraged all four types of reflections on→data,→context,→actions, and→values. They particularly highlighted this process as reflective, when representing qualitative aspects of their experience (e.g., mood or pain) through physical attributes by selecting and customiz-ing tokens. For instance, chooscustomiz-ing a bead colour encouraged P8 to reflect on her enjoyment: “I just tried to decide: If I like the place, so I think I was happy, and I want to keep that memory in my life, that feeling, then I put the red [bead].”
The timing of the token preparation also affected reflection. Four participants prepared tokens directly after each activity. For instance, P7 found this to be important to assess the quality of his experience accurately:“When I do the two [meditations] I found that I would have to stop, make the plasticine ball and then continue. Because if I waited too long I wouldn’t be able to accurately assess the quality.” Similarly, P3 experienced selecting beads to show her mood multiple times during the day as beneficial: “This way I reflected at different times during the day so I didn’t have to do a whole day at one time.”
In contrast, the five participants who prepared tokens only once a day, appreciated this dedicated moment to reflect. For instance, for P6 counting beads became“a reflection at the end of the day.”Similarly, preparing tokens in the evening helped P4 to gain awareness of her daughter’s nutrition:“Having that information, going through it all at one place and one time. I think, just the mental act of counting out the beads [...] it internalizes it in a way and kind of manifests or makes it real.”
In addition to retrospective reflections, manipulating tokens also supported future planning. For instance, P9 used tokens to creatively explore new recipes:“The thing I really liked about turning these things into physical objects was that I could kind of play with them a bit more. I just took beads and I put them together sort of like Lego and just build [the recipe]”. In this way, she generated new recipes that she tried later.
Reflection during Integration.Participants also reported all
four types of reflections when integrating prepared tokens into their physicalization. This activity brought new data points into the context of previous ones which particularly facilitated reflections on→datapatterns and trends. For instance, P2 described how this integration step made him“more aware” of his pain:“With this [physicalization] I’m forced to review, and because the format is much more visual, I need to re-flect every single time when I put something on it.” Some participants described this activity as a reflective ritual that fostered reminiscing, reconciling new insights with expecta-tions (→context), adjusting personal strategies (→action), and considering new insights in the light of personal attitudes and
→values. P3 [mood] described how, when hanging her bead ornament into the branch (Fig. 1.3), reflections on her day re-minded her of her accomplishments:“The ritual, like putting it up on the branch in the evening, it also was something to remember and [...] work through the day! [...] I think, it’s triggering this sense of accomplishment.”
Reflection using the Completed Physicalization.
de-voting intense attention to his condition for the 2 weeks, he wanted to“keep [his] mind off the pain a bit”. Others stated that they had answered their questions, and felt that continu-ing would not yield additional discoveries, unless they would refocus their attention to other aspects or topics:“I was gonna do it again, but I will probably make a bigger change, like only track one thing specifically. I feel like we got out of this method what we could possibly get out of it.”[P4; nutrition].
Benefits and Challenges of Constructing Personal Data
Our findings suggest that the physicalization activity provided our participants ample opportunities for self-reflection. Par-ticipants described benefits and challenges of the creation process related to reflection regarding personalization, phys-icality, manual effort, and presence of the physicalization in everyday life, sometimes drawing comparisons to digital tools.
Personalization.Participants personalized their
physicaliza-tions in expressive ways, visible in the great variety in the resulting physicalizations (see Fig. 1). The process allowed focussing on personally meaningful aspects. For example, in contrast to her previous practice of pinning visited places in Google maps, P8 captured enjoyment and duration of visits, which for her indicated the importance of places in her life. The physical materials further enabled personal mappings es-pecially of qualitative aspects of experiences. For instance, the plasticine allowed P7 to express the quality of his medita-tions on a continuous scale:“Having to bin stuff would have detracted from it. I wanted those continuous changes. I’d take one [piece of plasticine] and roll a ball. And then you can look at the ball and be like ’does this feel right?’ and then add and subtract more.”P5 compared the freedom of the physicalization process to using her time tracking app: while the app reliably shows how much time she spends writing, it does not help her reflect on “uncountable” aspects related to the quality of her experience, for example, the level of fo-cus. This flexibility further allowed P9 to add data attributes to more fully describe his hip pain after becoming aware of its complexity. Also, in contrast to digital analysis tools, the personal involvement in the representation creation seems to support internalization of gained insights:“On the app I really rely on the apps’ analysis versus my own. I really couldn’t tell you what I’d eaten in a month, if I didn’t go back and see their little bar charts, because I’d forgotten. Whereas on this [physicalization], I felt like I was starting to have an intuitive understanding. Because [in the app] I’m not physically build-ing it each day. That way I have to rely on the analysis that it provides back to me. So I wouldn’t be able to tell you anything [shrugs].”[P4; nutrition].
Physicality.The physicality of the materials was experienced
as both a benefit and a challenge. More than half of our partic-ipants explicitly described the working with the materials as “fun”or“enjoyable”. Participants described how it supported a continuity of their physical experience. For example, P7 [meditation] found that the sensuality of plasticine fit into his mindfulness practice. Comparing it to digital apps, he states: “Just knowing I have to pull out my phone and navigate the
interface... I think, I wouldn’t be as eager to [engage with it].”P2 [hip pain] felt that the physicality of materials made it easier to capture his physical pain:“I don’t imagine doing this
on an app. I think it’s less natural, because the pain that I feel is physical, and doing it on an app is digital, and so it might be a bit harder to relate the feeling.”However, participants also commented on physical constraints getting in the way of their representations’ accuracy and, consequently, their reflections. P8 [places visited] regretted having to omit repeated visits from her physicalization, because of the limited space for pins on her map. P1 [workouts] had to skew his representation to work within the physical constraints of the board:“I couldn’t really stretch that [tape] out to show it was 40Ks. The board it’s on just wouldn’t allow that.”
Manual Effort. The physical construction process requires
manual effort which can make it more time consuming than digital logging:“The advantage of Google [maps] is, I can pin when I’m there. It has GPS, and I can just pin more easily.”[P8; places visited]. However, participants emphasized that this manual effort benefited reflection:“It takes more time than just clicking on the phone. But during that time I can think. So everyday I think, and I see what I did before. So it also helps me remember.”[P8]. The manual construction also helped participants to internalize an awareness of their topic: “The manipulatives definitely helped internalizing it over time. [It made] the analysis more intuitive. I think, that had to do with physically building it.” [P4; nutrition]. Participants’ statements reveal a feeling of pride and attachment to their physicalizations which promoted an ongoing engagement with the corresponding data. The manual effort involved seemed to contribute to this:“You are more attached because you spend more time on it. [...; Digital logging is] practical just to see what happened, but this one is more... you invest so much time and energy thinking about it, so it has more value.”[P6]. Although token-based physicalizations can be freely manipu-lated and explored, participants found this to be too tedious. Because of this, P8 [places visited], for example, refrained from changing her map to focus on the part of the city where she spent most of her time, when she realized that this area was starting to get cluttered. P4 [nutrition] wanted to explore how certain foods affected her daughter’s bowel movements, but manually re-sorting and filtering the beads was just“too much work”. Only P9 used the tokens in an exploratory way to iterate on recipes:“I had the beads, so I could just put them out, and I could swap them and be like: Do I want it this way or this way?”However, none of our participants applied ma-jor changes to completed physicalizations parts or performed interactive operations such as aggregation or filtering.
Presence in Everyday Life.The physicality enabled the
was there. It triggered the conversations. [...] Instead of me telling him what I’ve been doing, he actually asked, because he saw what different colours I used.”[P3; mood]. Similarly, P4’s whole family got involved in a shared analysis of the physicalization:“Sometimes it got left on the coffee table for a few days and then the boys would be sitting there trying to figure out if there is a pattern or what does it mean.” How-ever, presence in everyday life also made the physicalizations vulnerable to damage:“The cat was really curious, and I’m afraid she would start clawing at it just for fun.”[P1].
DISCUSSION
We discuss our findings in the light of previous work on reflec-tion, personal visualizareflec-tion, and visualization creation.
The Impact of Physical Manipulation on Reflection
Previous work has highlighted the importance of consider-ing how personal data trackconsider-ing is “enmeshed with everyday life” [41]. Our study findings show constructive physicaliza-tion as one way of achieving this. Its flexibility and customiz-ability enabled participants to tailor personal physicalizations to their unique values and concerns, personal context and environment, allowing data collection and representation to become part of their everyday routines. Extending work that highlights the importance of agency and personalization for mindful self-reflection in clinical contexts [1, 43], we found that allowing participants to design their own personal data categories, visual mappings, tracking processes, and physical-ization form factors can benefit reflection for diverse personal scenarios. By constructing visual mappings in line with their individual mental models of the data, participants engaged in an activity that can be related to an “expressive mode of learning” [36, 37]. The constructive physicalization approach proposed in this paper, can be connected to previous work that describes physical externalization of cognitive processes and incremental construction as beneficial for thinking and com-prehension [31]. The active involvement in the construction of personalized visual representations, may thus have contributed to the intuitive understanding of the data and the meaningful personal observations reported by our participants.
We found that previously described advantages of manual tracking—greater control, flexibility, awareness [7] and “inti-macy with data” [10]—were reinforced through the manual approach to both data logging and representation. The con-structive approach also provided greater expressive freedom compared to pre-defined digital or 3D printed visualizations (cf. [30, 44]). However, it limited the accuracy and granular-ity of participants’ representations and participants found the effortful process to pose barriers for fine-grained long-term logging (cf. [7, 12]). Further, physical long-term tracking usu-ally requires disassembling physicalizations to reuse materials, which, in turn, destroys the captured data. Despite of these limitations, our results show that exploring a topic even for a short time can yield important personal insights (cf. “Dear Data” [35, 34]). This suggests that physical construction is particularly suitable for short-term curiosity-driven, or “docu-mentary” tracking [41], for creating mementos and personal artifacts (e.g., P3,P8,P9; cf. [40, 46]), or for long-term tracking of less frequent events (e.g., P7).
From Low-Level to High-Level Reflections
We have identified four personal reflection types as part of the physicalization activities: identification of patterns and relationships in thedata, interpretations in the light of one’s personalcontextand assumptions, development of strategies and motivation that affect one’sactions, and contemplations of one’svalues, attitudes, or character. While instances of the former three types of reflections have been reported previ-ously [8, 9], reflections on personal values are rarely discussed. Furthermore, the lack of an agreed upon framework that helps to systematically categorize reflections in personal informatics, complicates the comparison of reflections across studies. We contribute a detailed and nuanced description of reflections, and how these are facilitated through physical materials as a means to represent personal data. Interestingly, “transforma-tive reflections” [18] (i.e., the reconsideration of beliefs and habits), rarely reported in studies with digital prototypes [9], were common among our study participants, possibly due to our physical approach to constructive visualization (see previ-ous section). In line with previprevi-ous work [18], we found that “lower” level reflections on data and context were often a pre-requisite for deeper reflections: For example, recognizing data patterns (e.g., the frequency of new places visited by P8) led to contemplations of their deeper meaning for personal values (e.g., adjustments to P8’s perception of what constitutes an exciting life). These findings inform further research on how to facilitate reflection at different levels with both physical and digital personal visualizations.
Relating Reflection Types to Process Steps
Our findings show that self-reflection is deeply intertwined in the process of physical data construction. This is in contrast to foundational models of both personal informatics systems [32] and visualization creation [5, 27] that describe the formation of insights as a separate and deliberate step after the data is transformed into a visual or physical format. Previous work further describes process steps [10, 32] and reflection types [9] separately. Our findings relate individual steps of the phys-icalization process (i.e., design, optional separate logging, preparing tokens, integration, and examining the completed physicalization) to the types of reflections they facilitated. All steps are accompanied by most types of reflections except for the design stage and separate data logging (see Fig. 3). The lack of reported reflections on data in the design phase is explained by the lack of data at this stage. During separate logging, the mostly textual or numerical form may have ham-pered identifying patterns and correlations. Also only three participants incorporated this step into their process. During all other steps—preparing tokens, integration, and examin-ing the complete physicalization—participants mentioned all four types of reflections. It is possible that their active in-volvement (c.f. [40]) in all steps of physicalization creation promoted these diverse reflections throughout the process. If self-reflection is considered a primary goal, we suggest facili-tating a more active role for people in the design of personal visualizations, than is commonly assumed in digital tools.
Direct Visualization of Experience
formed direct associations between their experience and the visual and physical properties representing them. For instance, P2 used colours instead of abstract categories to capture as-pects of his pain in his separate log. Only two participants created a log or legend that fully described their mapping of physical attributes to numerical or textual data; seven captured aspects of their experience directly through the physicalization, intuitively mapping them to physical properties without an ex-plicit prior data categorization. While this transformation of an experience directly into a visual and physical manifestation makes it more difficult to create alternate representation later on, it seems that the continuity of the process allowed par-ticipants to directly reflect on the quality of their experience, rather than creating an additional layer of abstraction in form of numerical or categorical characterizations of the collected data. This is further supported by the fact that, similarly to previous observations in the context of physicalization con-struction [25], our participants spoke interchangeably about the physical tokens and the data these represented. The fact that most of our participants’ data was implicit in their phys-icalization process is remarkable, considering that existing models of visualization and physicalization creation [5, 27] as well as self-tracking processes [32] assume an explicit data manifestation created in a separate data collection step. Our findings highlightdirect visualization of experienceas an under-explored type of visualization process and an interesting avenue for future research.
CONSIDERATIONS FOR DESIGN & FUTURE RESEARCH
As a first exploration of personal physicalization construction, our findings provide considerations for designing physical and digital personal visualization tools and highlight interesting questions for future research.
Exploring Visualizations as Data Input.Constructive physi-calization allows to directly manifest experiences, making data implicit in the process. Participants described this activity as reflective. Selecting and customizing tokens allowed express-ing qualitative experiences that cannot be easily quantified or categorized, and the integration of tokens let participants directly see new data in context which facilitated immediate reflections. Similarly, future tools could explore visualizations as a means to directly capture qualitative attributes, for exam-ple, by manipulating position, size or colour of visual marks, or by sketching data into a visual representation.
Visualizations as Generative Planning Tools. Constructive physicalization is not only a way to reflect on past experi-ences, but it can also facilitate imagining and planning future activities in a hands-on way. One participant described ma-nipulating tokens as a visual means to generate new recipes. Similarly, Hunger used lego blocks to plan his work sched-ule [23]. Exploring the potential of visualization for reflection on future activities (e.g., for budgeting, time management, and creative tasks) is an exciting avenue for future research.
Towards Stand-alone Personal Data Construction Kits.
Some participants expressed interest in sharing the personal physicalization approach and construction kit with others. Ex-ploring stand-alone data construction kits (see e.g., [16, 34]) could help to support activities without in-person guidance
that we provided through an introductory workshop and email check-ins. Participants stated that the emails did not affect their reflection, but found the workshop and look-up sheet helpful for their visualization design. However, future em-pirical research is needed to better understand how cues for reflection can be best provided in form of such stand-alone personal data construction kits.
Expressive Freedom vs. Constraints. Our construction kit featured a rich selection of materials, to provide expressive freedom. While all participants found the kit sufficient for real-izing their designs, some statements suggest a desire to include all available material or colour options into the physicalization. This sometimes aggravated the problem of “tracking too many things” common in personal logging [10], and, in turn, made the activity time-consuming and the resulting visualizations difficult to interpret. An interesting avenue for future research is the investigation of meaningful constraints for physical and digital construction tools, as started by Huron et al. [26], con-sidering the trade-off between expressivity and mitigating the problem of tracking too many categories.
LIMITATIONS
As an ongoing internal process self-reflection is difficult to study [2]. It is not always possible for people to recall when and how insight occurred. Participants’ regular diary entries and pictures of the evolving physicalizations, as well as tai-lored interviews at multiple stages of the project, reduced this problem. While we aimed to stay as close as possible to a re-alistic situation of daily personal physicalization construction, we acknowledge that diary entries and study setting may have impacted participants’ activities and reflections. While our par-ticipants represent people of different ages and backgrounds, the sample size is too small to be considered representative. Future research building on our findings is required to explore how our results generalize to larger populations.
CONCLUSION
Our study provides a first exploration of constructive physical-ization in a personal real-world context. We found that the pro-cess facilitated deep reflections on the data, personal context, actions and values. We discussed how these reflections are deeply embedded in and supported by the manual construction. The process allowed people to personalize representations and integrate these within their personal environment to spark mo-ments of reflection and conversations. Our findings point to exciting directions for design and future research in the context of both physicalization creation and tools for self-reflection. Our results further highlight the potential of physicalization construction in a personal context, including the fluid integra-tion with people’s routines, benefits for capturing qualitative and subjective aspects, supporting shared experiences, as well as the potential of using constructive visualizations as a gener-ative tool for planning and cregener-ative exploration.
ACKNOWLEDGEMENTS
REFERENCES
1. Amid Ayobi, Paul Marshall, Anna L. Cox, and Yunan Chen. 2017. Quantifying the Body and Caring for the Mind: Self-Tracking in Multiple Sclerosis. In Proceedings of the SIGCHI Conference on Human Factors in Computing Systems (CHI ’17). ACM, New York, NY, USA, 6889–6901.DOI:
http://dx.doi.org/10.1145/3025453.3025869
2. Eric P. S. Baumer. 2015. Reflective Informatics : Conceptual Dimensions for Designing Technologies of Reflection. InProceedings of the SIGCHI Conference on Human Factors in Computing Systems (CHI ’15). ACM, New York, NY, USA, 585–594.DOI:
http://dx.doi.org/10.1145/2702123.2702234
3. Eric P. S. Baumer, Vera Khovanskaya, Mark Matthews, Lindsay Reynolds, Victoria Schwanda Sosik, and Geri Gay. 2014. Reviewing reflection: on the use of reflection in interactive system design. InProceedings of the ACM Conference on Designing Interactive Systems (DIS ’14). ACM, New York, NY, USA, 93–102.DOI:
http://dx.doi.org/10.1145/2598510.2598598
4. Richard E. Boyatzis. 1998.Transforming qualitative information: Thematic analysis and code development. Sage Publications.
5. Stuart K Card, Jock D Mackinlay, and Ben Shneiderman. 1999.Readings in information visualization: using vision to think. Morgan Kaufmann.
6. Scott Carter and Jennifer Mankoff. 2005. When participants do the capturing: the role of media in diary studies. InProceedings of the SIGCHI conference on Human factors in computing systems (CHI ’05). ACM, ACM, New York, NY, USA, 899–908.
7. Eun Kyoung Choe, Saeed Abdullah, Mashfiqui Rabbi, Edison Thomaz, Daniel A Epstein, Felicia Cordeiro, Matthew Kay, Gregory D Abowd, Tanzeem Choudhury, James Fogarty, and others. 2017. Semi-automated tracking: A balanced approach for self-monitoring applications.IEEE Pervasive Computing16, 1 (2017), 74–84.
8. Eun Kyoung Choe, Bongshin Lee, and M. C. Schraefel. 2015. Characterizing Visualization Insights from Quantified Selfers’ Personal Data Presentations.IEEE Computer Graphics and Applications35, 4 (2015), 28–37.DOI:http://dx.doi.org/10.1109/MCG.2015.51
9. Eun Kyoung Choe, Bongshin Lee, Haining Zhu, Nathalie Henry Riche, and Dominikus Baur. 2017. Understanding Self - Reflection : How People Reflect on Personal Data Through Visual Data Exploration. In Proceedings of EAI International Conference on Pervasive Computing Technologies for Healthcare.
10. Eun Kyoung Choe, Nicole B Lee, Bongshin Lee, Wanda Pratt, and Julie a Kientz. 2014. Understanding
Quantified-Selfers’ Practices in Collecting and Exploring Personal Data. InProceedings of the SIGCHI Conference
on Human Factors in Computing Systems (CHI ’14). ACM, New York, NY, USA, 1143–1152.DOI: http://dx.doi.org/10.1145/2556288.2557372
11. Juliet M. Corbin and Anselm L. Strauss. 1998. Basics of qualitative research: techniques and procedures for developing grounded theory. (1998).
12. Felicia Cordeiro, Daniel A. Epstein, Edison Thomaz, Elizabeth Bales, Arvind K. Jagannathan, Gregory D. Abowd, and James Fogarty. 2015. Barriers and Negative Nudges: Exploring Challenges in Food Journaling. In Proceedings of the SIGCHI Conference on Human Factors in Computing Systems (CHI ’15). ACM, New York, NY, USA, 1159–1162.DOI:
http://dx.doi.org/10.1145/2702123.2702155
13. Anna L. Cox, Jon Bird, and Rowanne Fleck. 2013. Digital Epiphanies: How self-knowledge can change habits and our attitudes towards them.British HCI habits workshop(2013), 1–4.
14. John Dewey. 1910.How We Think. D.C. Heath & Co. Publishers.
15. Pierre Dragicevic and Yvonne Jansen. 2012. List of Physical Visualizations.www.dataphys.org/list. (2012). Last accessed Feb 2015.
16. Jose Duarte. 2014. Handmade Visualization Toolkit.
http://www.handmadevisuals.com/. (2014). Last accessed Sept 2017.
17. Daniel A Epstein, An Ping, James Fogarty, and Sean A Munson. Ubicomp ’15. A lived informatics model of personal informatics. InProceedings of the ACM International Joint Conference on Pervasive and Ubiquitous Computing (Ubicomp 2015). ACM, New York, NY, USA, 731–742.DOI:
http://dx.doi.org/10.1145/2750858.2804250
18. Rowanne Fleck and Geraldine Fitzpatrick. 2010. Reflecting on reflection: Framing a Design Landscape. In Proceedings of the Conference of the Computer-Human Interaction Special Interest Group of Australia on Computer-Human Interaction. 216.DOI:
http://dx.doi.org/10.1145/1952222.1952269
19. Lars Grammel, Melanie Tory, and Margaret-Anne Storey. 2010. How information visualization novices construct visualizations.IEEE transactions on visualization and computer graphics16, 6 (2010), 943–952.
20. Alfred Cort Haddon. 2011.Reports of the Cambridge Anthropological Expedition to Torres Straits: Volume 1, General Ethnography. Vol. 1. Cambridge University Press.
21. Lars Hallnäs and Johan Redström. 2001. Slow technology - Designing for reflection. InProceedings of the ACM
International Joint Conference on Pervasive and Ubiquitous Computing (Ubicomp ’01), Vol. 5. ACM, New York, NY, USA, 201–212.DOI:
22. Dandan Huang, Melanie Tory, Bon Adriel Aseniero, Lyn Bartram, Scott Bateman, Sheelagh Carpendale, Anthony Tang, and Robert Woodbury. 2015. Personal
Visualization and Personal Visual Analytics.IEEE Transactions on Visualization and Computer Graphics21, 3 (2015), 420–433.
23. Michael Hunger. 2008. On LEGO Powered Time-Tracking My Daily Column Better Software Development. http://jexp.de/blog/2008/08/on-lego-powered-time-tracking-my-daily-column/. (2008). Last accessed Sept 2017.
24. Samuel Huron, Sheelagh Carpendale, Jeremy Boy, and Jean-Daniel Fekete. 2016. Using VisKit: A Manual for Running a Constructive Visualization Workshop. InVIS 2016 Workshop on Innovations in the Pedagogy of Data Visualization.
25. Samuel Huron, Sheelagh Carpendale, Alice Thudt, Anthony Tang, and Michael Mauerer. 2014. Constructive visualization. InProceedings of the Conference on Designing interactive systems (DIS ’14). ACM, New York, NY, USA, 433–442.DOI:
http://dx.doi.org/10.1145/2598510.2598566
26. Samuel Huron, Pauline Gourlet, Uta Hinrichs, Trevor Hogan, and Yvonne Jansen. 2017. Let’s Get Physical: Promoting Data Physicalization in Workshop Formats. In Proceedings of the ACM Conference on Designing Interactive Systems (DIS ’17), Vol. 3. ACM, New York, NY, USA, 1409–1422.DOI:
http://dx.doi.org/10.1145/3064663.3064798
27. Yvonne Jansen and Pierre Dragicevic. 2013. An interaction model for visualizations beyond the desktop. IEEE Transactions on Visualization and Computer Graphics19 (2013), 2396–2405.DOI:
http://dx.doi.org/10.1109/TVCG.2013.134
28. Yvonne Jansen, Pierre Dragicevic, Petra Isenberg, Jason Alexander, Abhijit Karnik, Johan Kildal, Sriram Subramanian, and Kasper Hornbæk. 2015. Opportunities and Challenges for Data Physicalization. InProceedings of the SIGCHI Conference on Human Factors in Computing Systems (CHI ’15). ACM, New York, NY, USA, 3227–3236.DOI:
http://dx.doi.org/10.1145/2702123.2702180
29. Elisabeth T Kersten-van Dijk, Joyce HDM Westerink, Femke Beute, and Wijnand A IJsselsteijn. 2017. Personal Informatics, Self-Insight, and Behavior Change: A Critical Review of Current Literature.Human–Computer Interaction(2017), 1–29.
30. Rohit Ashok Khot, Larissa Hjorth, and Florian ’Floyd’ Mueller. 2014. Understanding Physical Activity Through 3D Printed Material Artifacts. InProceedings of the SIGCHI Conference on Human Factors in Computing Systems (CHI ’14). ACM, New York, NY, USA, 3835–3844.DOI:
http://dx.doi.org/10.1145/2556288.2557144
31. David Kirsh. 2010. Thinking with external
representations.Ai & Society25, 4 (2010), 441–454.
32. Ian Li, Anind Dey, and Jodi Forlizzi. 2010. A stage-based model of personal informatics systems. InProceedings of the SIGCHI Conference on Human Factors in Computing Systems (CHI ’10). ACM, New York, NY, USA, 557–566.
DOI:http://dx.doi.org/10.1145/1753326.1753409
33. Ian Li, Anind Dey, and Jodi Forlizzi. 2011. Understanding My Data, Myself: Supporting
Self-Reflection with Ubicomp Technologies.Proceedings of the ACM International Joint Conference on Pervasive and Ubiquitous Computing(2011), 405–414.DOI: http://dx.doi.org/10.1145/2030112.2030166
34. G. Lupi and S. Posavec. 2017.Dear Data Postcard Kit: For Two Friends to Draw and Share. Princeton
Architectural Press.
https://books.google.ca/books?id=kuFaMQAACAAJ
35. G. Lupi, S. Posavec, and M. Popova. 2016.Dear Data. Princeton Architectural Press.
https://books.google.ca/books?id=YorTDAAAQBAJ
36. Paul Marshall. 2007. Do Tangible Interfaces Enhance Learning?. InProceedings of the 1st International Conference on Tangible and Embedded Interaction (TEI ’07). ACM, New York, NY, USA, 163–170.DOI:
http://dx.doi.org/10.1145/1226969.1227004
37. Harvey Mellar and Joan Bliss. 1994. Learning with Artificial Worlds: Computer Based Modelling in the Curriculum. Falmer Press, London, UK, Chapter Introduction: modelling and education, 1–8.
38. Gonzalo Gabriel Méndez, Uta Hinrichs, and Miguel A Nacenta. 2017. Bottom-up vs . Top-down : Trade-offs in Efficiency , Understanding , Freedom and Creativity with InfoVis Tools. InProceedings of the SIGCHI Conference on Human Factors in Computing Systems (CHI ’17). ACM, New York, NY, USA, 841–852.
39. Gonzalo Gabriel Méndez, Miguel A Nacenta, and Sebastien Vandenheste. 2016. iVoLVER: Interactive Visual Language for Visualization Extraction and Reconstruction. InProceedings of the SIGCHI Conference on Human Factors in Computing Systems (CHI ’16). ACM, New York, NY, USA, 4073–4085.DOI: http://dx.doi.org/10.1145/2858036.2858435
40. Bettina Nissen and John Bowers. 2015. Data-Things: Digital Fabrication Situated within Participatory Data Translation Activities. InProceedings of the SIGCHI Conference on Human Factors in Computing Systems (CHI ’15), Vol. 1. ACM, New York, NY, USA, 2467–2476.DOI:
http://dx.doi.org/10.1145/2702123.2702245
42. Donald A Schön. 1984.The reflective practitioner: How professionals think in action. Vol. 5126. Basic books.
43. Cristiano Storni. 2014. Design challenges for ubiquitous and personal computing in chronic disease care and patient empowerment: a case study rethinking diabetes self-monitoring.Personal and Ubiquitous Computing18, 5 (2014), 1277–1290.
44. Simon Stusak, Aurélien Tabard, Franziska Sauka, Rohit Ashok Khot, and Andreas Butz. 2014. Activity sculptures: Exploring the impact of physical
visualizations on running activity.IEEE Transactions on Visualization and Computer Graphics20, 12 (2014), 2201–2210.
45. Saiganesh Swaminathan, Conglei Shi, Yvonne Jansen, Pierre Dragicevic, Lora a. Oehlberg, and Jean-Daniel Fekete. 2014. Supporting the design and fabrication of physical visualizations. InProceedings of the SIGCHI Conference on Human Factors in Computing Systems (CHI ’14). ACM, New York, NY, USA, 3845–3854.DOI: http://dx.doi.org/10.1145/2556288.2557310
46. Alice Thudt, Dominikus Baur, Samuel Huron, and Sheelagh Carpendale. 2016a. Visual mementos: Reflecting memories with personal data.IEEE
transactions on visualization and computer graphics22, 1 (2016), 369–378.
47. Alice Thudt, Bongshin Lee, Eun Kyoung Choe, and Sheelagh Carpendale. 2016b. Expanding Research
Methods for a Realistic Understanding of Personal Visualization.IEEE Computer Graphics And Applications Visualization Viewpoints(2016), 12–18.
48. Jagoda Walny, Samuel Huron, and Sheelagh Carpendale. 2015. An exploratory study of data sketching for visual representation. InComputer Graphics Forum, Vol. 34. Wiley Online Library, 231–240.
49. Mark Whooley, Bernd Ploderer, and Kathleen Gray. 2014. On the Integration of Self-Tracking Data Amongst Quantified Self Members.Proceedings of the
International BCS Human Computer Interaction ConferenceFebruary (2014), 151–160.DOI: http://dx.doi.org/10.14236/ewic/hci2014.16
50. Wesley Willett and Samuel Huron. 2016. A Constructive Classroom Exercise for Teaching InfoVis.VIS 2016 Workshop on Innovations in the Pedagogy of Data Visualization(2016), 1–4.
51. Tiffany Wun, Jennifer Payne, Samuel Huron, and Sheelagh Carpendale. 2016. Comparing bar chart authoring with Microsoft Excel and tangible tiles. In Computer Graphics Forum, Vol. 35. 111–120.
52. Claudia Zaslavsky. 1992. Women as the First Mathematicians.