A COMPREHENSIVE APPROACH TO ENTERPRISE
NETWORK SECURITY MANAGEMENT
by
JOHN HOMER
B.S., Harding University, 2002
M.S., Kansas State University, 2006
AN ABSTRACT OF A DISSERTATION
submitted in partial fulfillment of the
requirements for the degree
DOCTOR OF PHILOSOPHY
Department of Computing and Information Sciences
College of Engineering
KANSAS STATE UNIVERSITY
Manhattan, Kansas
Abstract
Enterprise network security management is a vitally important task, more so now than ever before. Networks grow ever larger and more complex, and corporations, universities, government agencies, etc. rely heavily on the availability of these networks. Security in enterprise networks is constantly threatened by thousands of known software vulnerabilities, with thousands more discovered annually in a wide variety of applications. An overwhelming amount of data is relevant to the ongoing protection of an enterprise network.
Previous works have addressed the identification of vulnerabilities in a given network and the aggregated collection of these vulnerabilities in an attack graph, clearly showing how an attacker might gain access to or control over network resources. These works, however, do little to address how to evaluate or properly utilize this information.
I have developed a comprehensive approach to enterprise network security management. Compared with previous methods, my approach realizes these issues as a uniform desire for provable mitigation of risk within an enterprise network. Attack graph simplification is used to improve user comprehension of the graph data and to enable more efficient use of the data in risk assessment. A sound and effective quantification of risk within the network produces values that can form a basis for valuation policies necessary for the application of a SAT solving technique. SAT solving resolves policy conflicts and produces an optimal reconfiguration, based on the provided values, which can be verified by a knowledgeable human user for accuracy and applicability within the context of the enterprise network. Empirical study shows the effectiveness and efficiency of these approaches, and also indicates promising directions for improvements to be explored in future works. Overall, this research comprises an important step toward a more automated security management initiative.
A COMPREHENSIVE APPROACH TO ENTERPRISE
NETWORK SECURITY MANAGEMENT
by
JOHN HOMER
B.S., Harding University, 2002
M.S., Kansas State University, 2006
A DISSERTATION
submitted in partial fulfillment of the
requirements for the degree
DOCTOR OF PHILOSOPHY
Department of Computing and Information Sciences
College of Engineering
KANSAS STATE UNIVERSITY
Manhattan, Kansas
2009
Approved by:
Major Professor Xinming Ou
Copyright
John Homer
2009
Abstract
Enterprise network security management is a vitally important task, more so now than ever before. Networks grow ever larger and more complex, and corporations, universities, government agencies, etc. rely heavily on the availability of these networks. Security in enterprise networks is constantly threatened by thousands of known software vulnerabilities, with thousands more discovered annually in a wide variety of applications. An overwhelming amount of data is relevant to the ongoing protection of an enterprise network.
Previous works have addressed the identification of vulnerabilities in a given network and the aggregated collection of these vulnerabilities in an attack graph, clearly showing how an attacker might gain access to or control over network resources. These works, however, do little to address how to evaluate or properly utilize this information.
I have developed a comprehensive approach to enterprise network security management. Compared with previous methods, my approach realizes these issues as a uniform desire for provable mitigation of risk within an enterprise network. Attack graph simplification is used to improve user comprehension of the graph data and to enable more efficient use of the data in risk assessment. A sound and effective quantification of risk within the network produces values that can form a basis for valuation policies necessary for the application of a SAT solving technique. SAT solving resolves policy conflicts and produces an optimal reconfiguration, based on the provided values, which can be verified by a knowledgeable human user for accuracy and applicability within the context of the enterprise network. Empirical study shows the effectiveness and efficiency of these approaches, and also indicates promising directions for improvements to be explored in future works. Overall, this research comprises an important step toward a more automated security management initiative.
Table of Contents
Table of Contents vi
List of Figures viii
List of Algorithms ix
List of Tables x
Acknowledgements xi
Dedication xii
1 Introduction 1
1.1 Enterprise Network Security Management . . . 1
1.2 Related Work . . . 5 1.2.1 Attack Graphs . . . 5 1.2.2 Risk Assessment . . . 7 1.2.3 Network Reconfiguration . . . 8 1.3 MulVAL . . . 10 1.4 Original Contributions . . . 13
2 Attack Graph Simplification 17 2.1 An Example . . . 19
2.2 Subnet-Based Trimming . . . 21
2.3 Dominator-Based Trimming . . . 26
2.4 Discussion . . . 32
3 Quantitative Risk Assessment 35 3.1 Component Metrics . . . 36
3.2 Sound Risk Assessment - A First Approach . . . 39
3.3 Sound and Practical Risk Assessment . . . 42
3.3.1 Definitions . . . 43
3.3.2 Example - Figure 3.1 . . . 48
3.3.3 Example - Figure 3.2 . . . 51
3.4 Algorithms . . . 54
3.5 Scalability and Complexity . . . 65
4 SAT Solving Approaches to Context-Aware Enterprise Network Security
Management 73
4.1 An Example . . . 76
4.2 Transforming attack graphs to Boolean formulas . . . 79
4.3 Iterative UnSAT Core Elimination . . . 82
4.3.1 Decision Reduction through Appeal to a Partial Ordering . . . 85
4.4 MinCostSAT . . . 86
4.4.1 User queries . . . 88
4.4.2 Cost Policies . . . 89
4.4.3 Scalability . . . 90
4.5 Discussion . . . 92
4.6 Implementation and Testing . . . 94
4.6.1 Policy Construction . . . 94
4.6.2 Application of Iterative UnSAT Core Elimination . . . 96
4.6.3 Application of MinCostSAT approach . . . 97
5 Open Problems and Future Work 100 5.1 Open Problems . . . 100
5.2 Future Work . . . 102
6 Conclusion 104
Bibliography 112
A Network Models (MulVAL) 113
List of Figures
1.1 Publications of Software Vulnerabilities, Annually . . . 2
1.2 MulVAL Logical Attack Graph Generation . . . 11
1.3 MulVAL Logical Attack Graph . . . 12
1.4 Envisioned Process for Enterprise Network Security Management . . . 16
2.1 Sample Graph - Useless Steps . . . 18
2.2 Energy Management Network . . . 19
2.3 Energy Management Network – Attack Graph . . . 22
2.4 Energy Management Network - Subnet Graph . . . 23
2.5 Energy Management Network - Attack Graph (Inter-subnet Trimming) . . . 25
2.6 Energy Management Network - Attack Graph (Subnet-based Trimming) . . 26
2.7 Sample attack graph (left); simplified representation of same (right) . . . 30
2.8 Graphical dominator tree (left); logical dominator graph (right) . . . 32
2.9 Energy Management Network - Attack Graph (Domination-based Trimming) 33 3.1 Example: Acyclic Attack Graph . . . 44
3.2 Example: Cyclic Attack Graph . . . 52
3.3 Example: Cyclic Attack Graph - Unfolded . . . 52
3.4 Example for Risk Assessment . . . 68
3.5 Example – Attack Graph . . . 69
3.6 Example – Attack Graph - Trimmed . . . 69
3.7 Example – Attack Graph, after vulnerability patched . . . 71
4.1 Small Enterprise Network . . . 76
4.2 Small Enterprise Network – Attack Graph . . . 77
4.3 Attack Graph Representation . . . 78
A.1 Model for example shown in Section 2.1. . . 114
A.2 Model for example shown in Section 3.6. . . 115
List of Algorithms
2.1 Pseudocode for constructing a representative OR-graph . . . 28
2.2 Pseudocode for identifying logical dominance relationships . . . 31
3.1 Pseudocode for full graph unfolding . . . 40
3.2 Pseudocode for risk assessment . . . 55
3.3 Pseudocode for computingevalP rob(N) . . . 57
3.4 Pseudocode for computingevalCondP rob(D, N) . . . 59
3.5 Pseudocode for evalCycle(C) - assessment over nodes in cycle . . . 61
3.6 Pseudocode for traceP aths(n, P, C) - tracing acyclic paths through cycle . . 63
List of Tables
3.1 Values calculated while solving forφ(A4, A5) . . . 50
3.2 Risk assessment calculations for Figure3.1 . . . 51
3.3 Values calculated while solving forφ(P2a, P2b) . . . 54
3.4 Risk assessment calculations for Figure3.2 . . . 54
3.5 Scalability test results - risk assessment . . . 66
3.6 Risk assessment calculations for Figure3.4 . . . 70
3.7 Risk assessment calculations for Figure3.4, lower metric for VPN server . . . 70
3.8 Risk assessment calculations for Figure3.4, after vulnerability patched . . . 71
4.1 Scalability test results - SAT solving . . . 91
Acknowledgments
I would like to express my gratitude to my advisor, Simon Ou, for his continual en-couragement and assistance over the past several years. It was his work that motivated me to venture into the field of enterprise network security analysis and management. I have learned much from his example and I am grateful to have had the opportunity to work closely with him. His patience and perseverance in aiding me along the way have been indispensable in bringing me to this point. I have the deepest respect for Simon, both as a teacher and a researcher, and I look forward to years of continued collaboration with him.
I would like to thank my committee members for their participation in this process and for their comments and suggestions. I am particularly grateful to David Schmidt, whose insight and knowledge have been invaluable.
Finally, I would like to acknowledge the debt owed to everyone who has made my time here memorable - the faculty, staff, and students comprising this department. I am grateful to each professor who has instructed and encouraged me over the past five years, and I hope that I have acquired some measure of their dedication to scholarship. For my friends here, I am grateful for the time we have shared in cooperative academic advancement, as well as the time spent cheerfully avoiding the same.
Dedication
This work is dedicated to my wife, Laura, a woman of steadfast character and breath-taking beauty. I could not have done this without her.
Chapter 1
Introduction
1.1
Enterprise Network Security Management
Enterprise network security management is an undertaking of paramount importance in the world today. Corporations, universities, schools and government depend on the availability and functionality of these networks for communication, data storage and retrieval, and many other day-to-day activities and responsibilities. Enterprise networks continue to grow in both size and complexity, as increasingly more tasks are automated and more information is stored and made available through the network. With this increase, concerns for network security continue to grow. Network security management has generally become an ever-changing, never completed chore.
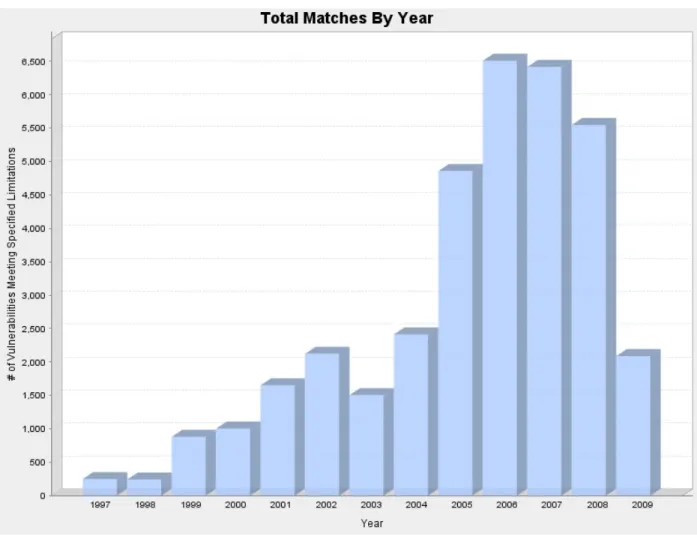
Security risks exist in almost every enterprise network, often undetected or unknown to those assigned to maintain it. Vulnerabilities are regularly discovered in almost every software application. Figure 1.1 charts the discovery of software flaws, grouped by the year published. The number of vulnerabilities “published” (or discovered and made known to the public) increased dramatically several years ago and has remained consistently high. Extrapolating from the number of publications published as of April 2009, a comparably high number of vulnerabilities will be published in 2009. This trend seems likely to continue, with a large and increasing number of vulnerabilities discovered and published in each ensuing year.
Figure 1.1: Publications of Software Vulnerabilities, Annually
[Source: http: // web. nvd. nist. gov]
In a typical enterprise network, it is not merely the newly-published vulnerabilities that are a cause of concern. Vulnerabilities discovered several years ago may still persist, due to negligent patching protocols or even a lack of available patches. However, even keen atten-tion to reviewing and maintaining enterprise network security cannot guarantee a freedom from security flaws or loopholes. The sheer number of notifications, vulnerability publica-tions, and patches to be sifted and considered ensures that no human administrator can possibly be always and continuously aware of all the possible dangers and weaknesses in any given network configuration. Even a moderately-sized network can have many different attack paths which an attacker could exploit to gain unauthorized network access.
To make the issue more complicated, expectations and requirements for network us-ability are often in direct conflict with those of security. Enterprise network configuration management necessitates a careful balancing of these two interests. Without concern for usability, for example, security management becomes a trivial problem, resolvable by simply shutting down the network. This is clearly an untenable solution in almost any situation. Each enterprise network exists for a specific purpose, providing a means by which some group of intended users can perform certain tasks. Eliminating all threats to the security of the network will most likely interfere with this intended functionality. For this reason, even diligent security management rarely achieves zero vulnerabilities. Instead, security manage-ment must seek to mitigate risk within the network by making configuration changes in a context-aware manner.
Currently, the evaluation and management of security risks in an enterprise network is more an art than a science. System administrators operate by instinct and learned experience, often without any objective evaluation of their decisions or full knowledge of all ramifications of any changes. Even the most experienced administrator can accidentally introduce new vulnerabilities while trying to correct known issues. This dependence on human involvement practically guarantees security risks in almost any network.
Even assuming that a system administrator is aware of all current vulnerabilities in the enterprise network, there is currently no sound and quantitative measurement of risk within the network. Lacking such measurement, there is no reliable way to answer pertinent ques-tions such as, “Where is our network most vulnerable?” and “If I change this configuration setting, will our network be more or less secure as a result?” Other individuals, lacking the experience of the administrator, have no verification that the administrator’s intuition is correct. These questions require a quantitative model of security with clear measurement of risk and easy comparison of different network configurations.
Ideally, an administrator will be able to make proactive decisions toward better network security. A reliable quantification of risk together with structural knowledge about the
network provides the necessary foundation for these decisions. Even with full availability of this information, however, the problem remains non-trivial The complex interactions between settings and vulnerabilities form a difficult problem in seeking a solution that maintains essential network usability while reducing security risk.
It is clear, then, that enterprise network security management is a difficult and often unmanageable concern. I believe, however, that this issue can be trouble can be diminished. This dissertation addresses several key aspects of enterprise network security management, providing solutions for each and showing how they can be jointly applied.
1. Attack graph simplification. I will show the benefits attainable by reducing the amount of data included in the attack graph in two distinct techniques for attack graph trim-ming. By these techniques, (1) vital data can be made more clearly known to a human user and, (2) invalid or unusable data can be safely removed.
2. Sound quantification of risk. Without a reliable measurement of existing risk in the network, security management cannot move beyond decisions based on guesses and estimates. A provable calculation of security risk forms a necessary basis for sta-ble decisions. I will present such an approach and demonstrate its effectiveness and applicability.
3. Automated, optimal nework reconfiguration. An optimal network configuration is the central desire in security management. I will show how two SAT solving techniques -MinCostSAT and UnSAT core - can be used to generate suggestions for network con-figuration changes to mitigage security concerns while sustaining the core functionality of the network.
These research aims represent different facets of a single goal - a comprehensive approach to enterprise network security management. Attack graph simplification provides for the hu-man user an intuitive understanding of key security issues. Risk assessment produces sound measurement of the probability that any given attack can be successfully executed within
the network. These assessment values can be used as the basis for a security cost policy. Together with a parallel usability cost policy, SAT solving techniques can be used to con-struct a “best case” network configuration, considering and balancing the often conflicting desires for security and usability. Together, these research advances constitute a significant step toward greater automation and reliability in enterprise network management.
This development is important because it alleviates a human user’s burden of searching for the best way to configure a system given a large number of complex security and usability constraints. Since configuration management is such an important and complex problem, it is unlikely that an automatic tool can take over a human system administrator’s role overnight. Rather, I envision an incremental process whereby automated tools can assist a human user to manage an enterprise network, increasing the degree of automation as the tool is trained.
1.2
Related Work
1.2.1
Attack Graphs
Vulnerability analysis and attack graph generation have been well studied [2, 9, 10, 17,18,
21,23,24,39–41,43,44,49–51,53]. Tools have been developed to identify and report known vulnerabilities in running software versions, firewall policies, and other system settings. Attack graphs provide a visual representation of potential attack paths employing these vulnerabilities that could be followed to exploit system resources.
An early technique, developed by Phillips and Swiler [43, 51], created attack graphs in which nodes represent network states and arcs represent possible state transitions. Sheyner,
et al. produced similar graphs by applying an approach based on symolic model checking [49,
50] These attack graphs, often calledstate enumeration graphs [37], included every possible system state attainable by an attacker moving through the network. Despite proposed techniques for reducing the overall size, these graphs suffered a fatal flaw in the exponential growth in size [2,49].
To conquer this problem, a new approach was developed by Amman, et al.[2] based on the principle of monotonicity in attack steps,i.e., a privilege once acquired by an attacker will not subsequently be forfeited in the acquisition of any additional privileges. Utilizing this principle, the same data contained in state enumeration graphs can be represented in dependency attack graphs with individual settings and privileges as vertices, rather than entire network states. In this type of approach, a graph vertex represents a system condition in some form of logical sentence, with graph edges representing causal relations between these system conditions. Various models of dependency attack graphs have since been developed, comparable in their approach and semantics but distinct in their presentation of the attack graph data. Beyond Amman’s work, the different types of dependency attack graphs include the exploit dependency graph [37, 38], the multiple prerequisite graph [17], and the logical attack graph [40]. The MulVAL analysis engine and logical attack graph toolkit will be presented in more detail in Section 1.3.
More recent works have introduced improvements in the visualization of attack paths and the overall presentation of attack graph data. Lippman, et al.introduced thepredictive attack graph to better display all hosts that can be comprised from a given starting location and to quickly (without rebuilding the graph) show the effects of patching or correcting existing vulnerabilities [24]. Noel, et al. suggested that complexity can be reduced through the use of protection domains to represent groups of machines with unrestricted intercon-nectivity [36, 37]. Lippmann, et al. proposed new visualization approaches to emphasize critical attack steps while clearly showing host-to-host reachability [58]. My work benefits from and builds upon results shown in most previous attack graph simplification works. My contribution is the use of attack graph trimming for specific purposes, such as improved data accessibility for human viewers or sound reductions for more efficient automated cal-culations.
1.2.2
Risk Assessment
The issue of security metrics has attracted much attention [20, 28, 29], and recent years have seen significant effort toward the development of quantitative security metrics [1,4,7,
26,35,42, 45]. Recent years have also seen effort on computing various metrics from attack graphs [12, 47, 54, 56, 57, 59]. My work builds upon results from some of these previous works and is unique in that it accurately accounts for both cyclic and shared dependencies in attack graphs.
Frigault, et al. [11,12] utilizes the combination of attack graphs and Bayesian Network (BN) in measuring network security. Bayesian networks are well studied and many reliable, efficient implementations are commonly available for use; this allows an approach in which the BN is treated as a “black box” to assess network risk based on an input attack graph. Bayesian networks should satisfactorily account for shared dependencies between graph nodes, but BNs utilize directed acyclic graphs as input. This reliance on acyclic graphs is a key limitation, since cycles are quite common in attack graphs. My approach does not rely on Bayesian networks. Instead, I harness the key concept of d-separation in probabilistic reasoning (an underpinning of BN inference reasoning) and design customized algorithms for reasoning over attack graphs data sets. My algorithms correctly handle both shared dependencies and graph cycles, and also take into consideration several instrinsic properties of vulnerability assessment in attack graphs (e.g. that no real-time evidences need to be considered, the monotonicity property, etc.). In this way, I am able to eliminate some unnecessary overhead and complexity that would be present in a generic Bayesian network inference engine.
Wang, et al. [54] recognizes the presence of cycles in an attack graph and attempt to account for the presence of the cycle to ensure that only unique, acyclic paths to any given node are considered. However, their probability calculation seems to assume that probabil-ities along multiple paths leading to a node within a cycle are independent, an assumption that cannot generally be made within attack graphs. Thus, although their work presents
useful techniques for propagating probability over cycles, this work as well appears to suffer from an inherent unsoundness. My work correctly assesses probability within an attack graph cycle while still properly considering extra-cyclic shared dependencies, producing a sound result in all instances.
Anwar, et al. [3] introduce an approach to quantitatively assessing security risks for critical infrastructures. The approach captures both static and dynamic properties in the network, contained in network and workflow models. However, the work did not provide a mathematical model to explain what the calculated metrics mean. It is unclear from the work if their approach could be generically applied to real-world problem sets. My risk metric has a clear semantics based entirely upon the likelihood an attacker can succeed in achieving a privilege or carrying out an attack. Furthermore, I provide a sound relationship between the input component metrics and the cumulative metrics produced by the algorithm.
Sawilla and Ou [47] design an extended Google PageRank algorithm and apply it to attack graphs to calculate numeric ranks for the graph nodes in terms of their importance for an attacker to achieve his supposed goals. Mehta et al. also apply Google PageRank on a different type of attack graphs [31]. Numeric values computed from PageRank-like algorithms only indicate relative ranks and cannot be used to quantify absolute security risks [46]. My work provides a sound and practical method for quantifying the absolute security risks in an enterprise network. Discrete, absolute values are useful in further analysis of the network configuration and in improvements thereof.
1.2.3
Network Reconfiguration
Narain addressed general configuration management issues with the application of SAT solv-ing techniques [33]. This work presented a framework for dealing with various requirements for connectivity, security, performance, and fault tolerance. The full first-order logic is used to model the specific constraints arising from these requirements. A solution (model) to the first-order formula is then sought using the Alloy1 model-finder, which subsequently converts
the problem to Boolean formulas and utilizes SAT solving techniques. My work is similar, but addresses another important requirement (i.e., robustness against potential attacks). I express the system constraints in a Boolean formula converted from an attack graph. It appears possible that the two approaches could be integrated into a unified framework to address a more complete set of requirements regarding enterprise network configuration management.
Wang, et al. developed a graph search-based method for network hardening [55], with previous work by Noel, et al.[38]. An attacker’s goal is expressed as a propositional formula on the initial conditions through recursive substitution during graph traversal. The formula is then converted into disjunctive normal form (DNF) and is used to identify all possible security hardening options, from which set an optimal solution is chosen. The converted DNF formula can be exponential in the size of the attack graph, as admitted in the paper. My approach is distinct from their work. In my approach, I formulate the reconfiguration issue as a MinCostSAT problem for a Boolean formula with a size linear in the size of the attack graph. I then utilize a modern, well developed SAT solver [25] to identify an optimal solution. My approach should show more efficient performance. Not only will the input formula be smaller in size, but also modern SAT solvers have been shown to be quite successful in efficiently handling large data sets arising from practical problem.s
Dewri, et al. formulates the security hardening problem as amulti-objective optimization
problem [10]. They employ a genetic algorithm (GA) to search for a solution, using the cost for security hardening measures and the cost for potential damage (from successful attacks) as two objectives in the multi-objective optimization problem. My approach differs in my adaption of the security hardening issue to a MinCostSAT problem, allowing the application of MinCostSAT solving to find a provably minimum-cost (optimal) solution for the given network model. Genetics algorithms, however, cannot guarantee convergence to a solution that is globally optimal. Furthermore, MinCostSAT is a specific optimization problem that has been extensively studied and so is likely to prove more efficient than a general
optimization algorithm, such as GA, when the problem can be tailored to fit the expected structure, as is the case here. Adopting the SAT solving approach also allows the user to query against the results in addition to simply identifying the optimal reconfiguration solution. The benefit of multi-objective optimization is that a user can be presented multiple “optimal” trade-offs between the two objectives. It would be interesting to study whether the MinCostSAT techniques presented here can be extended to provide multiple trade-off solutions for the optimization problem.
1.3
MulVAL
MulVAL is a security analysis tool for automatically recognizing security vulnerabilities and multistage attacks that can potentially lead to exploitation of network resources [39]. The MulVAL attack graph toolkit uses this gathered data for the generation of a logical dependency attack graph [40]. My research and corresponding implementation utilize the MulVAL analysis engine and attack graph toolkit, although it easily could be applied to other attack graph models with similar semantics.
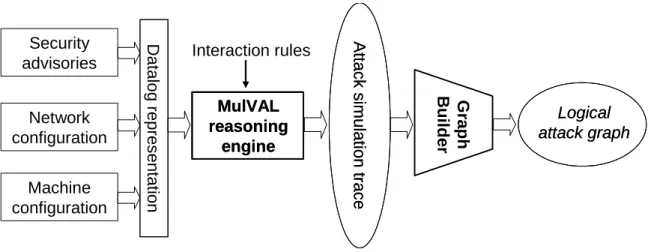
MulVAL’s reasoning engine is declaratively specified in Datalog [6], a syntactic subset of the Prolog logic programming language. In MulVAL, a network model is constructed based on a security scan of the network, in which configuration settings such as host ma-chines, active services, inter-host reachability permissions, etc. are represented as Datalog tuples. Known vulnerabilities are extracted from a database (e.g.,the National Vulnerability Database) and also represented as Datalog tuples. The network model and vulnerabilities data are employed as input for the analysis engine. By applying a collection of Datalog rules representing various attack techniques, MulVAL can identify and show how multi-host, mul-tistage attacks can potentially enable successful attacks into the enterprise network toward a specified privilege (assumed to be the attacker’s goal). The Datalog implementation guar-antees inherent soundness of results as well as an efficient O(N2) running-time [40].
Mul-D a ta lo g re p re s e n ta tio n Machine configuration Network configuration Security advisories MulVAL reasoning engine MulVAL reasoning engine A tta ck si m u la tio n tr a ce A tta ck si m u la tio n tr a ce G ra p h B u ild e r Interaction rules Logical attack graph Logical attack graph
Figure 1.2: MulVAL Logical Attack Graph Generation
VAL creates a logical attack graph, essentially a proof graph of the logical derivation to the goal. The workflow for creating a MulVAL attack graph is shown in Figure 1.2.
The MulVAL logical attack graph can be defined G= (GD, GC, GF, GE, GL, GG), where
GD, GC, and GF are three sets of disjoint nodes in the attack graph, so that the set
of all graph nodes GN =GD∪GC ∪GF =GN; the set of directed arcs in the graph is
GE ⊂ ((GF ∪GD)×GC)∪(GC ×GD)); GL is a mapping from a node to its label; and,
GG ∈GD is the attacker’s goal [40].
GC is the set of attack-step nodes, representing rules defining the means by which an
attacker can gain privileges within the network. These nodes are conjunctive, or logical AND-nodes, meaning that for each node in GC, in order for that node to be true, all of its
immediate graphical predecessors (preconditions) must be true.
GD is the set ofprivilege nodes, representing privileges within the network. These nodes
are disjunctive, or logical OR-nodes, meaning that for each node in GD, in order for that
node to be true, at least one of its predecessors must be true.
GF is the set of configuration nodes, representing facts about the current network
con-figuration, such as inter-host reachability permissions, active software services, and other network settings. These nodes are source nodes in the graph, representing facts known to be true, and so do not have any predecessors.
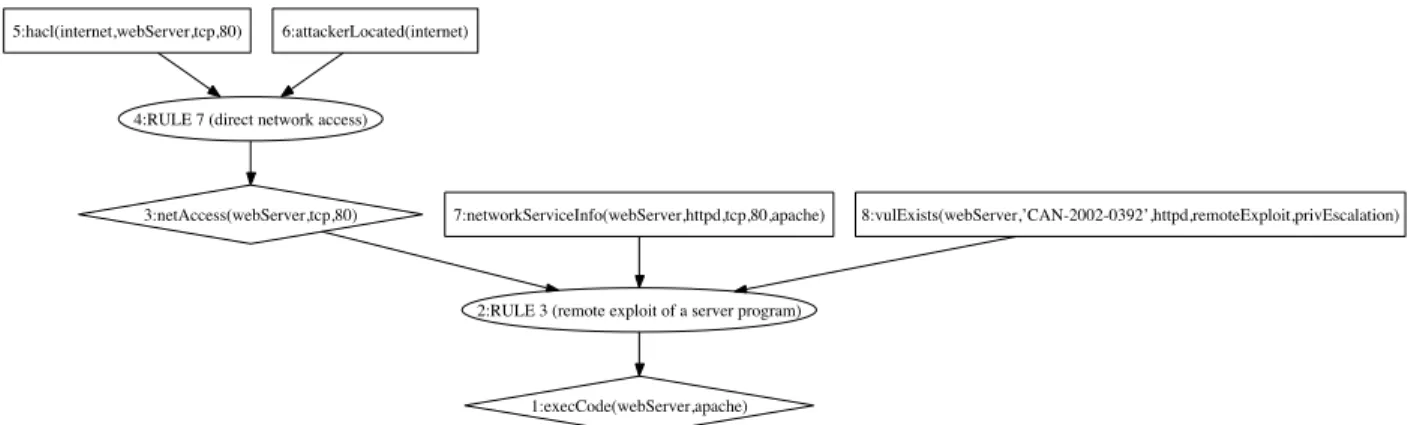
1:execCode(webServer,apache) 2:RULE 3 (remote exploit of a server program) 3:netAccess(webServer,tcp,80)
4:RULE 7 (direct network access) 5:hacl(internet,webServer,tcp,80) 6:attackerLocated(internet)
7:networkServiceInfo(webServer,httpd,tcp,80,apache) 8:vulExists(webServer,’CAN-2002-0392’,httpd,remoteExploit,privEscalation)
Figure 1.3: MulVAL Logical Attack Graph
GE is the set of directed arcs (or edges) in the graph. Within the structure of a
well-formed MulVAL attack graph, arcs indicate a causal relationship between nodes; an arc
a → b indicates that a fully or partially enables b. For any node n, the set of immediate predecessors is{p|(p, n)∈GE}. Attack-step nodes will have only privilege or configuration
nodes as immediate predecessors; each of these predecessors represents a prerequisite condi-tion necessary for the success of the represented attack step. Each attack-step node will have exactly one immediate successor, a privilege node. Privilege nodes will have only attack-step nodes as immediate predecessors; each of these predecessors represents an attack attack-step whose execution gain an attacker the represented privilege. Each privilege node will have one or more immediate successors, except possibly the goal node GG, which may not have
any successors. Configuration nodes will never have predecessors, but each configuration node will have one or more immediate successors.
A sample attack graph is shown in Figure1.3. In this graph, nodes 5-8 are configuration nodes, representing facts about the current system configuration; nodes 4 and 2 are attack-step nodes, showing how new privileges can be obtained by an attacker; nodes 3 and 1 are privilege nodes, representing network privileges obtainable by an attacker. For example, node 2 indicates that an attacker with network access to the web server (node 3), relying on this privilege and an existing vulnerability (node 8) on an active service on the web server (node 7), can obtain code-execution privileges on the web server (node 1).
An attack path is a minimal set of nodes and arcs that together show how a graph node can be reached. The set of all attack paths within the graph G isGP and the set of paths
leading to some node n is GP[n]⊆GP. An attack path is defined to be minimal, such that
the same node cannot be reached by using only a proper subset of the nodes in the attack path. Please note that, because of the conjunctive attack-step nodes in the MulVAL attack graph, a more correct term would be “attack subgraph;” however, I will use the more widely recognized term “attack path.” In Figure1.3, because of the small size of the example, there is only one attack path showing how an attacker can gain privileges on the web server. This path contains all nodes in the attack graph.
1.4
Original Contributions
In this dissertation, I propose several approaches addressing various facets of enterprise net-work security management. Together, these approaches constitute a significant step toward automated management of enterprise network configuration with appropriate considerations of risk and security. I have utilized the MulVAL analysis engine and attack graph toolkit [40] in the development of this work, but my research could easily be applied to any attack graph model with comparable semantics. My contributions are the following:
1. I have proposed two approaches for reduction of attack graph data. The first approach identifies and removes any nodes and edges not contained in a straightforward path to the goal node(s). The second approach identifies and removes all provably unusable nodes and edges in the attack graph. These approaches are important because the balance between security and usability currently necessitates subjective judgment and a human needs to be involved in reaching the final decision. Without a clear under-standing of the existing security problems, it is difficult for a human user to evaluate the proposed configuration changes and provide appropriate guidance.
2. Attack graphs illustrate the cumulative effect of attack steps, showing how individual steps can potentially enable an attacker to gain privileges deep within the network. The limitation of attack graphs, however, is the assumption that a vulnerability that exists can or will be exploited. In reality, there may be a wide range of probabilities that different attack steps could be profitably exploited by an attacker, dependent on the skill of the attacker and the difficulty of the exploit. Some published vulnera-bilities, for example, have no known exploit or require specialized system knowledge unavailable outside of the enterprise network, and so these are unlikely to be used by an attacker. On the other hand, some vulnerabilities have widely known and easily available exploits, so that these vulnerabilities may be more likely to be utilized by an attacker. An attack graphs show what is possible without any indication of what is likely. I have defined and implemented an algorithm for a sound and effective quan-tification of risk in the enterprise network, employing individual component metrics (e.g., CVSS) and attack graph data. The values produced by this algorithm reflect the likelihood that privileges will be obtained by an attacker. Furthermore, I have provided formal proof of correctness for this algorithm.
3. Attack graphs are often of unmanageable size. Even a network of moderate size can have dozens of possible attack paths, overwhelming a human user with the amount of information presented. It is not easy for a human to determine from the information in the attack graph which configuration settings should be changed to best address the identified security problems. Without a clear understanding of the existing security problems, it is difficult for a human user to evaluate possible configuration changes and to verify that optimal changes are made. I have proposed an approach that transforms a network configuration problem into a SAT solving problem. Well-founded SAT solving techniques can then be applied to find an optimal reconfiguration solution. Where no satisfying solution exists, this approach utilizes the UnSAT core to present a human user with a minimal set of conflicting clauses, requiring that at least some of
these clauses be relaxed. Where at least one satisfying solution exists, this approach leverages the MinCostSAT [22] technique to find a mitigation solution that is optimal according to the various cost functions provided.
My overall contribution is the development of formal, logic-based approaches where attack graphs from security analysis are used to compute reconfiguration suggestions au-tomatically, taking into account not only security requirements, but also requirements on usability and trade-offs between costs of security hardening, costs of possible damage due to successful attacks, and costs of loss in usability. Each of the pieces identified in the list above are fundamental to this development. The risk assessment valuations can be employed as the basis for cost values in the policies used. The SAT solving approach computes an optimal reconfiguration solution and presents this to the system administrator. The admin-istrator consults trimmed attack graphs to gain an intuitive understanding of the problems present in the network and confirms that the reconfiguration suggested complies with all given policies. Where a suggested reconfiguration seems untenable, the cost policies can be modified to better reflect relative valuations of network resources. As these policies mature over time, they will more immediately provide desirable configurations.
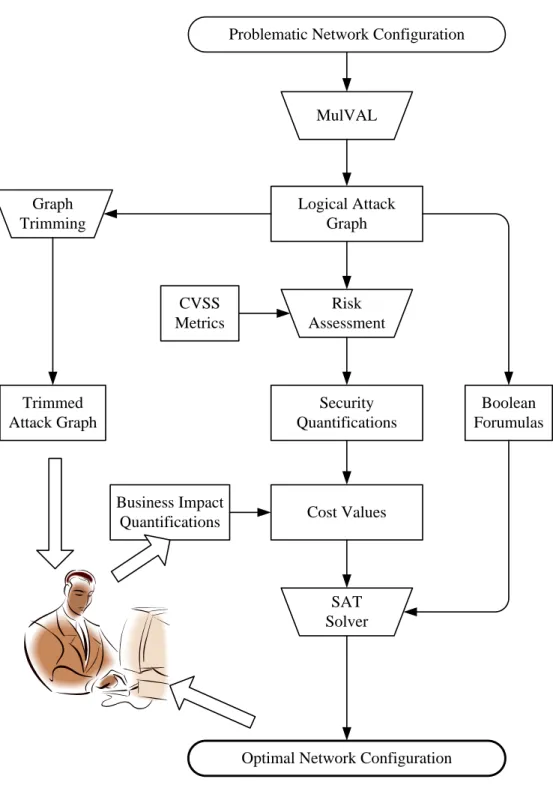
These approaches contribute materially to the realization of a new vision for enterprise network security management, depicted in Figure 1.4.
MulVAL Logical Attack Graph Risk Assessment Security Quantifications Cost Values Business Impact Quantifications Boolean Forumulas SAT Solver Graph Trimming CVSS Metrics Trimmed Attack Graph
Problematic Network Configuration
Optimal Network Configuration
Chapter 2
Attack Graph Simplification
Attack graphs are generated from a representative model of an enterprise network system. The full attack graph includes all relevant data - configuration settings, attack steps po-tentially executed by an attacker, and privileges obtainable by an attacker. Many possible attack paths exist in the graph, each comprising a course of action an attacker might take to achieve the goal privilege. Because the attack graph contains all logically valid data, it is common to find strongly connected components (i.e., cycles) within the graph. Cycles within the graph can be eliminated by removing one or more nodes within the cycle; however, some cycles should not be eliminated in this way, because important data within the attack graph would be lost. Considering this, we may assert that some nodes are less “useful” than other graph nodes, by various possible definitions of “usefulness” or “uselessness”.
Consider the sample graph shown in Figure 2.1. In this simplified graph, the nodes will represent privileges and the edges will represent enabling attack steps allowing attainment of new privileges. An attacker beginning with privilege 1, then, can use this privilege to attain either or both of privileges 2 and 3; an attacker with privilege 3 can attain privileges 2 or 4, and so on. It is easily seen in this example that the transition from privilege 3→2 is not useful in any possible attack path leading to node 4. This attack step might then be identified as “useless” and removed from the graph without any real loss of information.
The immediately obvious solution for identifying these “useless” attack steps is to im-plement a breadth-first search algorithm to compute the distance of machine from the goal
1
1
2
2
3
3
4
4
Figure 2.1: Sample Graph - Useless Steps
node, as measured by the minimum number of attack steps necessary to reach the goal. Node 2 in the above example would have a distance of 2 and node 3 would have a distance of 1. Attack steps that move from a node to another node with the same or greater distance (e.g. 3 → 2) could then be labelled “useless” and trimmed. While this approach would work in some cases, in many cases useful attack paths would be trimmed. For example, this algorithm would also trim the step 1 → 2, and thus lose the complete attack path 1 → 2 → 3 → 4. Actually, only attack paths with the shortest length will be preserved and all other paths will be trimmed. Such an approach might discard valuable information, especially in cases when an attacker might follow a longer attack path due to ease of exploit or better stealthiness along the longer path.
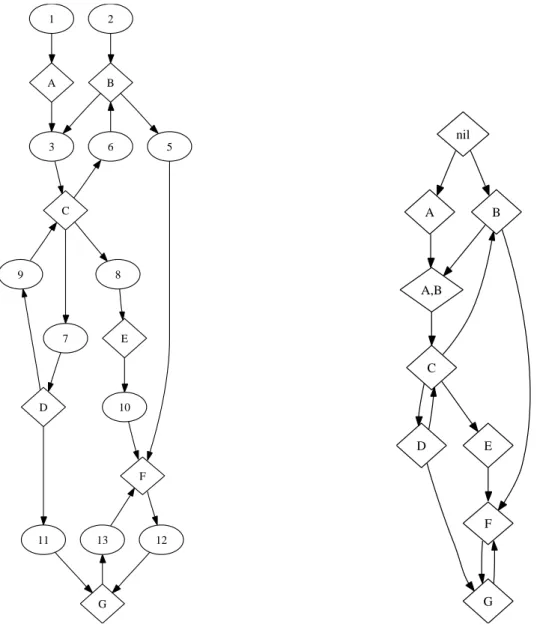
Another solution with initial appeal is to perform a simple depth-first search (DFS) and trim any back edges in the DFS tree. However, depending on the order of traversing a node’s multiple children, either of the transitions 2 → 3 and 3 → 2 might be a back edge in the DFS tree. Only one of these transitions (3→2) can be safely and correctly removed from the graph. Such an approach, then, will work no better than the breadth-first search. In this chapter, I introduce two separate approaches to reducing the amount of data in an attack graph by recognizing and “trimming” (or removing) any nodes and edges that are “useless” by an associated definition. I will then compare the two approaches and discuss how and why each might be profitably employed.
2.1
An Example
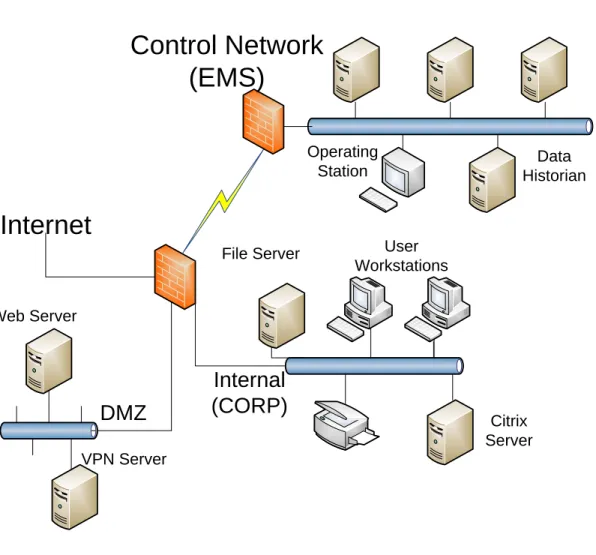
Control Network
(EMS)
Communication Servers
Operating
Station HistorianData
Web Server VPN Server Citrix Server User Workstations File Server
Internet
DMZ
Internal
(CORP)
Figure 2.2: Energy Management Network
Figure 2.1 shows a very simple example of a cyclic graph. Generally, attack graphs are much larger and more complicated, necessitating a standardized and repeatable approach to attack graph simplification. Let us consider, then, the following example. Figure 2.2 shows a sample enterprise network model that is based on a real (and much larger) system. The specific problems encountered when applying attack graph techniques are the same for both the real and the adapted system.
Subnets: There are three subnets in the enterprise system: a DMZ (Demilitarized Zone), an internal subnet, and an EMS (Energy Management System) subnet, which is a
control-system network for power grids.
Hosts: The functionalities of most of the hosts are self-explanatory. One functionality of the EMS network is to gather real-time statistics, such as voltage, load, etc., from the physical power transmission and generation facilities. This information is the basis for generating various control signals to maintain appropriate operation of the power grid, and it is also useful for business transactions such as power brokerage between producers and consumers. The communication servers in the EMS subnet are responsible for communicating with the power grid physical infrastructures. The data historian is a database server that provides the power-grid statistics to be used for the various business/operation purposes.
Accessibility:
Src Dst Network access allowed Internet DMZ all to web server
all to VPN server DMZ internal web server to file server
VPN server to all Internal EMS Citrix server to data historian
The table (above) shows network host accessibility, ignoring outbound access (such as from the Internal subnet to the Internet). Note that the Internet can only directly access the DMZ, and the Citrix server is the only host in the Internal subnet that can access the EMS network, and it can access only the data historian.
Threats: For this kind of system, security of the control system network is of paramount concern, since privileges on those machines could enable an attacker to assume control of physical infrastructures and drive them to a failed state (such as causing the turbine of a power generator to spin at a high speed until self-destruction). A number of mechanisms in this example are in place to reduce such threats as shown in the accessibility table.
Vulnerabilities: There are plenty of vulnerabilities in the system. The data historian runs a proprietary communication protocol with the communication servers that can be very easily compromised. All the machines in the system may have software vulnerabilities in
their various services and software applications. The users of the enterprise network may not be careful to protect their log-in credentials and could leak their user name and password to an attacker through various means, including social engineering. The VPN server in the DMZ can access every machine in the internal subnet. The web server in the DMZ can access the file server through the NFS file-sharing protocol. These vulnerabilities could affect the security of the enterprise network and the control system network.
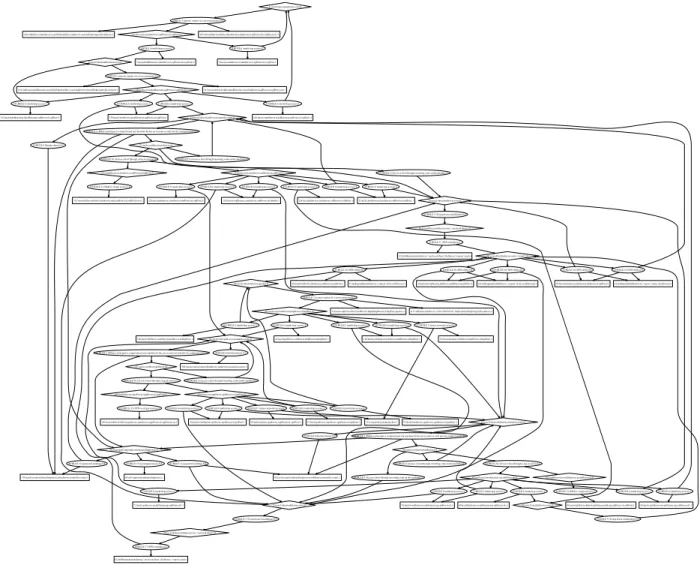
The full MulVAL-generated attack graph for a model of this network is shown in Fig-ure 2.3; the input model used to generate this attack graph is shown in Figure A.1. This attack graph contains 180 edges and 129 nodes, including 25 privilege nodes, 61 attack step nodes, and 43 configuration nodes. The size and complexity of this attack graph obviously makes it very difficult for a human user to comprehend all of the data displayed here.
2.2
Subnet-Based Trimming
This first approach to attack graph data reduction is intended to improve the usability of the attack graph for a human viewer (e.g., a system administrator desiring to better understand existing security vulnerabilities in the network) [16]. Due to the size and complexity of an attack graph, often even for an enterprise network of moderate size, it can be difficult for a human user to quickly inspect and comprehend the attack paths present in the graph. This approach can provide a simplification of the original attack graph, highlighting critical attack steps and paths by removing nodes that provide data of less immediate importance. Reducing the graph in this manner can enable a human user to more quickly recognize the underlying, straightforward attack paths toward the goal privilege and the vulnerabilities enabling these paths.
Definition 1. For subnet-based trimming, a “useless” attack step is defined to be any attack step that will not immediately provide an attacker with additional privilege that, together with already acquired privileges, is necessary for obtaining the goal privilege.
1:execCode(commServer,root):0 2:RULE 3 (remote exploit of a server program):0.2
3:netAccess(commServer,iccpProtocol,iccpPort):0 145:networkServiceInfo(commServer,iccpService,iccpProtocol,iccpPort,root):1 146:vulExists(commServer,iccpVulnerability,iccpService,remoteExploit,privEscalation):1
4:RULE 6 (multi-hop access):1 6:RULE 6 (multi-hop access):1
5:hacl(commServer,commServer,iccpProtocol,iccpPort):1 7:hacl(dataHistorian,commServer,iccpProtocol,iccpPort):1
8:execCode(dataHistorian,root):0 9:RULE 3 (remote exploit of a server program):0.2
10:netAccess(dataHistorian,sqlProtocol,sqlPort):0 143:networkServiceInfo(dataHistorian,oracleSqlServer,sqlProtocol,sqlPort,root):1 144:vulExists(dataHistorian,oracleSqlVulnerability,oracleSqlServer,remoteExploit,privEscalation):1
11:RULE 6 (multi-hop access):1
137:RULE 6 (multi-hop access):1 139:RULE 6 (multi-hop access):1 141:RULE 6 (multi-hop access):1
138:hacl(citrixServer,dataHistorian,sqlProtocol,sqlPort):1 13:execCode(citrixServer,normalAccount):0
14:RULE 0 (Insider threat):0.5
16:RULE 1 (When a principal is compromised any machine he has an account on will also be compromised):0.8
136:hasAccount(ordinaryEmployee,citrixServer,normalAccount):1
17:canAccessHost(citrixServer):0
88:principalCompromised(ordinaryEmployee):0
18:RULE 10 (Access a host through a log-in service):1 134:RULE 9 (Access a host through executing code on the machine):1
135:RULE 9 (Access a host through executing code on the machine):1 19:netAccess(citrixServer,sshProtocol,sshPort):0
131:logInService(citrixServer,sshProtocol,sshPort):0
20:RULE 6 (multi-hop access):1 22:RULE 6 (multi-hop access):1 123:RULE 6 (multi-hop access):1
125:RULE 6 (multi-hop access):1 129:RULE 6 (multi-hop access):1 127:RULE 6 (multi-hop access):1
23:hacl(citrixServer,citrixServer,sshProtocol,sshPort):1 24:execCode(citrixServer,root):0 25:RULE 5 (Trojan horse installation):0.5 26:accessFile(citrixServer,write,’/usr/local/share’):0 27:RULE 17 (NFS semantics):1 28:accessFile(fileServer,write,’/export’):0 122:nfsMounted(citrixServer,’/usr/local/share’,fileServer,’/export’,read):1 29:RULE 18 (NFS shell):0.8 32:RULE 18 (NFS shell):0.8
35:RULE 18 (NFS shell):0.8 116:RULE 18 (NFS shell):0.8 119:RULE 18 (NFS shell):0.8
33:hacl(citrixServer,fileServer,nfsProtocol,nfsPort):1 34:nfsExportInfo(fileServer,’/export’,write,citrixServer):1 36:hacl(webServer,fileServer,nfsProtocol,nfsPort):137:nfsExportInfo(fileServer,’/export’,write,webServer):1
38:execCode(webServer,apache):0
39:RULE 3 (remote exploit of a server program):0.2
40:netAccess(webServer,httpProtocol,httpPort):0 114:networkServiceInfo(webServer,httpd,httpProtocol,httpPort,apache):1115:vulExists(webServer,’CAN-2002-0392’,httpd,remoteExploit,privEscalation):1 41:RULE 6 (multi-hop access):1
105:RULE 6 (multi-hop access):1 109:RULE 6 (multi-hop access):1 107:RULE 6 (multi-hop access):1 111:RULE 7 (direct network access):1 42:hacl(vpnServer,webServer,httpProtocol,httpPort):1
43:execCode(vpnServer,normalAccount):0 44:RULE 0 (Insider threat):0.5 46:RULE 1 (When a principal is compromised any machine he has an account on will also be compromised):0.8
104:hasAccount(ordinaryEmployee,vpnServer,normalAccount):1 47:canAccessHost(vpnServer):0
48:RULE 10 (Access a host through a log-in service):1 103:RULE 9 (Access a host through executing code on the machine):1 49:netAccess(vpnServer,vpnProtocol,vpnPort):0 100:logInService(vpnServer,vpnProtocol,vpnPort):0
50:RULE 6 (multi-hop access):1 52:RULE 6 (multi-hop access):1 54:RULE 6 (multi-hop access):1
95:RULE 6 (multi-hop access):1 97:RULE 7 (direct network access):1
51:hacl(vpnServer,vpnServer,vpnProtocol,vpnPort):1 53:hacl(webServer,vpnServer,vpnProtocol,vpnPort):1
96:hacl(workStation,vpnServer,vpnProtocol,vpnPort):1 56:execCode(workStation,normalAccount):0 57:RULE 0 (Insider threat):0.5 59:RULE 1 (When a principal is compromised any machine he has an account on will also be compromised):0.8
92:hasAccount(ordinaryEmployee,workStation,normalAccount):1
60:canAccessHost(workStation):0
61:RULE 10 (Access a host through a log-in service):1 85:RULE 9 (Access a host through executing code on the machine):1
86:RULE 9 (Access a host through executing code on the machine):1 62:netAccess(workStation,tcp,sshProtocol):0 82:logInService(workStation,tcp,sshProtocol):0
63:RULE 6 (multi-hop access):1 65:RULE 6 (multi-hop access):1 67:RULE 6 (multi-hop access):1
71:RULE 6 (multi-hop access):1 75:RULE 6 (multi-hop access):1 73:RULE 6 (multi-hop access):1
66:hacl(citrixServer,workStation,tcp,sshProtocol):1 68:hacl(fileServer,workStation,tcp,sshProtocol):1 69:execCode(fileServer,root):0
70:RULE 5 (Trojan horse installation):0.5 72:hacl(vpnServer,workStation,tcp,sshProtocol):1 77:execCode(workStation,root):0 76:hacl(workStation,workStation,tcp,sshProtocol):1
78:RULE 5 (Trojan horse installation):0.5 79:accessFile(workStation,write,’/usr/local/share’):0
80:RULE 17 (NFS semantics):1 81:nfsMounted(workStation,’/usr/local/share’,fileServer,’/export’,read):1
83:RULE 14 (SSH is a login service):1 84:networkServiceInfo(workStation,sshd,tcp,sshProtocol,sshPort):1 89:RULE 12 (password sniffing):0.8 93:RULE 13 (incompetent user):0.5 91:RULE 12 (password sniffing):0.8
94:inCompetent(ordinaryEmployee):1
98:hacl(attacker,vpnServer,vpnProtocol,vpnPort):1 113:attackerLocated(attacker):1 101:RULE 15 (VPN is a login service):1
102:networkServiceInfo(vpnServer,vpnService,vpnProtocol,vpnPort,root):1
106:hacl(webServer,webServer,httpProtocol,httpPort):1 110:hacl(workStation,webServer,httpProtocol,httpPort):1 112:hacl(attacker,webServer,httpProtocol,httpPort):1 120:hacl(workStation,fileServer,nfsProtocol,nfsPort):1121:nfsExportInfo(fileServer,’/export’,write,workStation):1 124:hacl(fileServer,citrixServer,sshProtocol,sshPort):1
126:hacl(vpnServer,citrixServer,sshProtocol,sshPort):1 130:hacl(workStation,citrixServer,sshProtocol,sshPort):1 132:RULE 14 (SSH is a login service):1
133:networkServiceInfo(citrixServer,sshd,sshProtocol,sshPort,root):1
140:hacl(commServer,dataHistorian,sqlProtocol,sqlPort):1 142:hacl(dataHistorian,dataHistorian,sqlProtocol,sqlPort):1
Figure 2.3: Energy Management Network – Attack Graph
issues in a given network configuration. While these steps may contain important informa-tion that would be necessary for a user desiring to identify and block every possible attack path, they can be distracting for a human user, drawing attention away from key problems. These “useless” attack steps share a common characteristic, in that they all show how an attacker could move through an enterprise network without penetrating “deeper” into the network (or closer to the goal privilege). In this approach, the classifications “useful” and “useless” are meant to reflect a prioritization of the data contained in the attack graph. It is important to emphasize that the so-called “useless” attack steps are valid and important to consider when determining an appropriate network reconfiguration for greater security.
However, when the user is first presented with the attack graph, understanding these paths is not crucial for understanding overall security threats.
Internet
DMZ
EMS
CORP
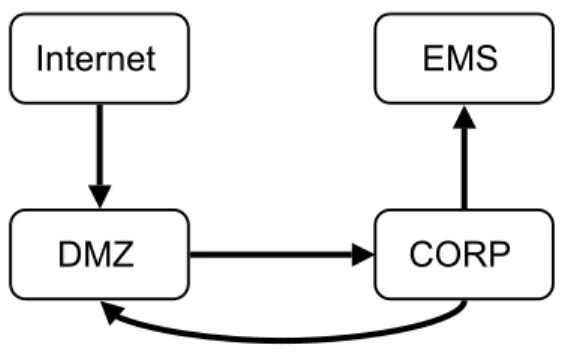
Figure 2.4: Energy Management Network - Subnet Graph
Subnet-based trimming is a two-level approach to identifying and removing “useless” attack steps, separately considering inter-subnet and intra-subnet attack graph edges. In this approach, I assume that within the data model of the enterprise network are identifiable subnets, sets of host machines with unlimited accessibility within the set.
The subnet-based trimming approach first requires the creation of a directed graph of the enterprise network in which the network subnets represented as nodes and the possible inter-subnet transitions as edges. In any case where some host machine in a subnet has reachability permissions to access some host machine in another subnet, an edge between the two subnets will be included in the graph. For example, Figure 2.4 shows the subnet graph derived from the Energy Management Network example depicted in Figure 2.2. Here, the citrix server (in the CORP subnet) has permission to access the data historian (in the EMS subnet), so an edge is added CORP →EMS, and so on.
From this subnet graph, we will then construct a dominator tree to recognize dominance and post-dominance relationships between subnets. For the dominator tree, the source node will be the assumed initial location of the attacker (e.g., the INTERNET subnet) and the sink node will be the subnet that contains the host machine on which the goal privilege resides (e.g., the EMS subnet).
Definition 2. Letd, n be nodes in a directed graph. Noded dominates node n if every path from the source node to n goes through node d. This relationship is denoted “d dom n.”
Definition 3. Letn, p be nodes in a directed graph. Node ppost-dominates node n if every path from n to the sink node goes through p. This relationship is denoted “p postdom n.”
In the subnet graph of Figure 2.4, assuming that INTERNET is the source and EMS is the goal, some examples of dominance relationships are DMZ dom CORP and CORP dom
EMS. We also have EMS postdom CORP and CORP postdom DMZ.
Considering any two subnets X and Y in the subnet graph, we will identify as “useless” all inter-subnet attack steps X → Y where Y dom X or X postdom Y. Intuitively, these are back edges in an attack path. If Y dom X, then an attacker who has gained privileges in subnet X must already have privileges in subnet Y or the attacker would not have been able to transition toX. In this case, moving “back” toY will not enable an attacker to gain new privileges or opportunities. If X postdom Y, then moving from X to Y will not help the attacker either since he would have to return toX in order to reach his goal. Therefore, any transition between two hosts in different subnets that fits one or both of these cases is “useless” and will be trimmed from the attack graph. They are distracting for a human reader trying to comprehend other, more direct attack paths. In the attack graph shown in Figure2.3, every transition from the workstation (in the CORP subnet) to hosts in the DMZ subnet will be trimmed, since DMZ dominates CORP. On the other hand, the transition from the citrix server to the data historian (CORP → EMS) will be retained. The attack graph in Figure 2.5 reflects inter-subnet trimming.
After applying the inter-subnet transition trimming, we then address intra-subnet tran-sitions. An attack step between two machines A → B in the same subnet is retained in only two cases. First, if the subnet contains the goal machine, the transition is retained only if B is the goal. Any other transition within this subnet will be trimmed. In reality, an attacker might need to transition to other machines in the same subnet for the purpose of, e.g., obtaining more computing power. However, these attack steps are not useful for a
1:execCode(commServer,root):0
2:RULE 3 (remote exploit of a server program):0
3:netAccess(commServer,iccpProtocol,iccpPort):0 145:networkServiceInfo(commServer,iccpService,iccpProtocol,iccpPort,root):1 146:vulExists(commServer,iccpVulnerability,iccpService,remoteExploit,privEscalation):1
4:RULE 6 (multi-hop access):0 6:RULE 6 (multi-hop access):0 5:hacl(commServer,commServer,iccpProtocol,iccpPort):17:hacl(dataHistorian,commServer,iccpProtocol,iccpPort):1 8:execCode(dataHistorian,root):0
9:RULE 3 (remote exploit of a server program):0
10:netAccess(dataHistorian,sqlProtocol,sqlPort):0 143:networkServiceInfo(dataHistorian,oracleSqlServer,sqlProtocol,sqlPort,root):1 144:vulExists(dataHistorian,oracleSqlVulnerability,oracleSqlServer,remoteExploit,privEscalation):1
11:RULE 6 (multi-hop access):0 137:RULE 6 (multi-hop access):0 139:RULE 6 (multi-hop access):0 141:RULE 6 (multi-hop access):0
138:hacl(citrixServer,dataHistorian,sqlProtocol,sqlPort):1 13:execCode(citrixServer,normalAccount):0
14:RULE 0 (Insider threat):0 16:RULE 1 (When a principal is compromised any machine he has an account on will also be compromised):0
136:hasAccount(ordinaryEmployee,citrixServer,normalAccount):1 17:canAccessHost(citrixServer):0
88:principalCompromised(ordinaryEmployee):0
18:RULE 10 (Access a host through a log-in service):0 134:RULE 9 (Access a host through executing code on the machine):0 135:RULE 9 (Access a host through executing code on the machine):0
19:netAccess(citrixServer,sshProtocol,sshPort):0 131:logInService(citrixServer,sshProtocol,sshPort):0 20:RULE 6 (multi-hop access):0 22:RULE 6 (multi-hop access):0
123:RULE 6 (multi-hop access):0 127:RULE 6 (multi-hop access):0 129:RULE 6 (multi-hop access):0 125:RULE 6 (multi-hop access):0
23:hacl(citrixServer,citrixServer,sshProtocol,sshPort):1 24:execCode(citrixServer,root):0 25:RULE 5 (Trojan horse installation):0
26:accessFile(citrixServer,write,’/usr/local/share’):0 27:RULE 17 (NFS semantics):0 28:accessFile(fileServer,write,’/export’):0 122:nfsMounted(citrixServer,’/usr/local/share’,fileServer,’/export’,read):1 29:RULE 18 (NFS shell):0 32:RULE 18 (NFS shell):0 35:RULE 18 (NFS shell):0 116:RULE 18 (NFS shell):0 119:RULE 18 (NFS shell):0
33:hacl(citrixServer,fileServer,nfsProtocol,nfsPort):1 34:nfsExportInfo(fileServer,’/export’,write,citrixServer):1 36:hacl(webServer,fileServer,nfsProtocol,nfsPort):137:nfsExportInfo(fileServer,’/export’,write,webServer):1 38:execCode(webServer,apache):0
39:RULE 3 (remote exploit of a server program):0
40:netAccess(webServer,httpProtocol,httpPort):0 114:networkServiceInfo(webServer,httpd,httpProtocol,httpPort,apache):1115:vulExists(webServer,’CAN-2002-0392’,httpd,remoteExploit,privEscalation):1 41:RULE 6 (multi-hop access):0 111:RULE 7 (direct network access):0 105:RULE 6 (multi-hop access):0 42:hacl(vpnServer,webServer,httpProtocol,httpPort):1
43:execCode(vpnServer,normalAccount):0
44:RULE 0 (Insider threat):0 46:RULE 1 (When a principal is compromised any machine he has an account on will also be compromised):0 104:hasAccount(ordinaryEmployee,vpnServer,normalAccount):1 47:canAccessHost(vpnServer):0
48:RULE 10 (Access a host through a log-in service):0 103:RULE 9 (Access a host through executing code on the machine):0
49:netAccess(vpnServer,vpnProtocol,vpnPort):0 100:logInService(vpnServer,vpnProtocol,vpnPort):0
50:RULE 6 (multi-hop access):0 97:RULE 7 (direct network access):0 52:RULE 6 (multi-hop access):0 51:hacl(vpnServer,vpnServer,vpnProtocol,vpnPort):1 53:hacl(webServer,vpnServer,vpnProtocol,vpnPort):1
56:execCode(workStation,normalAccount):0 57:RULE 0 (Insider threat):0 59:RULE 1 (When a principal is compromised any machine he has an account on will also be compromised):0
92:hasAccount(ordinaryEmployee,workStation,normalAccount):1
60:canAccessHost(workStation):0
61:RULE 10 (Access a host through a log-in service):0 85:RULE 9 (Access a host through executing code on the machine):0
86:RULE 9 (Access a host through executing code on the machine):0 62:netAccess(workStation,tcp,sshProtocol):0
82:logInService(workStation,tcp,sshProtocol):0
63:RULE 6 (multi-hop access):0 65:RULE 6 (multi-hop access):0 67:RULE 6 (multi-hop access):0
71:RULE 6 (multi-hop access):0 73:RULE 6 (multi-hop access):0 75:RULE 6 (multi-hop access):0
66:hacl(citrixServer,workStation,tcp,sshProtocol):1 68:hacl(fileServer,workStation,tcp,sshProtocol):1
69:execCode(fileServer,root):0
70:RULE 5 (Trojan horse installation):0 72:hacl(vpnServer,workStation,tcp,sshProtocol):1 76:hacl(workStation,workStation,tcp,sshProtocol):1
77:execCode(workStation,root):0 78:RULE 5 (Trojan horse installation):0
79:accessFile(workStation,write,’/usr/local/share’):0 80:RULE 17 (NFS semantics):0 81:nfsMounted(workStation,’/usr/local/share’,fileServer,’/export’,read):1 83:RULE 14 ():0
84:networkServiceInfo(workStation,sshd,tcp,sshProtocol,sshPort):1
89:RULE 12 (password sniffing):0 91:RULE 12 (password sniffing):0
93:RULE 13 (incompetent user):0 94:inCompetent(ordinaryEmployee):1 98:hacl(attacker,vpnServer,vpnProtocol,vpnPort):1 113:attackerLocated(attacker):1 101:RULE 15 ():0 102:networkServiceInfo(vpnServer,vpnService,vpnProtocol,vpnPort,root):1 106:hacl(webServer,webServer,httpProtocol,httpPort):1 112:hacl(attacker,webServer,httpProtocol,httpPort):1 120:hacl(workStation,fileServer,nfsProtocol,nfsPort):1 121:nfsExportInfo(fileServer,’/export’,write,workStation):1
124:hacl(fileServer,citrixServer,sshProtocol,sshPort):1 130:hacl(workStation,citrixServer,sshProtocol,sshPort):1 126:hacl(vpnServer,citrixServer,sshProtocol,sshPort):1
132:RULE 14 ():0 133:networkServiceInfo(citrixServer,sshd,sshProtocol,sshPort,root):1 140:hacl(commServer,dataHistorian,sqlProtocol,sqlPort):1 142:hacl(dataHistorian,dataHistorian,sqlProtocol,sqlPort):1
Figure 2.5: Energy Management Network - Attack Graph (Inter-subnet Trimming)
human to grasp the core security problem. Second, if the subnet does not contain the goal machine, the transition is useful only if B would provide an attacker with access to another subnet that would be deemed useful according to the subnet dominator tree, and even then only if that same access is not available from A. In the attack graph shown in Figure 2.3, the transition from the file server to the workstation is useless, since the workStation would not provide an attacker with new, useful access; however, the transition from the file server to the citrix server is useful, since, from the citrix server, an attacker could access the EMS subnet.
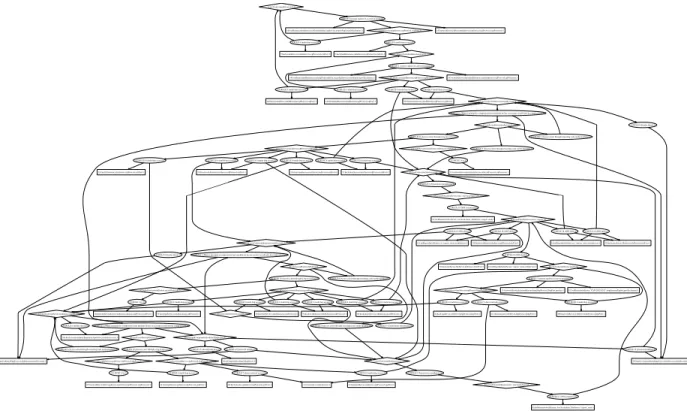
Figure 2.6 shows the resulting attack graph after both inter-subnet and intra-subnet trimming levels are applied to the example presented in Section 2.1. The trimmed attack graph now contains 110 arcs and 90 nodes, including 25 privilege nodes, 39 attack step nodes, and 26 configuration nodes. A total of 70 arcs and 39 nodes have been trimmed from the original attack graph, reducing the size by approximately 35 percent.
1:execCode(commServer,root):0 2:RULE 3 (remote exploit of a server program):0
3:netAccess(commServer,iccpProtocol,iccpPort):0 97:networkServiceInfo(commServer,iccpService,iccpProtocol,iccpPort,root):198:vulExists(commServer,iccpVulnerability,iccpService,remoteExploit,privEscalation):1 4:RULE 6 (multi-hop access):0
5:hacl(dataHistorian,commServer,iccpProtocol,iccpPort):1 6:execCode(dataHistorian,root):0 7:RULE 3 (remote exploit of a server program):0
8:netAccess(dataHistorian,sqlProtocol,sqlPort):0 95:networkServiceInfo(dataHistorian,oracleSqlServer,sqlProtocol,sqlPort,root):196:vulExists(dataHistorian,oracleSqlVulnerability,oracleSqlServer,remoteExploit,privEscalation):1 9:RULE 6 (multi-hop access):0 93:RULE 6 (multi-hop access):0
94:hacl(citrixServer,dataHistorian,sqlProtocol,sqlPort):1 11:execCode(citrixServer,normalAccount):0
12:RULE 0 (Insider threat):0
14:RULE 1 (When a principal is compromised any machine he has an account on will also be compromised):0
92:hasAccount(ordinaryEmployee,citrixServer,normalAccount):1
15:canAccessHost(citrixServer):0
51:principalCompromised(ordinaryEmployee):0
16:RULE 10 (Access a host through a log-in service):0 90:RULE 9 (Access a host through executing code on the machine):0
91:RULE 9 (Access a host through executing code on the machine):0 17:netAccess(citrixServer,sshProtocol,sshPort):0 87:logInService(citrixServer,sshProtocol,sshPort):0
18:RULE 6 (multi-hop access):0 34:RULE 6 (multi-hop access):0 68:RULE 6 (multi-hop access):0 85:RULE 6 (multi-hop access):0
19:hacl(fileServer,citrixServer,sshProtocol,sshPort):1 20:execCode(fileServer,root):0 21:RULE 5 (Trojan horse installation):0
22:accessFile(fileServer,write,’/export’):0 23:RULE 18 (NFS shell):0
24:hacl(webServer,fileServer,nfsProtocol,nfsPort):1 25:nfsExportInfo(fileServer,’/export’,write,webServer):1 26:execCode(webServer,apache):0
27:RULE 3 (remote exploit of a server program):0 28:netAccess(webServer,httpProtocol,httpPort):0 32:networkServiceInfo(webServer,httpd,httpProtocol,httpPort,apache):133:vulExists(webServer,’CAN-2002-0392’,httpd,remoteExploit,privEscalation):1
29:RULE 7 (direct network access):0 30:hacl(attacker,webServer,httpProtocol,httpPort):1 45:attackerLocated(attacker):1
35:hacl(vpnServer,citrixServer,sshProtocol,sshPort):1
36:execCode(vpnServer,normalAccount):0 37:RULE 0 (Insider threat):0 39:RULE 1 (When a principal is compromised any machine he has an account on will also be compromised):0 50:hasAccount(ordinaryEmployee,vpnServer,normalAccount):1 40:canAccessHost(vpnServer):0
41:RULE 10 (Access a host through a log-in service):0 49:RULE 9 (Access a host through executing code on the machine):0 42:netAccess(vpnServer,vpnProtocol,vpnPort):0 46:logInService(vpnServer,vpnProtocol,vpnPort):0
43:RULE 7 (direct network access):0 44:hacl(attacker,vpnServer,vpnProtocol,vpnPort):1
47:RULE 15 ():0 48:networkServiceInfo(vpnServer,vpnService,vpnProtocol,vpnPort,root):1
52:RULE 12 (password sniffing):0 66:RULE 13 (incompetent user):0 59:RULE 12 (password sniffing):0
53:execCode(citrixServer,root):0 54:RULE 5 (Trojan horse installation):0 55:accessFile(citrixServer,write,’/usr/local/share’):0
56:RULE 17 (NFS semantics):0 57:nfsMounted(citrixServer,’/usr/local/share’,fileServer,’/export’,read):1 60:execCode(workStation,root):0
84:hasAccount(ordinaryEmployee,workStation,normalAccount):1
61:RULE 5 (Trojan horse installation):0 62:accessFile(workStation,write,’/usr/local/share’):0 63:RULE 17 (NFS semantics):0 64:nfsMounted(workStation,’/usr/local/share’,fileServer,’/export’,read):1 67:inCompetent(ordinaryEmployee):1 86:hacl(workStation,citrixServer,sshProtocol,sshPort):1 70:execCode(workStation,normalAccount):0
71:RULE 0 (Insider threat):0 73:RULE 1 (When a principal is compromised any machine he has an account on will also be compromised):0 74:canAccessHost(workStation):0
75:RULE 10 (Access a host through a log-in service):0 82:RULE 9 (Access a host through executing code on the machine):0
83:RULE 9 (Access a host through executing code on the machine):0 76:netAccess(workStation,tcp,sshProtocol):0 79:logInService(workStation,tcp,sshProtocol):0
77:RULE 6 (multi-hop access):0 78:hacl(vpnServer,workStation,tcp,sshProtocol):1
80:RULE 14 ():0 81:networkServiceInfo(workStation,sshd,tcp,sshProtocol,sshPort):1
88:RULE 14 ():0
89:networkServiceInfo(citrixServer,sshd,sshProtocol,sshPort,root):1
Figure 2.6: Energy Management Network - Attack Graph (Subnet-based Trimming)
Related works have introduced new visualization techniques for attack graphs [16,37,58]. Many of these techniques could be productively applied to the trimmed attack graph.
2.3
Dominator-Based Trimming
The second approach to attack graph data reduction, dominator-based trimming, employs graph-theoretic analysis techniques to identify provably “useless” nodes and edges within the attack graph. This approach is intended to reduce the amount of data within the attack graph while retaining all usable and productive attack steps. Because attack graphs include all possible attack steps, it is common to find cycles within the attack graph that lead only to privileges already gained, where some nodes within the cycle will need to appear in any attack path.
Definition 4. For domination-based trimming, a “useless” node is defined to be any node within the attack graph that does not appear in an attack path leading to the goal node.
![Figure 2.6: Energy Management Network - Attack Graph (Subnet-based Trimming) Related works have introduced new visualization techniques for attack graphs [16, 37, 58].](https://thumb-us.123doks.com/thumbv2/123dok_us/9019461.2799776/38.918.111.805.91.516/figure-management-network-trimming-related-introduced-visualization-techniques.webp)