ISSN Print: 2327-5219
DOI: 10.4236/jcc.2019.77010 Jul. 10, 2019 95 Journal of Computer and Communications
Research on Gesture Recognition Based on
Improved GBMR Segmentation and Multiple
Feature Fusion
Xianfei Zhu, Weizhong Yan, Dongzhi Chen, Cuicui Gao
R & D Center, Shanghai Aerospace Electronics Co., Ltd., Shanghai, China
Abstract
Aiming at addressing the problem of interactive gesture recognition between lunar robot and astronaut, a novel gesture detection and recognition algo-rithm is proposed. In gesture detection stage, based on saliency detection via Graph-Based Manifold Ranking (GBMR) algorithm, the depth information of foreground is added to the calculation of superpixel. By increasing the weight of connectivity domains in graph theory model, the foreground boundary is highlighted and the impact of background is weakened. In gesture recogni-tion stage, Pyramid Histogram of Oriented Gradient (PHOG) feature and Gabor amplitude also phase feature of image samples are extracted. To high-light the Gabor amplitude feature, we propose a novel feature calculation by fusing feature in different directions at the same scale. Because of the strong classification capability and not-easy-to-fit advantage of Adaboosting, this paper applies it as the classifier to realize gesture recognition. Experimental results show that the improved gesture detection algorithm can maintain the robustness to influences of complex environment. Based on multi-feature fu-sion, the error rate of gesture recognition remains at about 4.2%, and the recognition rate is around 95.8%.
Keywords
GBMR, Depth Information, PHOG Feature, Gabor Feature Fusion, Adaboosting
1. Introduction
In the field of pattern recognition and human-computer interaction, gesture recognition has become one of the research hotspots. For example, when the lu-nar robot performs the space task, based on the accurate gesture semantics
in-How to cite this paper: Zhu, X.F., Yan, W.Z., Chen, D.Z. and Gao, C.C. (2019) Research on Gesture Recognition Based on Improved GBMR Segmentation and Mul-tiple Feature Fusion. Journal of Computer and Communications, 7, 95-104.
https://doi.org/10.4236/jcc.2019.77010
DOI: 10.4236/jcc.2019.77010 96 Journal of Computer and Communications
terpretation, the robot can complete the corresponding motion control.
Many researchers focus on the salient object detection problem for image [1]. However, the complexity of the lunar environment makes the astronaut’s gesture detection and gesture recognition challenging. Due to the number restriction of samples in lunar environment, we choose to test the algorithm in the earth en-vironment firstly.
The initial gesture recognition process mainly use the machinery and typical equipment, such as data gloves, to obtain manual space information. At present, compared with wearable devices, gesture recognition based on computer vision can adapt to the freedom of human action, so based on this, the researchers have put forward a lot of gesture detection and recognition algorithms. As mentioned by T.H. Kim [2], segmenting a single image into multiple coherent groups re-mains a challenging task in the field of computer vision. In this paper, based on gesture detection and recognition part, we classify the algorithms into several categories respectively.
In the gesture detection stage, the state-of-the art algorithm can be divided into two parts: the algorithm based on motion information and the algorithm based on appearance feature extraction. The typical examples in the first one can be listed as the Background Subtraction (BS) method and the Optical Flow (OF) method. BS method needs to obtain the image background in advance, and it is based on the assumption that the color of foreground and background is ob-viously different, so it is susceptible to the influence of external conditions such as illumination change. OF method doesn’t have to obtain the background im-age in advance, but it also requires a relatively constant illumination condition. Methods in the second one are modeled under different color spaces, also sus-ceptible to external conditions and not robust to complex background.
In the recognition stage, we also divide the relative algorithms into two parts: the algorithm based on template matching and the algorithm based on artificial neural network. The prior one is to compare target and the template through learning a large number of samples, and the category judgment is carried out by the similarity measure. The second one is also built on the premise of a large number of learning samples. The complexity of the network structure and num-bers of parameters make it a great challenge for the practical application.
With the increasing popularity of depth camera, because of its color-data and depth-data simultaneous acquisition capability, more and more visual tasks be-gin to use deep acquisition equipment. The fusion of depth-data and color-data can contribute to the feature extraction of samples. Based on these image acqui-sition equipment, by adding depth data, this paper realizes the detection of ges-ture in complex environment.
DOI: 10.4236/jcc.2019.77010 97 Journal of Computer and Communications
of background is weakened. In gesture recognition stage, Pyramid Histogram of Oriented Gradient (PHOG) feature and Gabor amplitude also phase feature of image samples are extracted. To highlight the Gabor amplitude feature, we pro-pose a novel feature calculation by fusing feature in different directions at the same scale. Because of strong classification capability and not-easy-to-fit advan-tage of Adaboosting, this paper applies it as the classifier to realize gesture rec-ognition. The structure flow of algorithm is shown in Figure 1.
2. Gesture Detection in Complex Background
2.1. Saliency Detection Based on Manifold Ranking
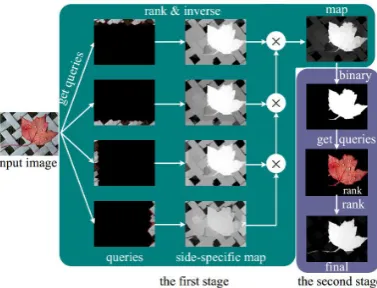
[image:3.595.243.506.311.523.2]The Saliency Detection via Graph-Based Manifold Ranking (GBMR) was pro-posed by Chuan Yang [3]. By constructing a regular graph and establishing query of background seed point based on the boundary, the saliency detection diagram can be built through applying the idea of manifold ranking. The flow of algorithm is shown in Figure 2 [3].
Figure 1. Structure flow of the algorithm.
[image:3.595.277.466.561.705.2]DOI: 10.4236/jcc.2019.77010 98 Journal of Computer and Communications
The GBMR algorithm process can be expressed as follows:
After Superpixel (SP) segmentation process of input image, the K regular graph of single layer image is constructed to establish the relationship between the SP blocks, and MR algorithm is applied to calculate the ranking score be-tween the query point and then on-query point.
Given a dataset X=
{
x x1, , ,2 xn}
∈Rm n× , the algorithm uses vectors torecord the tagging of data. When yi =1, its corresponding xi can be seen as a
query point; when yi =0, its corresponding xi can be seen as equal-marked
data.
Define the ranking function: f : X→Rm which is used to output the cor-responding rank score f =( , , , )f f1 2 fn T for xi.
1) Construct a graph model G=
(
V,E)
based on dataset X, where V is a point set and E is an edge set.2) Calculation of E-based association matrix W =[ ]ωij n n× , where
2
2 ( , )
exp( i j ).
ij
dist x x
ω
σ
= −
3) Calculation of the degree matrix of graph D=diag
(
d d11, 12, , dnn)
. 4) The manifold ranking function is f*=(D−αW)−1y.2.2. Improved GBMR Algorithm
In the case of SP segmentation of input image, if RGB color information is con-sidered only, the gesture segmentation result is not effective when the back-ground is complicated. The incomplete segmentation of target or the segmenta-tion with parts of background will adversely affect subsequent graph theory modeling and ranking algorithm process. In this paper, we consider adding depth information to the SP segmentation so that the target boundary can be highlighted. In the calculation of boundary weights in graph theory model, depth information is also added to weaken the influences of background.
2.2.1. SP Segmentation with Depth Information
In this paper, in the process of implementing SLIC superpixel segmentation [4], we consider adding depth information that can be called D_SP. When the simi-larity measurement of pixel level is carried out, the formula is updated as:
2 2 2
( ) ( ) ( )
c i j i j i j
d = l l− + a a− + b b− (1)
2
( )
s i j
d = D D− (2)
2 2
( ) ( )
xy i j i j
d = x x− + y y− (3)
In the formula, dc represents
(
l a b, ,)
distance measure in the CIELABcolor space of pixels i and j. ds represents the distance measure between depth
pixel values of depth image. dxy represents the spatial coordinates of different
DOI: 10.4236/jcc.2019.77010 99 Journal of Computer and Communications
2 2 2
( c) ( s) ( xy)
Dist= α∗d + β∗d + ∗γ d (4)
In the formula, the parameter α β γ, , represent the balance weight of
, ,
c s xy
d d d respectively. Based on the above distance measurement method, the
boundary of target in the SP segmentation stage is more clear, which can con-tribute to the subsequent mapping model and ranking score algorithm. The re-sult is shown in Figure 3.
2.2.2. Improved Graph Model
In order to make edge weights of nodes greater in the graph model, this paper considers updating the weight calculation as:
2 2
2 2
1 2
( , ) ,
exp( i j ( i j)) ij
dist x x dist D D
ω λ
σ σ
= − − ∗ (5)
where λ and σ are the balance coefficients. The 2( , )
i j
dist x x and 2( , )
i j
dist D D of each sub-block are measured by χ2 distance.
2.3. Experimental Results
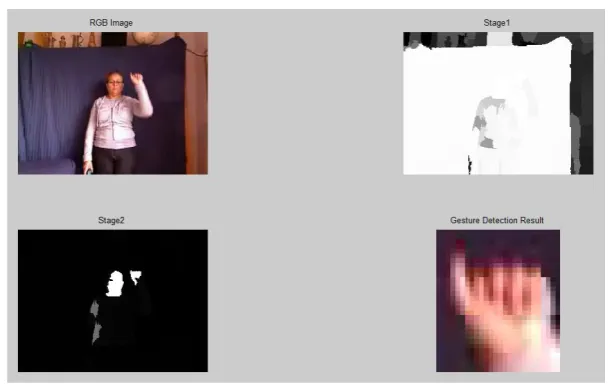
The experimental hardware environment in this paper is Intel Core i3 processor, the main frequency 3.60 GHz. We select the ChaLearn Kinect dataset [5] to va-lidate the algorithm, and the results are as follows Figure 4.
[image:5.595.212.539.381.472.2]
(a) (b) (c)
Figure 3. D_SP segmentation result. (a) RGB Image; (b) Depth Image; (c) D_SP Segmentation.
[image:5.595.220.526.514.706.2]DOI: 10.4236/jcc.2019.77010 100 Journal of Computer and Communications
3. Gesture Recognition of Multi-Feature Fusion
3.1. PHOG Feature
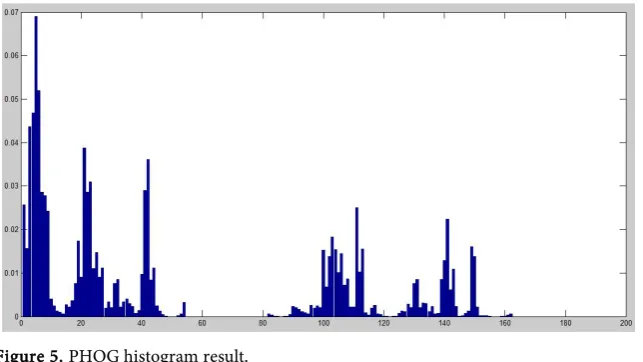
The PHOG feature idea was initially proposed by Anna Boschd [6], calculating the HOG feature at different scales and stitching them eventually. It includes spatial multiscale information, which contains more abundant feature informa-tion than HOG feature. The process of feature extracinforma-tion algorithm is as follows: 1) After segmenting the Region of Interest (ROI) in the input images and RGB image grayscale processing, canny operator is applied to obtain the edge infor-mation of image.
2) Image layering. The first layer focused on the entire input image, labeled as Level = 0. The second layer will be image 2 * 2 separation, labeled as Level = 1. The third layer will image 4 * 4 separation, labeled as Level = 2.
3) Calculate the gradient direction by pixel at each layer. Divide π or 2π angle into several parts, and obtain the statistical histogram to generate the one-dimensional vector (HOG feature).
4) Combine the HOG feature levels of each layer to obtain the PHOG features of the entire image.
In this paper, the example result of PHOG features extraction is shown in Figure 5.
3.2. Gabor Feature
The Gabor feature origins from Gabor transform, which is extended from one-dimensional Gabor filter to two-dimensional image feature extraction. The two-dimensional Gabor kernel function is defined as:
( )
2 2 2 2
, ,
, 2 exp( 2 2 ) (exp( , ) exp( 2))
u v u v
u v u v
k k z
z ik z σ
φ
σ σ
= − ⋅ − − (6)
In the formula, u and v represent the direction and scale of the Gabor nucleus respectively, z=( , )x y represents the coordinates of a given point in the image,
, u v
[image:6.595.214.536.541.722.2]k represents the central frequency of the filter. ku v, on one certain direction and scale can be calculated as:
DOI: 10.4236/jcc.2019.77010 101 Journal of Computer and Communications
, iu
u v v
k =k eφ (7)
In the formula, / v v max
k =k f , v∈{0,1,2,3,4}; 8 u πu
φ = , u∈{0,1,2, ,7} .
If the grayscale value of the input graph is I z( ), the Gabor feature of image is the convolutional result of I z( ) and Gabor kernel function. The result can be expressed as:
, ( ) ( ) , ( )
u v u v
Q z =I z ⊗φ z (8)
In the formula, Q zu v, ( ) represents the feature description of the image I z( ) in the u direction and v scale.
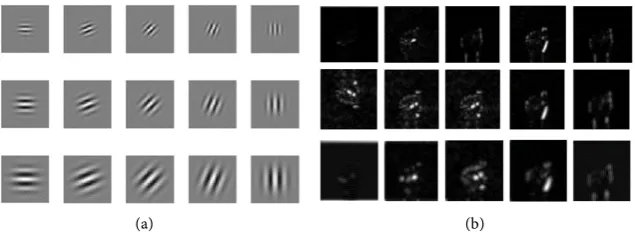
As shown in Figure 6, the graph (a) is a Gabor nucleus with different scales in different directions, and the graph (b) is a Gabor feature result of different scales in different directions for the input image.
3.2.1. Gabor Amplitude Feature Fusion
When extracting the feature data of input image, grayscale processing is firstly implemented. In this paper, the Gabor conversion of image is carried out by 8 directions and 5 scale Gabor filters. If 40 image features are cascade directly, the dimension of feature data will be expanded 40 times. And some data for the de-scription of image will not have much impact on the whole, which results in the redundancy. In this paper, by fusing the feature of Gabor in different directions on the same scale, the dimension is lowered while retaining the valid ones.
Take the maximum value of Gabor feature in different directions on the same scale, that is,
,
( ) max( ( )) {0,1,2, ,7}
v u v
Q z′ = Q z u∈ (9)
In the formula, Q zv′( ) represents the eigenvalues of each v scale with differ-ent directional feature fusion, and z=( , )x y represents the coordinates of a given point in image. The fused feature result is shown in Figure 7.
In order to further reduce the Gabor feature dimension, the Gabor fusion di-agrams of each scale are divided into non-overlapping sub-diagram. The mean and standard deviation of each sub-graph are calculated and recorded as ( , )mγ .
Each sub-graph ( , )mγ are cascade, which constitutes the eigenvectors of the fusion graph. Assuming that the fusion graph of each scale is divided into
[image:7.595.215.533.575.691.2](a) (b)
DOI: 10.4236/jcc.2019.77010 102 Journal of Computer and Communications
(a) (b)
[image:8.595.292.458.66.265.2]
(c) (d)
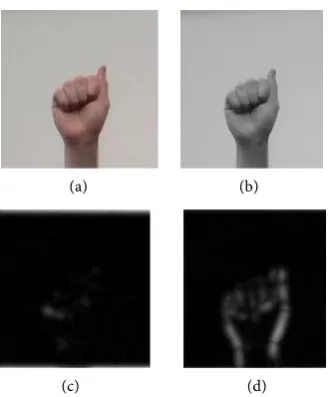
Figure 7. Comparison of Gabor feature result. (a) RGB Image; (b) Grayscale Image; (c) Feature Result before fusion; (d) Feature Result after fusion.
n sub-graph and Gabor scale parameter is set as v, the final Gabor feature di-mension of image to be measured will be 2× ×n v.
3.2.2. Gabor Phase Feature
When the Gabor filter is carried out, the amplitude and phase feature are output. The real part and the imaginary part of the Gabor filter coefficient are obtained by the Quadrant Binary encoding (QBC) for each pixel point. The phase feature is described by Local XOR Pattern (LXP) operator. It is improved by the Local Binary Pattern (LBP) [7]. The main idea is that each pixel point is “XOR” opera-tion with its adjacent pixels. After the binary sequence is output in a certain di-rection, the phase value of the corresponding pixel point will be output by weighted operation.
3.3. Multi-Feature Fusion
After the PHOG feature of image samples and the fused Gabor amplitude fea-ture and phase feafea-ture are obtained, the data can be merged as the final feafea-ture vector output of input image.
3.4. Adaboosting Classifier
DOI: 10.4236/jcc.2019.77010 103 Journal of Computer and Communications
3.5. Experimental Results
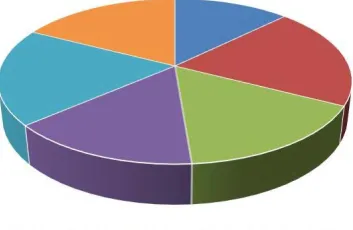
In the experiments, gesture recognition samples are selected from the American Sign Language (ASL) database, with 12210 samples of 6 categories. The number of samples for each category is shown in Figure 8. After obtaining the vector of multi-feature fusion of samples, the Adaboosting classifier is applied for train-ing. The number of weak classifiers is set to 30, and 300 pictures in each category are selected as the test set to obtain the recognition error of the model. As shown in Figure 9, the error of cross-validation results remains below 0.042.
[image:9.595.286.463.227.342.2]The comparison of different algorithms is shown in Figure 10.
[image:9.595.211.538.383.502.2] [image:9.595.210.539.533.711.2]Figure 8. The number of samples for each category.
Figure 9. Result of cross-validation.
DOI: 10.4236/jcc.2019.77010 104 Journal of Computer and Communications
4. Conclusions
In this paper, an improved gesture detection and recognition algorithm is pro-posed, the contributions can be expressed as follows:
1) In gesture detection stage, the GBMR algorithm is improved. The depth information is added to the boundary weight calculation of SP segmentation and graph theory model, highlighting the boundary of target region and weakening background impact.
2) In gesture recognition stage, the Gabor amplitude feature fusion is carried out in different directions on the same scale, highlighting texture information, and the dimension of Gabor amplitude feature are reduced by applying block statistics method.
3) In gesture recognition stage, multi-scale PHOG feature, Gabor amplitude feature fusion and phase feature are integrated, and Adaboosting classifier is ap-plied to realize recognition.
Conflicts of Interest
The authors declare no conflicts of interest regarding the publication of this pa-per.
References
[1] Liu, T., Yuan, Z., Sun, J., Wang, J., Zheng, N., Tang, X. and Shum, H. (2011) Learn-ing to Detect Asalient Object. IEEE PAMI.
[2] Kim, T.H., Lee, K.M. and Lee, S.U. (2010) Learning Full Pairwise Affinities for Spectral Segmentation. CVPR.
[3] Yang, C., Zhang, L., Lu, H., et al. (2013) [IEEE 2013 IEEE Conference on Computer Vision and Pattern Recognition (CVPR)—Portland, OR, USA (2013.06.23- 2013.06.28). 2013 IEEE Conference on Computer Vision and Pattern Recogni-tion—Saliency Detection via Graph-Based Manifold Ranking, 2013, 3166-3173.
https://doi.org/10.1109/cvpr.2013.407
[4] Achanta, R., Smith, K., Lucchi, A., Fua, P. and Susstrunk, S. (2010) SLIC Superpix-els. Technical Report, EPFL, Tech. Rep. 149300.
[5] http://gesture.chalearn.org/
[6] Bosch, A., Zisserman, A. and Munoz, X. () Representing Shape with a Spatial Pyra-mid Kernel. ACM International Conference on Image & Video Retrieval.
https://doi.org/10.1145/1282280.1282340
[7] Gabor, D. (1946) Theory of Communication. Journal of Inst. Electronic Engineer, 93, 429-457.