ISSN Print: 2327-4018
DOI: 10.4236/ojmsi.2019.72007 Apr. 25, 2019 125 Open Journal of Modelling and Simulation
A Control Theoretical Model of Web Service
Value Development
Anthony S. White
1*, Doreen Nielsen
2, Michael Censlive
11School of Science and Technology, Middlesex University, London, UK 2SMS Department, Business School, University of Greenwich, London, UK
Abstract
This paper describes a control theoretical model of collaborative value devel-opment. This model is designed to assist managers in choosing parameters that are critical to the development process in service design and support their Business Model. This methodology uses control system modelling of web-based service value generation implemented in SIMULINK/MATLAB. An application based on public domain Wikipedia data is used to validate and develop the model. A control theoretic model applied to the creation of Wikipedia articles shows very good agreement with Wikipedia published data for the time dependent growth in articles produced, and editors used, well within the variability of parametric data listed publically justifying the princi-ple equations used in the model. This development and fine tuning of the model has been limited by the publically available data. To obtain a more ac-curate model in this area would need the co-operation of web service organi-sations to reveal confidential data. This modelling procedure can produce a decision support process for service design and could, with modification be applied much more widely to other choices in service design/implementation, even allowing for user contribution to be evaluated. This work shows how subjective judgements on value and other intangibles need to be continually re-evaluated. Such methodology has not been applied elsewhere to value gen-eration applications. It could be used to rank contributions from co-creators for reward sharing.
Keywords
Service Value, Control Theoretical Model, Simulink Simulation, Wikipedia Development
1. Introduction
In the past twenty years, many web based companies have been created to allow,
How to cite this paper: White, A.S., Niel-sen, D. and Censlive, M. (2019) A Control Theoretical Model of Web Service Value Development. Open Journal of Modelling and Simulation, 7, 125-147.
https://doi.org/10.4236/ojmsi.2019.72007
Received: March 25, 2019 Accepted: April 22, 2019 Published: April 25, 2019
Copyright © 2019 by author(s) and Scientific Research Publishing Inc. This work is licensed under the Creative Commons Attribution International License (CC BY 4.0).
DOI: 10.4236/ojmsi.2019.72007 126 Open Journal of Modelling and Simulation facilitate and service the large and growing number of customers’ interactions. Successful organisations such as Google and Facebook have several billion active users [1] [2]. Service provision in advanced economies has grown substantially in significance. The resource needs and implications for the developing service need to be predicted. To make an organisation functionally efficient and profit-able, it is critical to be able to predict staff allocations and productivity required for the business model [3] [4] [5] [6] [7]. System Dynamics (SD) models were first used to facilitate these computations [8]. Hajiheydari and Zarei [9] use SD models to inform the Business Model (BM) decision making process, later evaluated by expert opinion. Little or no examination has been made of such businesses in a dynamic sense.
A service economy such as those in the web based environment is seen as dif-ferent from a product dominated economy. Service Science is a branch of Sys-tems Theory [10] which combines engineering with management and social science, provides a theoretical basis for this change in emphasis. In a rapidly changing world, models of the development of services are required, to enable companies and managers to compare their performance with what is possible and practicable. An example is the development of software [11]. These models have been used to estimate the effects of rework as an important component of the total effort needed. The value that a customer sees in the service provided by a business is a key issue in how the company subsequently develops throughout time.
The aim of this paper is to build and evaluate a control engineering based model of value development with external and internal actors. The results of a case study using computer simulation of the model with SIMULINK are then compared to the published development of the Wikipedia web based system to determine the validity of the model.
Gap in the Literature
Current theories of value generation specify the inclusion of the concept of co-creation of value by customers. Use of a large number of co-creators makes managing the complexity of the value generation process much more difficult. The problems of using numbers of co-creators or editors in the Wikipedia envi-ronment have sparked considerable research into the reasons why people con-tribute in this way [12]. Their principle findings are related to motivation and to the problems of conflict. Similar statistical modelling work on motivation of open-source software contributors by Santos et al. [13] has shown that the at-tractiveness of the work is the most important factor and this can limit partici-pation to only a few contributions.
DOI: 10.4236/ojmsi.2019.72007 127 Open Journal of Modelling and Simulation
2. Literature Review
Forrester [14] discusses the lessons from System Dynamics (SD) modelling for business and social applications stating that the purpose of such models is to “organize, clarify and unify knowledge” “of an important system”. To model the collaborative development of a web service, the various actors and users of the system, as well as the underlying dynamics of the system, have to be taken into account. Existing models of web services are explored to see the range of appli-cability and then the current viewpoints in value estimation techniques are cri-tiqued.
2.1. Models of Web Service
Various models of service provision have been made in software development, in mobile telephone provision and, while at IBM, Lee et al. [3] produced a novel control engineering model of staff provision in the service supply chain. Li and Nahrstedt [5] have devised a control theoretical model of task control of service using state-space analysis with digital Proportional Integral and Derivative (PID) control to provide some degree of fairness of resource allocation.
The earliest successful project development models using System Dynamics (SD) in 1964 led by Roberts [15] were followed by Abdel-Hamid and Madnick
[16] in the modelling of the operational processes of software development
showing good agreement with NASA data. Rodrigues and Bowers [6] describe subsequent progress in the modelling of the operation of software projects. Ly-neis and Ford [4] pointed out the dominant effect of rework and how factors such as quality or productivity affect project performance. Rahmandad and Weiss [17] investigated the dynamics of concurrent software development de-fining feedback loops, which dominate inter-project dynamics and tipping points that control the success or failure of projects. Ford [18] highlighted the essential feedback processes arising in all projects, not just software develop-ment. Trammell et al. [19] used SD to evaluate the effects of funding fluctuation on software development.
Models in this area have been devised with the purpose of reducing queues and ensuring rapid response to service challenges as illustrated by Parekh et al.
[20] who used closed loop state-space control of queue length implemented in a Lotus Notes system to control server access. Another approach is typified by Vlietland and Vliet [21] who devised a control system for the procedure of han-dling Information technology (IT) incidents applied to service teams in a large financial institution. Yang et al. [22] have compared simulation models with dif-ferent cost models.
DOI: 10.4236/ojmsi.2019.72007 128 Open Journal of Modelling and Simulation dynamic resource allocation in a service supply chain while Dutta and Sridhar
[26] modelled the growth of cellular phone services in India showing fair agree-ment with subscriber data. Lee et al. [3] devised a control system for workforce management for IBM. Oliva and Sterman [27] claim that in service provision generally, quality and productivity are perceived to have fallen compared to manufacturing, where quality and productivity have increased substantially. Richardson [28] shows how the feedback concept applies to cases of social sci-ence, political systems and business applications. Gilb [29] maintains that in IT development all qualitative statements about service issues can be quantified us-ing “planguage” to enable precise measures to be generated.
In the following section the current state of measurements of service value and their problems are discussed and methods developed to reduce the scale of the measurement problem to produce a model of web development.
2.2. Measurement of Service Value
Service oriented business requires a different perspective for company operation than that of goods oriented business, due to assessment subjectivity, the intangi-bility of the product and the high level of contribution of outside actors in the process. Relationship and services marketing can now be said to be dominated by value proposition [30] [31] [32] [33]. This shift in culture has paved the way for the theory of Service-Dominant-Logic [34] who define value as “benefit, an increaseinthewell-beingofaparticularactor”.
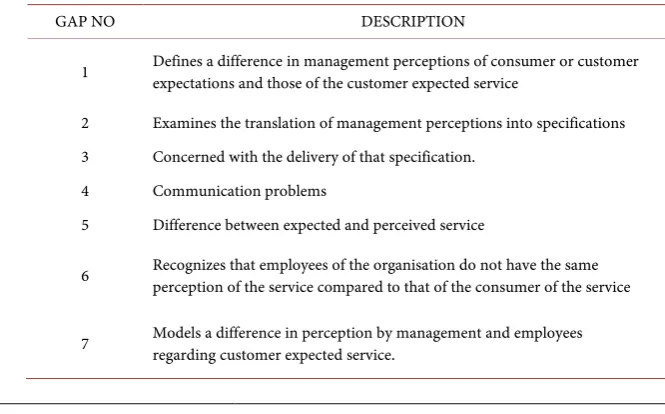
[image:4.595.196.529.536.743.2]To visually assess service interactions, Shahin [35] refined the Service Quality (SERVQUAL) scheme, presented diagrammatically in Figure 1, to show gaps in both services provided and those experienced by recipients. In Figure 1, the fundamental expected service and perceived service are attributes of the con-sumer. The expected service depends on word of mouth communication, per-sonal needs and is modified by past experiences of similar and parallel situa-tions. Table 1 defines the gaps in perception of service. This structure presents
Table 1. Definition of gap function.
GAP NO DESCRIPTION
1 Defines a difference in management perceptions of consumer or customer expectations and those of the customer expected service 2 Examines the translation of management perceptions into specifications 3 Concerned with the delivery of that specification.
4 Communication problems
5 Difference between expected and perceived service
6 Recognizes that employees of the organisation do not have the same perception of the service compared to that of the consumer of the service
DOI: 10.4236/ojmsi.2019.72007 129 Open Journal of Modelling and Simulation
Figure 1. Service quality gap assessment (Adapted from Parasuraman et al.[31]).
the stakeholders’ perception and expectation of service interaction to identify focal areas with service gaps for rectification. SERVQUAL, as originally specified
[31], is a subjective survey, using a seven point Likert scale producing a weighted average score. The SERVQUAL formula does not include any time dependence or lead/lag effects of the assessment process.
Cronin and Taylor [36] suggested an alternative; methodology, SERVPERF, that focuses on actual performance based measurements. The major disagree-ments raised after the introduction of the performance based tests were ad-dressed by Cronin and Taylor [37].
Van Dyke et al.[39] and Van Dyke et al.[40] concluded in their reviews of the SERVQUAL questionnaire with recommendations for a different approach for assessing quality in Information Systems (IS) services. They pointed out that the “conceptual difficulties” of “recognizing the perceived value” as a “gap score”, “the ambiguity of expectations construct”, “the unsuitability of using a single measure across different industries”. Jiang et al.[41] came to similar conclusions for IS service quality.
The analysis from these papers and others does illustrate that using question-naires to measure expectations with other ill-defined properties and opinions is fraught with difficulties. It is unclear that the investigators and clients have the same understanding of a defined parameter.
DOI: 10.4236/ojmsi.2019.72007 130 Open Journal of Modelling and Simulation capabilities applied to service quality gaps are claimed to provide insights for managerial intervention [43].
Landrum et al. [44] explained that the perception of success while using SERVQUAL or SERVPERF is strongly dependant on the occupation of users. Rodrigues et al.[45] found that of the dimensions tested, tangibles and reliability were more important.
A further significant factor is the time interval between when service actions occurred and when the judgement of the service was made. This is not addressed by any of these tools.
McKinney et al. [46] took a different approach to investigating web–customer satisfaction by separating the web-site quality into information quality (IQ) and system quality (SQ), revising the definition of expectation and perceived per-formance with reported success. Jia et al.[47] derived inspiration from the pro-ject models of Abdel-Hamid et al.[7] and proposed a new model of IT service with 4 dimensions to test quality issues relating to goal setting. Whenever a large input from diverse actors occurs, the intrinsic time lags involved soon causes project slippage and severe financial costs as evidenced in the defence and soft-ware industries [48] [49]. It is impossible to implement with the small number of staff who are usually available in the business as evidenced by the current prob-lems at Facebook. As such, the inclusion of a large number of co-creators be-comes not merely desirable but essential. This is an example of the Law of Req-uisite Variety [50]. Exogenous actors working together with staff from service providers inevitably co-create or co-provide service value. Hilton et al. [51] con-trast the idea of value co-creation with service co-creation arguing that value is a personal judgement and so cannot be co-created but that service co-creation is the activity of planned resource integration which is intended to raise value as perceived by the customers.
To summarize; the service quality measurement tools available have been considered to have problems in concept or application. Perceptions of quality expectation can be measured with differing degrees of reliability. There is slightly better evidence to say that performance can be measured but this de-pends on the background of those who are asked for a judgement, so it is not objective.
3. Methodology
System Dynamics was developed from control theory by Forrester [8] in the 1950’s to enable those methods to be applied to non-engineering situations. These SD models use the basic principles that all systems have feedback, both positive and negative and suffer delays in information processing or physical flows.
Control System (CS) models have been applied to software development by the first author [52] to determine project stability and optimise agile methods,
DOI: 10.4236/ojmsi.2019.72007 131 Open Journal of Modelling and Simulation the current authors to see what effects the addition of labour has to simplest supply chain [55] for the stability of such systems. Such models are useful be-cause no human devised system is in equilibrium, as is assumed by SERVQUAL and SERVPERF, but is a dynamic time dependent process. It is certainly clear from the published Wikipedia results [56] that this is the case. Their advantage over SD models is the facility to vary the type of delay, nonlinear functions and variable gain and produce optimal solutions. These models allow researchers to investigate the causes of such dynamic behaviour in a wide range of problem ar-eas. The fundamental purpose of such models is to identify feedback processes, effective time delays and amplifications of signals that dominate the dynamics.
As indicated by the survey of feedback by Richardson [28], processes in this field contain feedback loops and recognition of a deficit between a desired state and the actual state. It is worthwhile noting that real physical control processes in biology use difference measurements. All the models of software processes examined by Abdel-Hamid [16] are represented using this structure with con-siderable success. The SERVQUAL representation (fig 1) echoes this but it is not the rationale for the choice of this model structure, rather the model provides evidence for some of the basic structure of SERVQUAL assessment but not its measurement processes.
The prime purpose of a service value model is to enable the development process to be predicted and hence, controlled or moderated in an inclusive and collaborative development environment where no one person or organization has sufficient total control authority. This model relates to the parameters influ-encing co-creation of service with assumptions that include co-creation (or co-production) as a normal activity by originators of the articles and editors. The exceptions are that the productivity of the internal and external sources may not be the same, and the associated time delays may be different, usually slower for the external contributors. It is assumed here that the users have already cho-sen to use “Self-Service Technologies”, which is an issue discussed in some detail by Meuter et al.[57]. They outline the problem of adoption of such new tech-nology discussing the ability, motivation and clarity of role of users. These are well defined here because of the specific nature of the Wikipedia example but the agent classification would need to be made clear if the model is used elsewhere. The model does not have these parameters deployed separately but they could be a prime example of such an improvement or extension. Both users (co-creators) and editors are largely self-selecting in the Wikipedia example. This will not al-ways be the case.
Formulation of the CS Model
meas-DOI: 10.4236/ojmsi.2019.72007 132 Open Journal of Modelling and Simulation ured as numbers of completed tasks or articles added to the encyclopaedia. The more articles there are the more use (value) the encyclopaedia has to the end user. In the case of open-source software development the value (state) would be some function of the number of lines of code implemented or task functions completed.
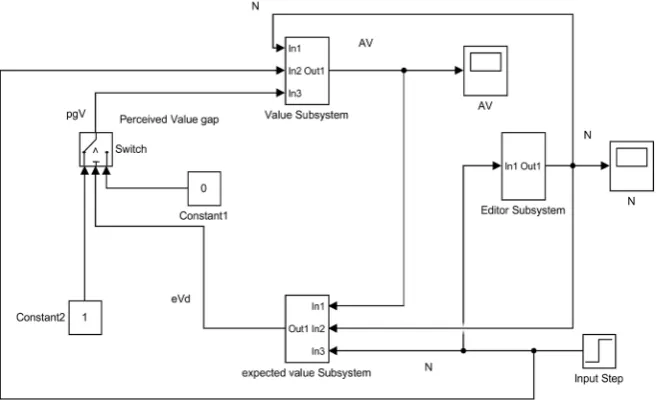
The overall structure of the model with subsystems is shown in a causal loop diagram in Figure 2 and the Simulink diagram Figure 3. In the model, Value (number of articles) is increased at a rate of AVR and destroyed at a rate of DVR
[58]. In all projects there is some rework. Open-source software development follows the same patterns as for in-house developed software, except that time-scales are likely to be much more protracted since there is no control of when external agents do their work. In the case of Wikipedia, articles are removed if they are judged to be poorly drafted, incorrect or malicious [59]. This type of process is seen in many natural and manmade systems [58] and is a common feature of SD models.
[image:8.595.237.513.342.472.2]The rate of change of the state, (Actual Value AV), equals the difference be-tween the rates of change of value created (AVR) and the rate of change of value
Figure 2. Causal loop diagram of the states and actions for Wiki development.
[image:8.595.210.539.505.706.2]DOI: 10.4236/ojmsi.2019.72007 133 Open Journal of Modelling and Simulation destroyed (DVR) (related to rework). This is a very common formulation in SD and the equation relating such processes can be written:
d d
AV AVR DVR
t = − (1)
In the centre of the figure the difference between AVR and DVR is integrated to obtain the actual value, AV. The rate of value destroyed is dependent on the number of agents (editors) at any time t. There will be a sudden change in the value destroyed as the editors become aware of the submission of material (arti-cles). This is obtained from the number of agents (editors) multiplied by the in-put step demand then delayed by a time Tad, the time taken for the material (documents) to be removed from the system represented by the control system element: 1/(Tdvs + 1) where s is the Laplace transform. The amount of rejected material depends on the fraction of the original amount (number) of material (documents) and the average productivity of the agents on average. The output of the delayed block is then multiplied by the fraction of the original documents rejected and multiplied by the average productivity of the agents, pre.
These time delays are observed and recorded in practice. However the form of modelling here is the simplest formulation that could be used. The current data available does not allow for a higher order model interpretation.
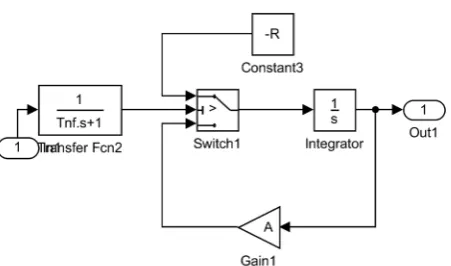
The value generated rate AVR, is made up of two contributions, from internal and external contributors. Both arise from the perception of a deficit or gap in service after a time Tp. The internal component is due to the number of internal staff Ne, multiplied by their productivity pre (Gain 7).
The external component is due to the number of external editors multiplied by their productivity. An assumption is made that their productivity is essen-tially the same, pre, as the internal staff(Figure 4).
In the development of a web-based service, such as open-source software production, it is often the case that internal staff are used to check the material added to the overall value rather than create new value. These contributions are added and delayed by time Tav, which is the time taken to accept new material. This is also publically available data. Gaps 5 & 6 are implicitly embedded in this module.
The form of service value is defined in the previous section by a perception of a service gap pgV, is equal to the expected value minus the actual value, however defined or measured (e.g. price). This is illustrated in Figure 5. There are again two parts to the perception of value, that arising from an expectation by users that changes with time and can be implemented as a linear function and a sec-ond part where this expectation is generated by the editors. These perceptions in principle match SERVQUAL Gaps 1, 2, 3 & 7 in Figure 1.
DOI: 10.4236/ojmsi.2019.72007 134 Open Journal of Modelling and Simulation
Figure 4. Generation of value in the value subsystem of Figure 3.
Figure 5. Contribution of expected value in the expected value subsystem of Figure 3.
either because they do not have the time, expertise or because they get disillu-sioned with the exercise [60]. Suh et al. [61] point out two other issues that could cause this problem of a downturn in output. These are growing resistance to new content by the small number of prolific editors and the greater overhead im-posed by the costs of coordination and bureaucracy.
They also raise the issue of vandalism on various topics, which is topic spe-cific. The rate at which informed participants increases depends on the number of participants who spread the word [62].
d
dN ANt = (3) As a first approximation it is assumed that the reduction will also be a linear rate. This value has been approximated from known data.
after a Time delay Tnf to disengagement this then reduces at rate edr This is implemented in Figure 6.
DOI: 10.4236/ojmsi.2019.72007 135 Open Journal of Modelling and Simulation
Figure 6. Generation of new editors in the Editor subsystem of Figure 3.
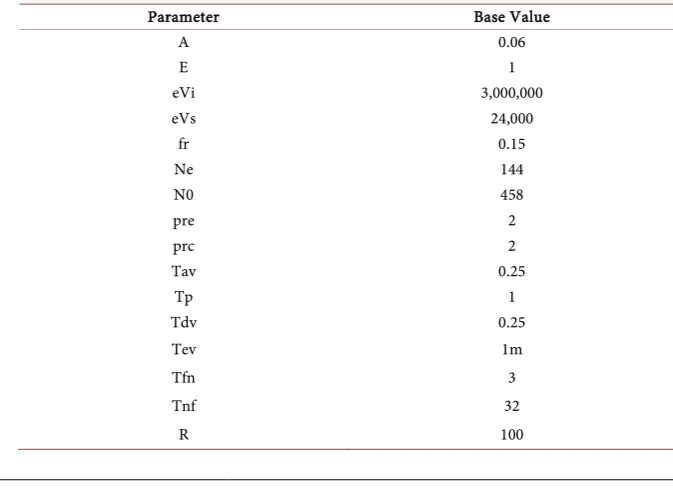
The published Wikipedia data used for the case study simulation is given in
Table 2. Generally, the published response [63] (Figure 7) for the production of Wikipedia articles shows a rising trend, at first nearly exponential, but tending towards a linear increase with time after 5 years, with a number of oscillations present in the curve of period around 2 - 4 months.
There is a small surge in articles in the real data at around 18 months from Wikipedia’s start but the cause is unknown, contributors hint that it may be due to a statistical fault. The increase in the number of editors (contributors) of arti-cles increases exponentially but reaches a limit and then declines. There is a sub-stantial reduction in trend at around 80 months. It is not known exactly what has caused this change.
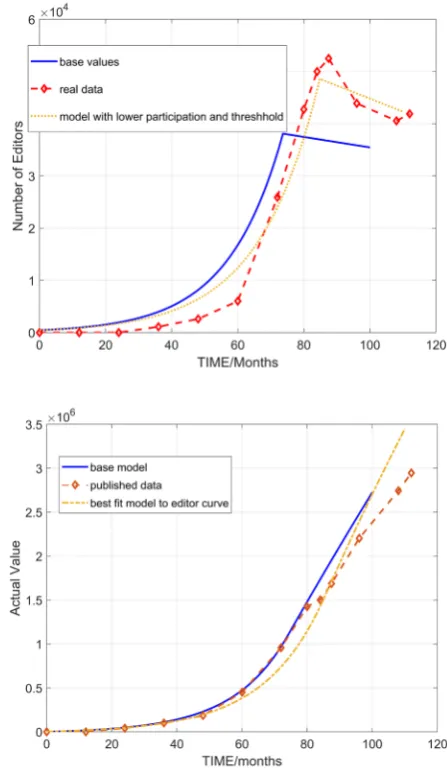
The latter part of the data exhibits larger (up to 2000 editors) oscillations of around 3 - 4 months period. Results from the simulation in Figure 8 show simi-lar shaped curves to Figure 7 with relatively good numerical agreement.
The curves show an exponential rise to 5 years for both articles produced and the number of editors and the magnitudes are close using the best estimates from published wiki data [63].
The discontinuity in the simulated data is sharper than in the real data. The editor simulation does not show the oscillations that are present in the real data. There are oscillations in the curve, for the articles produced after 5 years, but they are smaller than for the real data. No substantial oscillations are present in the simulated editor growth curve.
“WMFArticlesVsContrib” by Bridgestone Partners [63] a consultant to the Wikimedia Foundation, Licensed under GFDL via Wikimedia Commons
https://commons.wikimedia.org/wiki/File:WMFArticlesVsContrib.png#/media/ File:WMFArticlesVsContrib.png
Figure 9 shows the effect of changes in contributor productivity the dominant parameter in the performance of the model and a similar but smaller effect of the productivity of the editors in Figure 10.
DOI: 10.4236/ojmsi.2019.72007 136 Open Journal of Modelling and Simulation
Figure 7. Real source data for article development and the number of editors in
Wikipe-dia.
Figure 8. Results of Editor predictions and articles produced vs time and compared with
[image:12.595.259.483.308.694.2]DOI: 10.4236/ojmsi.2019.72007 137 Open Journal of Modelling and Simulation
[image:13.595.252.498.248.446.2]Figure 9. Number of articles created vs time for a range of contributor productivity.
Figure 10. Number of articles created vs time for change in editor productivity.
Table 2. Best parameter estimates from Wikipedia web sites.
Parameter Base Value
A 0.06
E 1
eVi 3,000,000 eVs 24,000
fr 0.15
Ne 144
N0 458
pre 2
prc 2
Tav 0.25
Tp 1
Tdv 0.25
Tev 1m
Tfn 3
Tnf 32
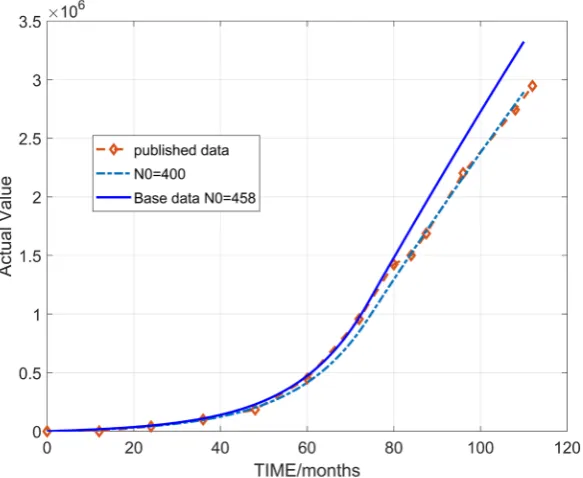
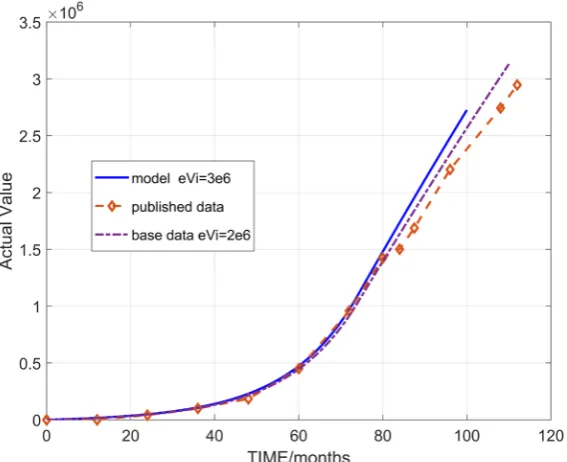
[image:13.595.200.537.498.743.2]DOI: 10.4236/ojmsi.2019.72007 138 Open Journal of Modelling and Simulation editors to 30% has a significant effect as shown in Figure 11, reducing the num-ber of articles completed by around 5%. A reduction of 12% in initial editor numbers (Figure 12) produces a similar reduction in articles generated, while a 30% reduction in initial expected articles produces a 5% reduction in articles produced (Figure 13).
Figure 11. Number of articles created vs time and fraction rejected by editors.
[image:14.595.230.522.466.705.2]DOI: 10.4236/ojmsi.2019.72007 139 Open Journal of Modelling and Simulation
Figure 13. Number of articles created vs time and initial expectation of value.
4. Discussion
These observed patterns are visible in the articles in other languages as well but are much more defined in English since there are a greater number of articles involved. The oscillations could be associated with US academic semesters with peaks in February and August. Research reported by Faulkner et al.[65] appears to indicate that the decline in number of editors is due to a rate of decrease of new editors.
A recognition of a defined gap in service would tend to support the SERVQUAL description, but not the methodology to obtain an estimate of value. This agreement supports both a recognition of a gap in service and the ba-sic dynamics as implemented in equation 1. That there is a limit followed by a slow decline as applied to the case of Wikipedia is confirmed. However, it is also clear that not all the dynamics of the process are included in the model and the time constants need better refinement and formulation to get the oscillations in the article generation correct. It must be clearly understood that the data used in the model are average values as presented in the literature. A separate sub-system could be included, as in software generation SD models, to allow for editor training and levels of experience to get more accurate modelling of the processes involved.
It is clear that the model does produce a good simulation of the general be-haviour of the value generation process, within 10% for the growth in articles and within 25% for the editor data curves, especially reproducing the rapid ex-ponential rise in articles.
DOI: 10.4236/ojmsi.2019.72007 140 Open Journal of Modelling and Simulation The oscillations in the editor contribution are more difficult to explain. No data yet found gives any reason that could cause this small but definitive cyclic effect. It may be involved with information delays or the time delay to get ap-proval for the removal processes but on available data these do not look likely. It is more likely that some underlying feedback paths have not been identified.
The sharp discontinuity or limit in the control model is due to the very simple implementation used here. Modelling the relevant feedback process of which the editors are part, has not yet been achieved by using a variety of simple models with suitable time constants. The way in which the expected initial value is im-plemented in the model is also in need of improvement, but no survey data available is sufficient to refine this part of the model.
The model, which is similar to SD project models is applicable in diverse situations such as social housing and production inventory and now proposed for value generation. In general the overall generation of value and destruction of value Equation (2) is supported by the Wikipedia simulation as the values are within the margin for the range of the constants used. That there will be a limit in production of value is supported but the implementation mechanism needs to be improved.
4.1. Lessons for Managers Involved in Collaborative Web
Development
This simulation formulation of the CS model highlight some crucial lessons for management i.e. more collaborative teams, co-production processes and more effective delivery. Time dependency factors are of prime importance as they are determinants of revisions of collaborative teams (in terms of numbers and skills), revisions of affordable blocks of time related task allocations, revisions of project costing and eventually, timely successful end results. Contingency plans and re-negotiations of contracts might have to be incorporated depending on the serious time lapses caused by serious Service Quality Gaps. These emerge during the co-creation or co-production stages. It must be acknowledged that perception of value achieved for delivery differs even amongst the staff within the service provider environment. The following are some key highlights from this simulation:
A simple CS model can be used to give reasonable predictions of development of a collaborative web development, including agent activity and pay in other applications.
As in ALL software development the productivity of agents (editors) is a key parameter.
The rework (destruction of value) is key to the overall project success, par-ticularly cost.
DOI: 10.4236/ojmsi.2019.72007 141 Open Journal of Modelling and Simulation
4.2. Limitations and Future Work
Currently, the results indicate that although the CS model supports the gaps proposed in SERVQUAL the dynamics are not captured by that approach. The way such data is obtained is not useful for the creation and support of numerical models, even if that methodology is correct, which is disputed by many re-searchers.
The model has some limitations in presenting changes as sharp as events in the real case, but is comparable to published data and reasonably accurate in time and scale while not representing all the minor dynamics present in the real-world situation. More data is needed. Nevertheless, the basic model pre-sented here is accurate enough to enable a company to use it to predict person-nel planning and productivity necessary for task completion for other similar applications.
Future research could establish all the feedback mechanisms involved in the way editors choose to remove or edit articles from the pool. For example, the reasons why some articles are rejected and then reinstated are not clear and much speculation about rival algorithms is present on the internet. This may be the mechanism responsible for some of the oscillatory behaviour.
The perceptions of the participants about the true state of the value generated are average parameters. Software development models have much more sophis-ticated dynamics implemented in them. These dynamics could be included once more measurement data is available.
From the simulations presented here changes in these dominant parameters could all have produced effects that would explain the differences seen in the curves of number of articles produced.
5. Conclusions
A control system model has been used to predict service value development us-ing the concepts of value gaps, feedback and co-creation or co-development processes in the case of Wikipedia. The control engineering model presented here, although relatively basic, produces curves that are very close to the actual increase in articles and editors for the Wikipedia website using data publicly available from Wikipedia.
Although the model supports some of the gaps proposed in SERVQUAL, the dynamics are not captured by that description. The way the data is obtained is not useful for the creation and support of numerical models, even if that meth-odology is correct, which is disputed by many researchers.
The model is comparable to published data and reasonably accurate in time and scale while not representing all the minor dynamics present in the real-world situation. It would take a substantial research programme to obtain sufficient data to investigate the minor dynamics present in the real data.
DOI: 10.4236/ojmsi.2019.72007 142 Open Journal of Modelling and Simulation task completion for other similar applications.
Gap concepts of SERVQUAL are largely but not wholly coincident with the model here. Differences in states are fundamental to the operation of SD/Control System models. The results of the model should be seen as support-ing SERVQUAL not the other way around. Generally, SERVQUAL and its rivals are of little help with creating predictive numerical models.
Future development of the model depends on more information becoming available.
The application study presented in this paper should be considered as the minimum CS model that represents the fundamental development of value gen-eration in collaborative web projects such as Wikipedia.
This CS model could be applied to open source software development and with other collaborative web development since the principle components of value generated and rework are similar in all software development.
Future research would include modelling different implementations of satura-tion limits and the small cyclic effects discussed earlier. Attempts are underway to model the generation of open software but have been limited by lack of data thus far.
The current simulation CS model supports the incorporation of time de-pendent parameters and service gap factors to assist in predicting or deriving service value development.
Conflicts of Interest
The authors declare no conflicts of interest regarding the publication of this pa-per.
References
[1] Constine, J. (2017) Facebook Now Has 2 Billion Monthly Users… and Responsibil-ity. https://techcrunch.com/2017/06/27/facebook-2-billion-users
[2] Matney, L. (2017) Google Has 2 Billion Users on Android, 500M on Google Photos.
https://techcrunch.com/2017/05/17/google-has-2-billion-users-on-android-500m-o n-google-photos
[3] Lee, Y.M., An, L. and Connors, D. (2009) Application of Feedback Control Method to Workforce Management in a Service Supply Chain. Service Science, 1, 77-92.
https://doi.org/10.1287/serv.1.2.77
[4] Lyneis, J. and Ford, D. (2007) System Dynamics Applied to Project Management: A Survey, Assessment and Directions for Future Research. System Dynamics Review, 23, 57-189.https://doi.org/10.1002/sdr.377
[5] Li, B. and Nahrstedt, K. (1998) A Control Theoretical Model for Quality of Service Adaptions. Technical Report from University of Illinois, Urbana.
[6] Rodrigues, A. and Bowers, J. (1996) System Dynamics in Project Management: A Comparative Analysis with Traditional Methods. System Dynamics Review, 12, 121-139.
DOI: 10.4236/ojmsi.2019.72007 143 Open Journal of Modelling and Simulation
[7] Abdel-Hamid, T.K., Sengupta, K. and Swett, C. (1999) The Impact of Goals on Software Project Management: An Experimental Investigation. MIS Quarterly,23, 531-555.https://doi.org/10.2307/249488
[8] Forrester, J.W. (1961) Industrial Dynamics. MIT Press, Cambridge.
[9] Hajiheydari, N. and Zarei, B. (2013) Developing and Manipulating Business Models Applying System Dynamics Approach. Journal of Modelling in Management, 8, 155-170.https://doi.org/10.1108/JM2-11-2011-0058
[10] Mele, C., Pels, J. and Polese, F. (2010) A Brief Review of Systems Theories and Their Managerial Applications. Service Science, 2, 126-135.
https://doi.org/10.1287/serv.2.1_2.126
[11] Madachy, R.J. (2008) Software Process Dynamics. Wiley, Hoboken.
https://doi.org/10.1002/9780470192719
[12] Yun, J., Lee, S.H. and Jeong, H. (2016) Intellectual Interchanges in the History of the Massive Online Open-Editing Encyclopedia Wikipedia. Physical Review E, 93, Article ID: 012307.https://doi.org/10.1103/PhysRevE.93.012307
[13] Santos, C., Kuk, G., Kon, F. and Pearson, J. (2013) The Attraction of Contributors in Free and Open Source Software Projects. Journal of Strategic Information Sys-tems,22, 26-45.https://doi.org/10.1016/j.jsis.2012.07.004
[14] Forrester, J.W. (1987) Lessons from System Dynamics Modelling. System Dynamics Review,3, 136-150.https://doi.org/10.1002/sdr.4260030205
[15] Roberts, E. (1964) The Dynamics of Research and Development. Harper & Row, New York.
[16] Abdel-Hamid, T.K. and Madnick, S.E. (1991). Software Project Dynamics. Pren-tice-Hall, Upper Saddle River.
[17] Rahmandad, H. and Weiss, D.M. (2009) Dynamics of Concurrent Software Devel-opment. System Dynamics Review, 25, 224-249. https://doi.org/10.1002/sdr.425
[18] Ford, D. (2009) System Dynamics for Large Complex Projects.
http://131.215.239.80/workshop9/ford.pdf
[19] Trammell, T., Madnick, S. and Moulton, A. (2013) Using System Dynamics to Ana-lyze the Effect of Funding Fluctuations on Software Development. Working Paper CISL#2013-06, Sloan School of Management, MIT, Boston.
[20] Parekh, S., Gandhi, N., Hellerstein, J., Tilbury, D., Jayram, T. and Bigus, J. (2002) Using Control Theory to Achieve Service Level Objectives in Performance Man-agement. Real Time Systems, 23, 127-141.https://doi.org/10.1023/A:1015350520175
[21] Vlietland, J. and van Vliet, H. (2013) Visibility and Performance of IT Incident Handling. 23rd Workshop on Software Measurement and 8th International Con-ference on Software Process and Product Measurement, Ankara, 23-26 October 2013, 103-121.
[22] Yang, K.K., Low, J.M.W. and Cayirli, T. (2014) Modeling Queues with Simulation versus M/M/C Models. Journal Service Science Research, 6, 173-192.
https://doi.org/10.1007/s12927-014-0007-3
[23] Oliva, R., Sterman, J. and Giese, M. (2003) Limits to Growth in the New Economy: Exploring the “Get Big Fast” Strategy in e-Commerce. System Dynamics Review, 19, 83-117.https://doi.org/10.1002/sdr.271
[24] Diao, Y. (2007) Using Control Theory to Improve Productivity of Service Systems, Services Computing. IEEE International Conference on Services Computing (SCC
DOI: 10.4236/ojmsi.2019.72007 144 Open Journal of Modelling and Simulation
[25] Kim, S. and Choi, K. (2008) A Dynamic Resource Allocation on Service Supply Chain, Supply Chain Theory and Applications. Ed V Kordric, I-Tech Education and Publishing, Vienna.
[26] Dutta, A. and Sridhar, V. (2002) Modeling Growth of Cellular Services in India. 36th Hawaii International Conference on System Sciences, 6-9 January 2002, Ha-waii, 1-10.
[27] Oliva, R. and Sterman, J. (2010) Death Spirals and Virtuous Circles: Human Re-source Dynamics. In: Maglio, P., Kieliszewski, C. and Spohrer, J., Eds., Handbook of Service Science, Springer, New York, 321-358.
https://doi.org/10.1007/978-1-4419-1628-0_15
[28] Richardson, G.P. (1999) Feedback Thought. Pegasus Communications Inc., Waltham.
[29] Gilb, T. (2005) Competitive Engineering. Elsevier, Oxford.
[30] Grönroos, C. (1984) From Marketing Mix to Relationship Marketing: Towards a Paradigm Shift in Marketing. Asia-Australia Marketing Journal, 2, 9-21.
[31] Parasuraman, A., Zeithmal, V.A. and Berry, L.L. (1988) SERVQUAL: A Multi-ple-Item Scale for Measuring Customer Perceptions of Service Quality. Journal of Retailing, 64, 12-40.
[32] Gummesson, E. (2002) Relationship Marketing and a New Economy: It’s Time for De-Programming. Journal of Services Marketing, 16, 585-589.
https://doi.org/10.1108/08876040210447315
[33] Vargo, S.L. and Lusch, R.F. (2006) Service-Dominant Logic: What It Is, What It Is Not, What It Might Be. In: Lusch, R.F. and Vargo, S.L., Eds., The Service-Dominant Logic of Marketing: Dialog, Debate and Directions, Routledge, Taylor Francis, London, 43-56.
[34] Lusch, R.F. and Vargo, S.L. (2015) Service-Dominant Logic: Premises, Perspectives, Possibilities. Cambridge University Press, Cambridge.
[35] Shahin, A. (2006) SERVQUAL and Model of Service Quality Gaps: A Framework for Determining and Prioritizing Critical Factors. In: Delivering Quality Services,
Service Quality: An Introduction, ICFAI University Press, Andhra Pradesh, 117-131.
[36] Cronin, J. and Taylor, S.A. (1992) Measuring Service Quality: A Re-Examination and Extension. Journal of Marketing,56, 55-67.
https://doi.org/10.1177/002224299205600304
[37] Cronin, J. and Taylor, S.A. (1994) SERVPERF versus SERVQUAL: Reconciling Performance-Based and Perceptions-Minus-Expectations Measurement of Service Quality. Journal of Marketing,58, 125-131.
https://doi.org/10.1177/002224299405800110
[38] Taylor, S.A. and Cronin, J. (1994) An Empirical Assessment of the Servperf Scale.
Journal of Marketing Theory and Practice,2, 52-58.
https://doi.org/10.1080/10696679.1994.11501669
[39] Van Dyke, T.P., Kappelman, L.A. and Prybutok, V.R. (1997) Measuring Informa-tion Systems Service Quality: Concerns on the Use of the SERVQUAL QuesInforma-tion- Question-naire. MIS Quarterly, 21, 195-208.https://doi.org/10.2307/249419
[40] Van Dyke, T.P., Prybutok, V.R. and Kappelman, L.A. (1999) Cautions on the Use of the SERVQUAL Measure to Assess the Quality of Information Systems Services.
Decision Sciences,30, 877-891.
DOI: 10.4236/ojmsi.2019.72007 145 Open Journal of Modelling and Simulation
Quality: SERVQUAL from the Other Side. MIS Quarterly, 26, 145-166.
https://doi.org/10.2307/4132324
[42] Kettinger, W.J. and Lee, C.C. (1997) Pragmatic Perspectives on the Measurement of Information Systems Service Quality. MIS Quarterly, 21, 223-240.
https://doi.org/10.2307/249421
[43] Fogarty, G., Catts, R. and Forlin, C. (2000) Identifying Shortcomings in the Meas-urement of Service Quality. Journal of Outcome Measurement, 4, 425-447. [44] Landrum, H., Prybutok, V. and Zhang, X. (2010) The Moderating Effect of
Occupa-tion on the PercepOccupa-tion of InformaOccupa-tion Services. Computers & Industrial Engineer-ing,58, 133-142.https://doi.org/10.1016/j.cie.2009.09.006
[45] Rodrigues, L.L., Barkur, G., Varambally, K.V.M. and Motlagh, F.G. (2011) Com-parison of SERVQUAL and SERVPERF Metrics: An Empirical Study. The TQM Journal, 23, 629-643.https://doi.org/10.1108/17542731111175248
[46] McKinney, V., Yoon, K. and Zahedi, F.M. (2002) The Measurement of Web-Customer Satisfaction: An Expectation and Disconfirmation Approach. Information Systems Research,13, 296-315.https://doi.org/10.1287/isre.13.3.296.76
[47] Jia, R., Reich, B.H. and Pearson, J.M. (2008) IT Service Climate: An Extension to IT Service Quality Research. Journal of the Association for Information Systems, 9, 294-321.https://doi.org/10.17705/1jais.00159
[48] House of Commons, First Report (1999-2000) Improving the Delivery of Govern-ment IT Projects, Session 1999-2000, Committee of Public Accounts.
[49] Royal Academy of Engineering (2004) The Challenges of Complex IT Projects. Re-port of Working Group of RAE and BCS.
[50] White, A.S. (2006) External Disturbance Control for Software Project Management.
International Journal of Project Management,24, 127-135.
https://doi.org/10.1016/j.ijproman.2005.07.002
[51] Hilton, T., Hughes, T. and Chalcraft, D. (2012) Service Co-Creation and Value Re-alisation. Journal of Marketing Management, 28, 1504-1519.
http://www.tandfonline.com
http://www.academia.edu/8629541/Service_co-creation_and_value_realisation [52] White, A.S. (2011) A Control System Project Development Model Derived from
System Dynamics. International Journal of Project Management, 29, 696-705.
https://doi.org/10.1016/j.ijproman.2010.07.009
[53] White, A.S. (2014) An Agile Project System Dynamics Simulation Model. Interna-tional Journal of Information Technologies and Systems Approach, 7, 55-79.
https://doi.org/10.4018/ijitsa.2014010104
[54] Disney, S.M. and Towill, D.R. (2002) A Discrete Transfer Function Model to De-termine the Dynamic Stability of a Vendor Managed Inventory Supply Chain. In-ternational Journal of Production Research, 40, 179-204.
https://doi.org/10.1080/00207540110072975
[55] White, A.S. and Censlive, M. (2015) Control System Analysis of Labour Supply Flows in Production Systems. Journal of Manufacturing Systems,37, 316-327.
https://doi.org/10.1016/j.jmsy.2014.08.001
[56] Wikipedia (2015) Modelling Wikipedia’s Growth.
https://en.wikipedia.org/wiki/Wikipedia:Modelling_Wikipedia%27_growth [57] Meuter, M.L., Bitner, M.J., Ostrom, A.L. and Brown, S.W. (2005) Choosing among
DOI: 10.4236/ojmsi.2019.72007 146 Open Journal of Modelling and Simulation https://doi.org/10.1509/jmkg.69.2.61.60759
[58] Sterman, J. (2000) Business Dynamics. McGraw-Hill, Boston.
[59] Adler, B.T., de Alfaro, L., Pye, I. and Raman, V. (2008) Measuring Author Contri-butions to the Wikipedia. Proceedings of the 4th International Symposium on Wikis, Porto Portugal, 8-10 September 2008, Article No. 15.
[60] Silverman, M. (2013) Wikipedia Is Losing Editors, But Why?
http://mashable.com/2013/01/08/wikipedia-losing-editors/#AesHpNJQmiqC [61] Suh, B., Convertino, G., Chi, E.H. and Pirolli, P. (2009) The Singularity Is Not Near:
Slowing Growth of Wikipedia. Proceedings of the 5th International Symposium on Wikis and Open Collaboration, Orlando, 25-27 October 2009, Article No. 8.
https://doi.org/10.1145/1641309.1641322
[62] Wong, R. and Sheng, S. (2012) A Business Application of the System Dynamics Approach: Word of Mouth and Its Affect in an Online Environment.
http://timreview.ca/article/568
[63] Bridgestone Partners WMF Articles vs. Contributor (2015).
https://commons.wikimedia.org/wiki/File:WMFArticlesVsContrib.png#/media/File: WMFArticlesVsContrib.png
[64] Chandrakant, A. (2015) What Percentage of Wikipedia Users Actively Contribute?
http://www.quora.com/What-percentage-of-Wikipedia-users-actively-contribute-H ow-many-contributors-does-Wikipedia-have
DOI: 10.4236/ojmsi.2019.72007 147 Open Journal of Modelling and Simulation
Symbols
A = fractionofpopulationinclinedtocontribute
AVR = Fa (time, numberofcontributors, qualityofcontributions)
DVR = Fd (time, ideastoocomplextodeliver, numberofcontributors,quality) Edr = disengagementrate
eV = expectedvalue eVd = eV − AV
eVi = initialexpectedvalue
eVs = rateofincreaseofexpectation pgV = perceivedvaluegap
E = expectationofeachcontributor fr = fractionofarticlesrejectedbyeditors N = numberofcontributors
Ne = numberofemployees
pr = productivity,suffixeeditorsccontributors
Tav = timedelayinimplementingtherateofaddingvalue
Tp = timedelayinperceivingthevaluegap
Tdv = timedelayinimplementingthedestructionofvalue
Tev = timedelayinestimatingtheexpectedvalue
![Figure 1. Service quality gap assessment (Adapted from Parasuraman et al. [31]).](https://thumb-us.123doks.com/thumbv2/123dok_us/9070639.403516/5.595.246.499.60.350/figure-service-quality-gap-assessment-adapted-parasuraman-et.webp)