Light Scattering Study of Mixture of Polyethylene
Glycol with C
12
E
5
Microemulsion
Soheil Sharifi1,2, Masoud Amirkhani2
1Department of Physics, University of Sistan and Baluchestan, Zahedan, Iran; 2Institut für Experimentelle Physik, Universität Ulm,
Albert-Einstein-Allee, Ulm, Germany.
Email: [email protected], [email protected]
Received March 20th, 2011; Revised June 3rd, 2011; Accepted July 5th, 2011.
ABSTRACT
The mixture of C12E5 microemulsion with PEG have been studied by small-angle X-ray scattering and dynamic light
scattering in order to determine structure and dynamic of the system. Light scattering experiment shown an exponential relaxation for pure C12E5 microemulsion that with increasing of PEG concentration in the C12E5 microemulsion,
re-laxation becomes non-exponential, which demonstrates that increase of cooperativity. The study structure of the system with SAXS experiment, shown with increasing of PEG concentration, the size of the droplet doesn’t change but interac-tion between droplets increases that have agreement with light scattering data’s.
Keywords: Nano-droplet, microemulsion, PEG, Light scattering, SAXS
1. Introduction
One of the interesting topic in the soft matter physics is mixture of microemulsion with polymer and study de-pletion interaction between droplets of microemulsion that induced by polymer. The depletion phenomena play an important role in many industrial and biologi-cal applications. The study of the depletion interaction is important because of the some phenomena that it can produce with this effect. It is well known that depletion interaction can make phase separation in the colloidal dispersions [1], protein crystallization and the helical conformation of long molecular chains [2-4]. In the mixture of non-adsorbing polymer with microemulsion, near the surfaces of droplets, there exists a depletion volume usually characterized by a depletion layer thickness [5-8]. Ternary microemulsions, consisting of water, decane, and nonionic surfactant, pentaethylene glycol dodecyl ether (C12E5), have been well charac-terized by many researchers, [9-11]. These systems form an oil-in-water droplet microemulsion, a lamellar structure, a bi-continuous microemulsion, or a hexago- nal structure depending on the concentration and tem-perature. The thermodynamic properties of the nonio- nic microemulsion with the C12E5 at a constant surfac-tant-to-oil weight ratio of 1.08 had been studied exten-sively, and the system is well characterized. The C12E5 microemulsion at this weight ratio have between 24 C
to 30 C shown a L1 phase and phase tradition change with add polymer to the microemulsion. Dynamic and structure study of this system showed a single relaxa-tion and well-defined spherical oil droplets with hy-drocarbon radius 75 Å and low polydispersity [12]. In this work, the effects of increasing of nonadsorbing polymer, polyethylene glycol (PEG), on the structure and relaxation of droplet of nanionic microemulsions (C12E5 microemulsions) is studied with SAXS and light scattering. The viscosity and light scattering of the mixture of PEG with C12E5 microemulsion was studied and analyzed within polymer depletion theory, [13]. In that studied, dilution viscometry and dynamic light scattering were used to confirm that these microemul-sions behave as hardsphere dispermicroemul-sions. However, the system is different to ours with respect to the molecular weight of the polyethylene glycol.
2. Experiment
Materials and Istruments
opened, the surfactant was stored in a nitrogen environ-ment; it was still found that the surfactant did not remain stable for more than a month. The samples were prepared by mixing the components directly in glass a ampoule in order to minimize the number of transfers and the glass ampoules were tightly sealed with a gas flame. The mi-croemulsions were prepared by weight, in terms of sur-factant-oil mass ratio of 1.08 and the mass fraction of droplets (mf, drop = (mDec + mC12E5)/(mTotal)), which varies by the respective mass of n-decane (mDec), C12E5 (mC12E5) and total sample mass (mTota). The microe-mulsions are thermodynamically stable dispersions in oil-in-water (O/W) droplets surrounded by a surfactant film: For these O/W microemulsions, it has been shown that the microemulsion phase (L1) is well-modeled as a dispersion of hard-sphere particles. In all experiments, the mass ratio of surfactant to the oil is constant and with a hydrocarbon core radius of 75 Å over a wide range of droplet concentrations, when the system is near the limit of maximum oil solubilization. The samples of microe-mulsions with polymer were prepared by weight in the terms of the mass fraction of triblock polymer (mf, poly = mpoly/(mTotal)) that mpoly is the mass of polymer in the sample. The mixed samples were prepared at a con-stant mass fraction of droplets (mf, drop = 0.1) and a surfactant-oil mass ratio of 1.08 with the different mass fractions of polymer. The samples were thoroughly sha- ken to ensure homogenization and then kept at the tem-perature 26˚C in a water bath for several days before the experiment. We observed that all samples were trans-parent at 26˚C.
Small-angle X-ray scattering (SAXS) measurements were performed using the pinhole SAXS instrument at the University of Aarhus. The instrument consists of an X-ray camera (NanoSTAR, Bruker AXS) with a rotating anode X-ray (Cu Ka radiation) source, crosscoupled Gobel mirrors, collimation using three pinholes and an evacuated beam path, and a 2D position-sensitive gas detector (HiSTAR). The experiments were done at a fixed wavelength of 1.54 Å and two different sam-ple-detector distances. In the current experiments small pinholes were used, giving a range of scattering vectors as 0.001 < Q (1/Å) < 0.2, where q is the wave vector. Samples were held in 1 mm quartz capillaries and meas-urements were made at room temperature. The scattering from capillaries was measured as background and was subtracted to yield the excess scattering as a function of Q for microemulsion samples. DLS measurements were performed using an ALV single-detector version com-pact goniometer system, from ALV-GmbH, Langen, Germany. The light source is a He-Ne laser,
Operating at a wavelength of 632.8 nm, with vertically polarized light. The beam was focused on the sample cell
through a temperature-controlled cylindrical quartz con-tainer (with two plane-parallel windows), which is filled with a refractive index matching liquid (toluene). All the correlation functions in this work were fitted by a single stretched exponential function.
1 exp t
g t
(1)
The stretched exponential function describes the decay processes that have a distribution of relaxation times (). The parameter
0 1
measures the width of the distribution function. A smaller β value corresponds to a broader distribution of relaxation times or more coopera-tive movement [14-16]. The mean value of the relaxation time is given by0
1 exp t dt
(2)Where is the gamma function and the collective
diffusion constant [17-21] was calculated through 2
1/
c
D q .
3. Results and discussion.
Figure 1 shows time correlation function data (at a scat-tering angle of 90˚) for polymer mass fraction of 0.027. The decay of the time correlation function shows a single relaxation that can be well described by Equation (1) for all the samples at 26˚C. The fittings of the correlation functions for the pure microemulsion show that the size distribution of the particles is not changing by changing the droplet mass fraction and also has rather narrow (
Figure 1. The first-order field correlation function versus time for C12E5 microemulsion at a droplet mass fraction of
[image:3.595.309.537.88.257.2]0.098 and polymer mass fraction of 0.027 at the tempera-ture 26˚C.
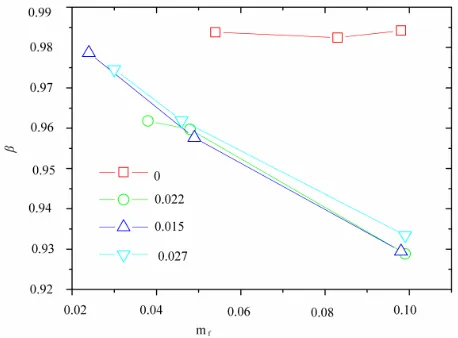
Figure 2. The β value of the mixtures of C12 E5
microe-mulsion for different polymer mass fractions (mf,poly = 0,
0.015▲, 0.022, 0.027▼), versus the mass fraction of droplets at temperature 26˚C.
over the general trend depicted in Figure 3 is that the adding increase amount of PEG the slop of collective diffusion verse droplet mass fraction and the intercept (the dilute-limiting value of diffusion) decreases. This trend is attributed to the change of interaction between microemulsions from repulsion to the attractive interac-tion [20]. This is a typical behavior that has been re-ported elsewhere for the mixture of the C12E5 microe-mulsion and PEG, [13].
[image:3.595.57.286.316.485.2]The structure of the C12E5 microemulsions at the dif-ferent concentrations of droplets (oil and surfactant) has previously been studied by SAXS and small-angle neu-tron scattering in the L1 phase of the microemulsion, [14-16]. A studied has shown hard-sphere behaviors’ that
Figure 3. The diffusion coefficient of the mixtures of C12E5
microemulsion with different polymer mass fractions (mf,poly = 0, 0.015, 0.022▲, 0.027▼), versus the mass
fraction of droplets at temperature 26˚C.
it well-modeled as core-shell particles for a surfactant-to- oil mass ratio of 1.08 at a temperature 25˚C, [14]. In the present work, the variation of structure of the C12E5 mi-croemulsion under addition of the PEG is investigated by SAXS. The generalized indirect Fourier transformation (GIFT) method with a structure factor for a model of monodisperse spheres with an attractive depletion poten-tial is applied to the SAXS data, [22-25].
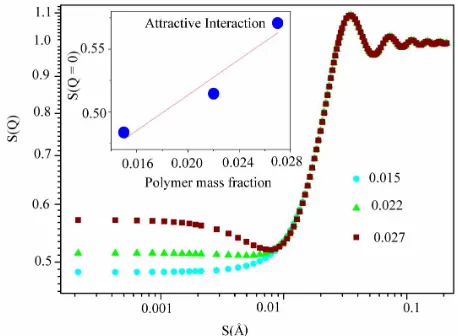
We used GIFT program for analysis SAXS experi-ments and we present results of this analysis in the Table 1. Our results show that size of the droplet at C12E5 mi-croemulsion is 85 Å that it is in agreement with previous results, [14], and the size ratio of polymer to droplet change from 0.3 to 0.5 with increasing polymer mass fraction. Figure 4, shows the SAXS data for the effect of PEG concentration on C12E5 microemulsion at the con-stant droplet mass fraction (0.098) and concon-stant mass ratio of oil to surfactant (1.08). The red line is the fit by the depletion model using the GIFT method. The struc-ture factor derived by this approach from the SAXS data using the depletion model shows a peak at q = 0.034 Å. This peak does not change with the PEG concentration, however, the value of the structure factor at q = 0 in-creases with increasing of PEG concentration, Figure 5.
Figure 4. The SAXS experiment of the mixture of C12 E5
microemulsion at a constant droplet mass fraction (0.098) and mDec/mC12E5 = 1.08 with different concentration of PEG
(mf,pol = 0.015, 0.022▲, 0.027). The red line is the fit
with the attractive monodisperse spheres with q depletion potential obtained by the GIFT method.
Figure 5. Structure factor as a function of q for different mass fraction of PEG (mf,pol = 0.015, 0.022▲, 0.027)
mixed with C12E5 microemulsions at constant mass fraction
of droplet (0.098) and mDec/mC12E5 = 1.08. The insert shows
the structure factor value at the origin (q = 0) as a function of polymer mass fraction.
Table 1. Evaluation parameters for fit data with attractive monodisperse spheres with depletion potential.
Droplet Mass fraction Polymer Mass fraction Droplet Radious (Å)
0.098 0.015 85 0.5
0.098 0.022 85 0.4
0.098 0.027 85 0.3
tance and the sharpness of the peak about the fluctuations around this mean distance, which in turn is dictated by
the micellar interaction potential. Hence, the develop-ment of a rather sharp peak in S(Q) up on polymer addi-tion shows that the micellar ordering is enhanced and the polydispersity increase with add PEG to the systems.
The SAXS experiment on the mixture of microemul-sion with several polymer systems studied before. A study on the mixture of stearate-polyethylene oxide- stearate triblock copolymer and C12E5 microemulsion shown that the addition of physically cross-linking trib- lock copolymer leads to an enhancement of the order between the spherical micelles, [11], increase of the net-work decrease dynamic of the systems. The same results that we can find in the mixture of Hydrophobically End- Capped Poly (ethylene oxide) with C12E5 microemulsion, [12]. In the mixture of PEG with C12E5 microemulsion, PEG cannot increase the order in the microemulsion, because of the non-adsorbing origin of it, but it can in-crease the interaction between the droplets, it is clear from light scattering experiments, Figure 3. So, the best model for the describe the effect of PEG on the C12E5 microemulsion is an attractive sphere model with deple-tion potential. Å
4. Conclusions
Small-angle X-ray scattering and dynamic light scatter-ing have been used to study the mixture of C12E5 with PEG. Our results show the stretched exponential function decrease in from 0.98 to 0.92 with increase of mass fraction of the droplet that this behavior is the same for all the PEG concentration in the C12E5 microemulsion which demonstrates increase of the cooperativity be-tween droplets, more ever the study of the C12E5 mi-croemulsion at different droplet mass fraction shows a repulsive behavior that with increase of concentration of PEG on the C12E5 microemulsion, system become attrac-tive. We used an attractive monodisperse sphere model and polydisperse hard sphere model with size polydis-persity governed by a Schulz distribution to analyzing the SAXS data of mixture of PEG with C12E5 microe-mulsion, first model demonstrates a increase of interac-tion between droplet with increase of the PEG concentra-tion and second model demonstrates a increase of order in the mixture of PEG with C12E5 microemulsion. How-ever, according to the DLS results, the model is more likely to be the right model.
5. Acknowledgements
Thank you of University of Sistan and Baluchestan for kindly Support.
REFERENCES
[image:4.595.56.285.339.507.2]Dis-persions,” Academic Press, New York, 1983.
[2] R. Tuinier, J. Rieger and C. G. de Kruif, “Depletion- Induced Phase Separation in Colloid-Polymer Mixtures,” Advanced Colloid Interface Science, Vol. 103, No. 1, 2003, pp. 1-31. doi:10.1016/S0001-8686(02)00081-7
[3] W. C. K. Poon, “The Physics of a Model Colloid- Polymer Mixture,” Journal of Physics: Condensed Matter, Vol. 14, No. 33, 2002, p. R859-880.
doi:10.1088/0953-8984/14/33/201
[4] V. Snir and R. D. Kamien, “Entropically Driven Helix Formation,” Science, Vol. 307, No. 5712, 2005, p. 1067.
doi:10.1126/science.1106243
[5] H. N. W. Lekkerkerker, “Interactions, Phase Transitions and Metastable States in Concentrated Colloidal Disper-sions,” Physica A, Vol. 213, No. 1-2, 1995, pp. 18-29.
doi:10.1126/science.1106243
[6] R. Tuinier, E. ten Grotenhuis, C. Holt, P. A. Timmins, and C. G. de Kruif, “Depletion Interaction of Casein Mi-celles and an Exocellular Polysaccharide,” Physical Re-view E, Vol. 60, No. 1, 1999, pp. 848-856.
doi:10.1103/PhysRevE.60.848
[7] J. Janzen and D. E. Brooks, Clinical Hemorheology, Vol. 9, No. 695, 1989.
[8] A. M. Kulkarni, A. P. Chattarjee, K. S. Schweizer and C. F. Zukoski, “Depletion Interactions in the Protein Limit: Effects of Polymer Density Fluctuations,” Physical Re-viewLetters, Vol. 83, No. 22, 1999, pp. 4554-4557.
doi:10.1103/PhysRevLett.83.4554
[9] E. Feitosa, W. Brown and P. Hansson, “Interactions be-tween the Non-Ionic Surfactant C12E5 and Poly (ethyl-ene oxide) Studied Using Dynamic Light Scattering and Fluorescence Quenching,” Macromolecules, Vol. 29, 1996, pp. 2169-2178.
doi:10.1021/ma950516g
[10] M. Nayeri, M. Zackrisson and J. Bergenholtz, “Scattering Functions of Core-Shell-Structured Hard Spheres with Schulz-Distributed Radii,” Journal of Physical Chemistry B, Vol. 113, No. 24, 2009, 8296.
doi:10.1021/jp811482w
[11] M. Schwab and B. Stühn, “Relaxation Phenomena and Development of Structure in a Physically Cross Linked Nonionic Microemulsion Studied by Photon Correlation Spectroscopy and Small Angle X-Ray Scattering,” Jour-nal of Chemical Physical, Vol. 112, No. 14, 2000. pp. 6461-6471. doi:10.1063/1.481207
[12] H. Bagger-Jorgensen, L. Coppola, K. Thuresson, U. Ols-son and K. Mortensen, “Phase Behavior, Microstructure, and Dynamics in a Nonionic Microemulsion on Addition of Hydrophobically End-Capped Poly (ethylene oxide),” Langmuir, Vol. 13, No. 16, 1997, pp. 4204-4218.
doi:10.1021/la962054l
[13] M. Zackrisson, R. Andersson and J. Bergenholtz, “Deple-tion Interac“Deple-tions in Model Microemulsions,” Langmuir, Vol. 20, No. 8, 2004, pp. 3080-3089.
doi:10.1021/la036132y
[14] M. Amirkhani, S. Volden, K. Zhu, W. R. Glomm and B. Nystrm, “Adsorption of Cellulose Derivatives on Flat
Gold surfaces and on spherical gold particles” Journal of Colloid and Interface Science, Vol. 328, No. 1, 2008, pp. 20-28. doi:10.1021/la036132y
[15] M. Amirkhani, G. Gorinia and D. Leporinia, “Second Harmonic Generation Studies of Intrinsic and Extrinsic Relaxation Dynamics in Poly (methy1 methacrylate),” Journal of Non-Crystalline Solids, Vol. 355, No. 34-36, 2009, pp. 1707-1712. doi:10.1021/la036132y
[16] E. Y. Sheu, S. Chen, J. S. Huang and J. C. Sung, “Non-exponential Relaxations in Dense Microemulsion near the Glasslike Transition,” Physical Review A, Vol. 39, No. 11, 1989, pp. 5867-5876. doi:10.1103/PhysRevA.39.5867
[17] J. Appell, G. Porte and E. Buhler “Self-Diffusion and Collective Diffusion of Charged Colloids Studied by Dynamic Light Scattering,” Journal of Physical Chemis-try B, Vol. 109, No. 27, 2005, p. 13186.
doi:10.1021/jp051016k
[18] I. Lynch and L. Piculell, “Size, Concentration, and Sol-vency Effects on the Viscosifying Behavior of PEO-PS- PEO Triblock Copolymers in AOT Oil-Continuous Mi-croemulsions,” Journal of Physical Chemistry B, Vol. 108, No. 22, 2004, pp. 7515-7522.
doi:10.1021/jp049147t
[19] C. Van den Broeck, F. Lostak and H. N. W. Lekkerkerker, “The Effect of Direct Interactions on Brownian Diffu-sion,” Journal of Chemical Physics, Vol. 74, No. 3, 1981, pp. 2006-2010.
doi:10.1063/1.441244
[20] A. Shukla, H. Graener and R. H. H. Neubert, “Observation of Two Diffusive Relaxation Modes in Microemulsions by Dynamic Light Scattering,” Langmuir, Vol. 20, No. 20, 2004, pp. 8526-8530. doi:10.1021/la048883l
[21] G. Fritz and O. Glatter, “Structure and Interaction in Dense Colloidal Systems: Evaluation of Scattering Data by the Generalized Indirect Fourier Transformation Me- thod,” Journal of Physics: Condensed Matter, Vol. 18, No. 36, 2006, pp. S2403-2419.
doi:10.1088/0953-8984/18/36/S14
[22] J. Brunner-Popela and O. Glatter, “Small-Angle Scatter-ing of InteractScatter-ing Particles. I. Basic Principles of a Global Evaluation Technique,” Journal of Applied Crystallog-raphy, Vol. 30, No. 4, 1997, pp. 431-442.
doi:10.1021/jp811482w
[23] O. Glatter, “A New Method for the Evaluation of Small- Angle Scattering Data,” Journal of Applied Crystallog-raphy, Vol. 10, No. 5, 1977, pp. 415-421.
doi:10.1107/S0021889877013879
[24] O. Glatter, “Comparison of Two Different Methods for Direct Structure Analysis from Small-Angle Scattering Data,” Journal of Applied Crystallography, Vol. 21, No. 6, 1988, pp. 886-890. doi:10.1107/S0021889877013879