Running Head: COPING AND POSTTRAUMATIC GROWTH
Coping and Posttraumatic Growth: A Longitudinal Comparison of Two Alternative Views
Simon Kunz, Stephen Joseph, Szilvia Geyh, and Claudio Peter,
© 2017, American Psychological Association. This paper is not the copy of record and may not exactly replicate the final, authoritative version of the article. Please do not copy or cite without
Abstract
Purpose: The current study aimed to examine two possible explanations for why higher levels
of posttraumatic growth (PTG) were repeatedly found to be predicted by both approach- and
avoidance-oriented coping, focusing on individuals recently diagnosed with a spinal cord
injury (SCI). First, negative changes (posttraumatic depreciation, PTD) may moderate the
association between PTG and the two types of coping indicating that PTG reflects avoidance
of PTD for some individuals, but a constructive view on posttraumatic life changes for others.
Second, it may be that a flexible use of different types of coping strategies (coping flexibility)
enables the experience of PTG. Method: A sample consisting of 122 patients admitted to one
of the four national SCI rehabilitation centers was examined in a longitudinal study.
Hierarchical multiple regression analyses were conducted to test the two competing
explanations. Results: Both approach- (β = .30, p = .001) and avoidance-oriented coping (β =
.23, p = .011) measured three months after SCI diagnosis predicted higher PTG levels at
discharge from clinical rehabilitation. PTD did not moderate the relationship between
approach- (β = .03, p = .743) and avoidance-oriented coping (β = -.04, p = .656) and PTG.
However, coping flexibility (β = .23, p = .012) predicted higher PTG levels. Conclusion:
These results suggest that a flexible use of different types of coping strategies potentially
according to situational demands may explain findings that PTG was predicted by both
approach- and avoidance-oriented coping.
Keywords: spinal cord injuries; posttraumatic growth; coping flexibility; posttraumatic
Impact
Findings that both approach- and avoidance-oriented coping predict higher PTG
experienced after SCI and other potentially traumatic events pose a puzzle for the PTG
literature, as these types of coping are assumed to serve opposing functions in the
adjustment process. This study is the first to empirically compare competing
theoretical explanations examining individuals with SCI.
Moderated hierarchical regression analyses indicate no support for the so far untested
assumption that perceived PTG reflects two facets which are predicted differently by
the two types of coping. However, this is the first longitudinal study testing and
finding support for the notion that a flexible use of both approach- and
avoidance-oriented coping strategies contributes to the experience of PTG.
A flexible way of coping may be a promising target for intervention programs aiming
to foster the experience of PTG in individuals with an SCI.
Introduction
The onset of a spinal cord injury (SCI) has wide ranging and life altering
consequences. Resulting either from an accident (e.g., car crash, fall) or disease (e.g., cancer),
a damage to the spinal cord leads to a partial (incomplete) or complete loss of autonomic,
motor, and/or sensory functions. Depending on the lesion level, commonly affected areas
include trunk and legs (paraplegia) or additionally the arms (tetraplegia; World Health
Organization, 2013). These physical impairments entail restrictions in everyday activities and
societal participation and result in chronic disability (World Health Organization, 2013). A
substantial minority of individuals with SCI are at risk for psychological morbidity (Craig,
Tran, & Middleton, 2009). However, individuals with SCI also perceive posttraumatic growth
(PTG), which is the experience of positive psychological changes such as having better
According to PTG theories (e.g., Joseph & Linley, 2005; Tedeschi & Calhoun, 2004),
the process of positive transformation in the aftermath of potentially traumatic events such as
SCI is initiated by the psychological struggle with the new reality. For example, Tedeschi and
Calhoun (2004) assume in their PTG model that a traumatic event severely challenges or
shatters an individual’s assumptive world (i.e., deeply rooted self-perceptions, worldviews,
and sense of meaning and purpose). According to their model, assumptive world challenges
are accompanied by high levels of psychological distress, for example symptoms of
posttraumatic stress disorder (PTSD). With time, however, they can be resolved through
persistent cognitive processing. Thereby, the trauma-related information is deliberately
analyzed, re-appraised, and integrated into mental structures so that positively altered or
rebuilt assumptive worlds (i.e., PTG) can emerge. Thus, persistent cognitive processing is
supposed to hold a central role in the development of PTG.
One way to operationalize cognitive processing in empirical studies is through
approach-oriented coping strategies as they are defined as cognitive-emotional activity
directed towards a stressor (Roth & Cohen, 1986). Supporting their important role in the
development of PTG, approach-oriented coping strategies such as positive reappraisal or
acceptance coping were found to have the largest effect sizes of all predictors considered in
meta-analyses in cancer survivors (Shand, Cowlishaw, Brooker, Burney, & Ricciardelli,
2015) and other trauma populations (Helgeson, Reynolds, & Tomich, 2006; Prati &
Pietrantoni, 2009).
Contradictorily, avoidance-oriented coping strategies (i.e., cognitive-emotional
activity directed away from a stressor; Roth & Cohen, 1986) being indicators of a lack of
cognitive processing were also found to be related to higher levels of PTG. For example,
denial coping was positively associated with PTG in a meta-analysis focusing on individuals
after various types of potentially traumatic events (Helgeson et al., 2006). This positive
remained in multivariate analyses when controlling for approach-oriented coping (e.g.,
Gangstad, Norman, & Barton, 2009; Lelorain, Bonnaud-Antignac, & Florin, 2010; Park,
Riley, & Snyder, 2012). Similarly, a longitudinal study in individuals with SCI (Pollard &
Kennedy, 2007) found both mental disengagement, an avoidance-oriented coping strategy,
and active coping, which involves thoughts about the action to take and thus represents a
derivative of approach-oriented coping, to predict higher PTG levels measured later on.
These findings are puzzling in that PTG was cross-sectionally and longitudinally
associated with both indicators of enhanced cognitive processing and indicators of diminished
cognitive processing. The current study aimed to examine two possible explanations for these
findings.
One explanation may be that PTG is not a uniform construct, but reflects realistic
views on psychological changes for some individuals and illusory ones for others: These two
facets of PTG may be differently associated with different types of coping, as hypothesized in
the Janus face model of PTG (Maercker & Zoellner, 2004; Zoellner & Maercker, 2006). More
precisely, the Janus face model of PTG tries to account for findings that PTG was predicted
by different types of coping and that it was inconsistently associated with indicators of
adjustment to trauma across different studies (see e.g., Shand et al., 2015, for a review). PTG
representing realistic changes is thought to result from constructive cognitive processing (i.e.,
to be predicted by approach-oriented coping), as hypothesized by Tedeschi and Calhoun
(2004), and to be associated with good adjustment. In contrast, illusory PTG perceptions are
expected to reflect a cognitive distortion, acting as a self-defense mechanism, which may help
to restore self-esteem and to manage emotional distress in the short-term, but not long-term.
Instead of resulting from cognitive processing, this illusory facet of PTG is therefore assumed
to be associated with avoidance-oriented coping over time, indicating that it may serve the
function of denial and repression (Maercker & Zoellner, 2004; Zoellner & Maercker, 2006).
strategies, whereas realistic PTG reports are predicted by approach-oriented coping strategies.
To examine whether the potential two PTG facets are indeed predicted by these
different types of coping strategies, it is necessary to differentiate between realistic and
illusory reports of PTG. One way to distinguish between individuals experiencing realistic
and illusory PTG may be whether they also report negative consequences of trauma (i.e.,
posttraumatic depreciation, PTD). PTG and PTD, even when experienced in the same
dimensions (e.g., better relationships with some individuals and worse with others), were
found to be unrelated (e.g., Baker, Kelly, Calhoun, Cann, & Tedeschi, 2008; Cann, Calhoun,
Tedeschi, & Solomon, 2010) or even positively related (Kunz, Joseph, Geyh, & Peter, 2017;
Val & Linley, 2006) demonstrating that both can co-occur. However, following Maercker and
Zoellner (2004), illusory PTG may hinder individuals from acknowledging PTD as it is
proposed to serve an avoidant-, denial-like function. Similarly, Park (1998) argued that
acknowledging PTD paired with PTG may reflect a realistic view on posttraumatic life
changes, whereas individuals only reporting PTG may be in a denial-like stage. Supporting
this assumption, Cheng, Wong, and Tsang (2006) found that individuals reporting both PTG
and PTD scored lower on a measure of defensiveness compared to individuals reporting PTG
but no PTD.
In other studies, PTG was associated with better adjustment in individuals who
concurrently experienced higher levels of PTD, but unrelated among those who experienced
lower levels of PTD (Cann et al., 2010; Kunz et al., 2017). Following the Janus face model, a
similar moderation effect of PTD may be expected regarding the prediction of PTG by
approach- and avoidance-oriented coping. In individuals acknowledging PTD jointly with
PTG, approach-oriented coping strategies may be stronger predictors of PTG indicating that
their PTG perceptions reflect a result of cognitive processing and thus a realistic view. In
contrast, avoidance-oriented coping strategies may be stronger PTG predictors in individuals
strategy, which interferes with the reporting of PTD. Such moderation effects of PTD have,
however, never been empirically tested.
An alternate explanation for the finding that both approach- and avoidance-oriented
coping strategies were positively related to PTG in previous research assumes a uniform PTG
construct. Meaning, that it could be a flexible, situationally dependent use of both approach-
and avoidance-oriented coping, rather than cognitively approaching trauma persistently that
contributes to this experience. The intense and enduring challenges that result from potentially
traumatic events may require extreme and competing types of coping over time (Bonanno &
Burton, 2013). Joseph and Linley (2005) posited in their PTG model that managing
distressing emotions in the initial phase after trauma is a prerequisite to engage in cognitive
processing. In their theory, the function of avoidance-oriented coping is understood to reduce
distress in such a way to actually allow the person to manage the confrontation with the
trauma-related information, thus, ultimately giving way for the person to cognitively approach
it (see also Horowitz, 1986; Janoff-Bulman, 2006). Therefore, individuals are required to be
able to draw flexibly among both approach- and avoidance-oriented coping according to the
situational demands. This ability is termed regulatory or coping flexibility (e.g., Bonanno &
Burton, 2013). Indeed, PTG was found to be positively associated with coping flexibility in
cross-sectional studies (Cohen & Katz, 2015; Pat-Horenczyk et al., 2016), but replicating
these findings in a longitudinal study would allow for stronger causal inference.
Current Study
The objective of the current study was to examine the role of coping strategies in the
development of PTG in individuals with SCI. More specifically, this study aimed to (a)
replicate previous findings illustrating that higher PTG is predicted by both approach- and
avoidance-oriented coping in a longitudinal design and to (b) test the two proposed and
assumed that PTG is predicted differently by approach- and avoidance-oriented coping
strategies depending on the degree to which individuals report PTD. In individuals reporting
higher levels of PTD, PTG may be predicted by approach- but not avoidance-oriented coping
indicating a realistic view on posttraumatic life changes. In contrast, for individuals reporting
low levels of PTD, PTG may be predicted by avoidance- but not approach-oriented coping
indicating an illusory view on positive life changes and an ongoing attempt to avoid the
negative impact of the injury. Explanation 2, the coping flexibility hypothesis, stated that the
ability to draw flexibly among both approach- and avoidance-oriented coping strategies
predicts higher levels of PTG.
Method
Participants and Procedure
Data in the current study were collected as part of the on-going Larger Study (LS;
name and reference edited out for blind review). LS is an inception cohort study following
individuals newly diagnosed with an SCI across their clinical rehabilitation and onwards. It
aims to include all individuals newly diagnosed with an SCI who have a permanent residence
in X [edited out for blind review], are 16 years or older, and are admitted to one of the four
collaborating national SCI rehabilitation centers ([edited out for blind review]). Excluded are
individuals with congenital conditions leading to SCI, including spina bifida, new SCI in the
context of palliative care, and neurodegenerative disorders (e.g., multiple sclerosis). LS was
formally approved by the principal ethics committee on research involving humans of X
[edited out for blind review] and subsequently endorsed by all other regional ethics
committees involved.
After giving written informed consent, participants in LS completed clinical
assessments and questionnaires provided in German, French and Italian at four measurement
diagnosis and at rehabilitation discharge (T4; [reference edited out for blind review]). The T4
assessment was not at the same time after SCI diagnosis for every participant, because
duration of clinical rehabilitation varied depending on the severity of the injury (see Table 1).
As a result, participants with a short duration of clinical rehabilitation did not complete all the
assessments before the discharge assessment and/or the discharge assessment was collapsed
with other measurement occasions.
The current study used data on certain psychological measures collected at T1 (i.e.,
control variables), T2 (i.e., coping), and T4 (i.e., PTG and PTD) and based its reporting on the
STROBE statement (von Elm et al., 2007). The 318 patients who participated in LS and
completed their clinical rehabilitation until January 24, 2017, were considered for the current
study. For the specific purpose of the study, we excluded participants for whom measurement
occasions were collapsed (n = 74) and participants who entered the study after T1 (n = 79),
did not complete one of the follow up assessments (n = 33), or did not answer complete scales
regarding our main variables of interest (i.e., coping, PTG, PTD; n = 10) as they were
considered as providing too little information to reliably impute missing values (see Figure 1).
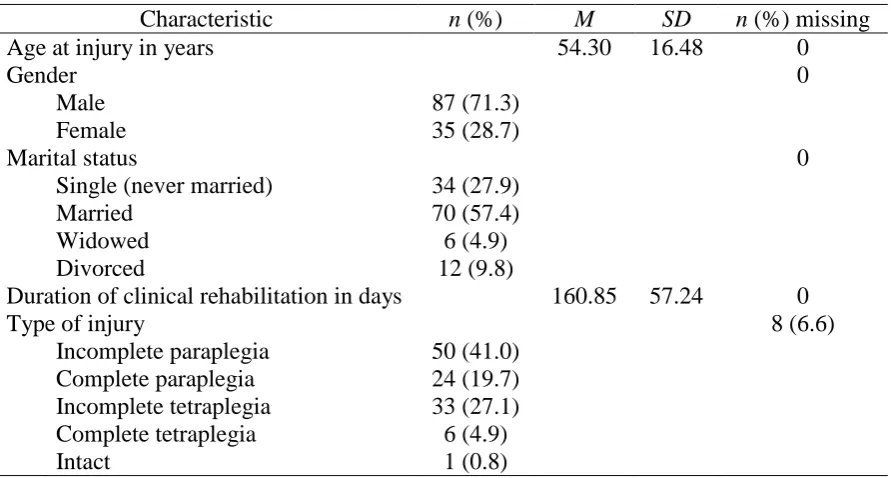
Therefore, the sample size of the current study was n =122. In this sample, the time between
the T2 and the T4 assessment was on average M = 88.20 days (SD = 56.63). Further sample
characteristics are shown in Table 1.
Included participants were comparatively similar to those that were excluded. They
did not differ significantly regarding gender, marital status, age at injury, and cause and type
of the lesion. However, excluded participants had a shorter duration of clinical rehabilitation
(t (316) = 4.82, p < .001, d = .56) and differed from included participants regarding the
language of the questionnaire (χ2 (2) = 11.24, p = .004, V = .19). Participants answering to a
German questionnaire (106 of 143) were more likely to be included than those answering a
French (16 of 43) or Italian (0 of 10) questionnaire.
PTG and PTD (T4). PTG was measured using the short version of the Posttraumatic
Growth Inventory (PTGI-SF; Cann, Calhoun, Tedeschi, Taku, et al., 2010). With 10 items,
the PTGI-SF assesses positive changes in the following domains: improved relationships,
recognizing new possibilities for one’s life, greater appreciation of life, greater sense of
personal strength, and spiritual development. Participants were instructed to rate the degree to
which they experienced the respective change in each item as a result of their SCI using a
six-point Likert scale from 0 (I did not experience this change) to 5 (I experienced this change to
a very great degree). PTD was measured with 10 corresponding but negatively worded items
selected from the Paired Format Posttraumatic Growth Inventory (PTGI-42; Baker et al.,
2008). Total PTG and PTD scores were calculated separately as sum scores with higher scores
indicating greater PTG or PTD (possible range of 0 to 50). The PTGI-SF and the PTGI-42
were shown to be reliable and valid instruments (Baker et al., 2008; Cann, Calhoun, Tedeschi,
Taku, et al., 2010) and also the factorial structure of the reduced 20 item version of the
PTGI-42 was supported (Kunz et al., 2017).
Coping and coping flexibility (T2). Itemsof the Brief COPE (Carver, 1997) were
used to assess coping strategies individuals adopted to handle problems and distress resulting
from SCI. The Brief COPE uses a Likert-scale response format ranging from 1 (I haven’t
been doing this at all) to 4 (I’ve been doing this a lot) and consists of 14 subscales. Minimally
acceptable reliability was reported regarding these subscales despite they consist of only two
items each (Carver, 1997). Previous research (Kapsou, Panayiotou, Kokkinos, & Demetriou,
2010) rather consistently identified higher order factors reflecting approach- (consisting of the
subscales acceptance, positive reinterpretation, active, and planning coping) and
avoidance-oriented coping (subscales denial, self-distraction and behavioral disengagement). To
operationalize approach- and avoidance-oriented coping, we therefore tested this previously
identified higher order factor structure in the current sample using confirmatory factor
disengagement showed nonsignificant factor loadings on the avoidance-oriented coping
factor. Additionally, these two subscales and the subscale planning coping showed
insufficient internal consistency (α < .50). Based on these examinations, we excluded the
subscales planning coping, self-distraction, and behavioral disengagement from further
analyses. Accordingly, we had to create the approach-oriented coping factor (sumscore with a
possible range of 6 to 24) consisting of the subscales acceptance, positive reinterpretation, and
active coping and the avoidance-oriented coping factor (sumscore with a possible range of 2
to 8) consisting of the denial subscale only.
To create a coping flexibility score, we combined the approach- and the
avoidance-oriented coping factors into an index reflecting the ability to use both types of coping equally
likely. Following the procedure of Bonanno, Pat-Horenczyk, and Noll (2011), we
standardized the scores for the approach- and the avoidance-oriented coping factors, then
summed the two factor scores and subtracted coping polarity (absolute average of approach-
minus absolute average of avoidance-oriented coping factor). Thus, a high use of both
approach- and avoidance-oriented coping strategies produces a high sum score and relatively
little polarity resulting in a high flexibility score. Convergent, divergent, and incremental
validity for such a flexibility score, which combines two subscales broadly defined as
approach- and avoidance-oriented coping, has been reported using the Perceived Ability to
Cope With Trauma (PACT) scale (Bonanno et al., 2011).
Control variables (T1). We controlled for psychological distress, social support, and
dispositional optimism as potential confounders, because previous research (e.g., Helgeson et
al., 2006; Prati & Pietrantoni, 2009; Taylor & Stanton, 2007) showed them to be related to
both PTG and to the use of specific coping strategies. To measure posttraumatic stress
reactions as a response to SCI, the Impact of Event Scale-6 (IES-6; Thoresen et al., 2010) was
used. The IES-6 is a short form of the Impact of Event Scale-Revised (IES-R; Weiss &
each cover the PTSD symptom clusters intrusion, avoidance, and hyperarousal. Symptom
severity was measured using five response options ranging from 0 (not at all) to 4
(extremely). The corresponding sum score (possible range = 0-24) correlated strongly with the
sum score of the IES-R across different trauma samples (pooled r = .95) and proved
acceptable internal consistency (Thoresen et al., 2010). Social support was assessed using six
survey questions of the Swiss Household Panel Wave 12 (2010-2011; Tillmann et al., 2016).
Respondents indicated for three different sources (partner, family, friends) the extent to which
they were provided with practical (i.e., concrete help or advice) and emotional support (i.e.,
being available and showing understanding), if needed. The answers were given on a scale
from 0 (not at all) to 10 (a great deal). The item scores were combined into a mean score
(possible range of 0 to 10). Another item of the Swiss Household Panel Wave 12 was used as
a proxy for dispositional optimism. Respondents were asked “Are you often experiencing
plenty of strength, energy, and optimism?” Response options ranged from 0 (never) to 10
(always).
Data Analysis
Data cleaning and calculating descriptive statistics was done using Stata, version 14.
Between 0% and 13.9% of the participants had missing values in the study variables (Table
2). We conducted multiple imputation with chained equations (MICE) to deal with the
missing data. Using the mice package in R (van Buuren & Groothuis-Oudshoorn, 2011) we
created 20 imputed data sets, which was considered to be an adequate number following
recommendations by Graham, Olchowski, and Gilreath (2007).
We imputed the missing data at the scale and interaction level (i.e., centering of
respective predictor variables and calculating interaction terms prior to imputation), as
transforming variables after the imputation introduces bias (von Hippel, 2009). Besides all
duration of rehabilitation as auxiliary variables in the imputation model. In order to reduce the
loss of power resulting from scale level imputation, we also included items of each scale as
auxiliary variables (Enders, 2010). We selected those items with the least amount of missing
values and the highest correlation with the total score (see van Buuren &
Groothuis-Oudshoorn, 2011).
After the imputation, we analyzed each of the 20 imputed data sets separately and
pooled the results according to Rubin’s rules (Barnard & Rubin, 1999; Rubin, 1987). As a
measure of the uncertainty in each parameter estimate attributable to missing data, we report
the fraction of missing information (FMI). The FMI is the proportion of the variability of an
estimate that is due to the missing data (Enders, 2010). Values up to .2 can be considered as
modest, .3 as moderate, and .5 as large (Van Buuren, 2012). To examine our research
questions, we ran a series of hierarchical linear regression analyses. In the first block of each
regression model, we entered the different rehabilitation centers as dummy-coded predictor
variables to take into account the clustering of the data by the four clinics. Using such a fixed
effect model for accommodating clustered data is recommended when the number of clusters
is low (i.e., below 10) and the research interest is exclusively on the individual level (Cohen,
Cohen, West, & Aiken, 2003; see also McNeish & Stapleton, 2016). We also entered
symptoms of PTSD, social support, and optimism as control variables in the first block
(Baseline Model). To test whether both approach- and avoidance-oriented coping
independently predict PTG, we then included these variables as predictors in a second block
(Model 1). To examine the Janus face of PTG hypothesis, we then included the potential
moderator PTD in the third block (Model 1.1) and the interaction terms of PTD and approach-
(Model 2) or avoidance-oriented coping (Model 3) in the fourth block. To test the coping
flexibility hypothesis, we included the coping flexibility score instead of the independent
approach- and avoidance-oriented coping scores in the second block (Model 4). The nested
Two types of sensitivity analyses were performed. First, the regression analyses were
reran in each imputed data set using nonparametric bootstrapping with 1000 repetitions with
the boot package in R (Canty & Ripley, 2016; Davison & Hinkley, 1997) to account for the
small sample size and potential violations of the assumptions underlying regression analyses.
To check for possible bias resulting from imputation, the main analyses were reran using
only complete cases.
Results
Descriptive Statistics and Bivariate Correlations
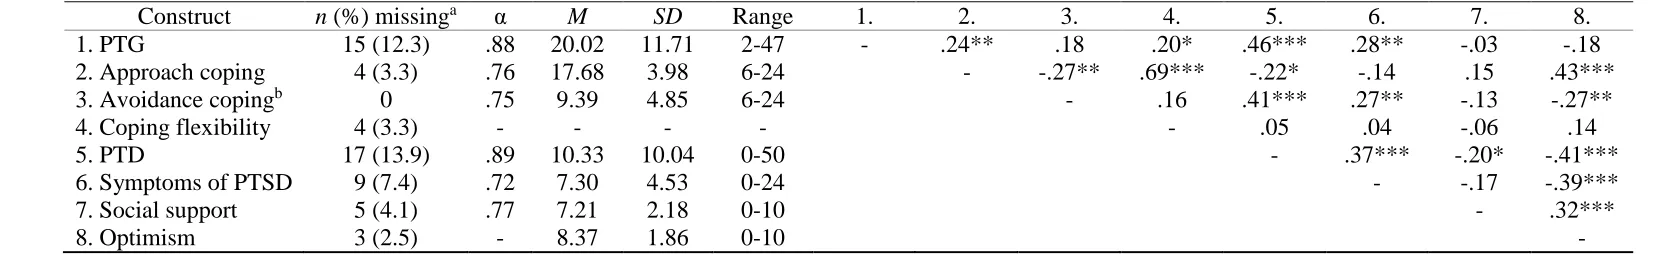
The descriptive statistics of all study variables and the bivariate correlations are
presented in Table 2. PTG was significantly positively related to approach-oriented coping (r
= .24, p = .010), coping flexibility (r = .20, p = .029), PTD (r = .46, p < .001), and symptoms
of PTSD (r = .24, p = .004). Except the moderate correlation with PTD, all of these effects
were weak (Cohen, 1992). PTG was also weakly positively related to avoidance-oriented
coping (r = .18, p = .062) and weakly negatively related to dispositional optimism (r = -.18, p
= .063), although these associations only approached borderline significance.
Hierarchical Regression Analyses
The pooled results of the nested multiple regression models testing our research
questions in the 20 imputed data sets are summarized in Table 3. For brevity, only results
regarding models directly testing our research aims are reported.
Approach- and avoidance-oriented coping as independent predictors of PTG.
Compared to the Baseline Model, the additional inclusion of approach- and
avoidance-oriented coping in Model 1explained another 12% of the variance in PTG and resulted in a
significantly better fitting model, Dm (2, 1649.82) = 7.63, p < .001. Both, a more frequent use
first three months after SCI diagnosis predicted higher levels of PTG at rehabilitation
discharge.
Testing the Janus face of PTG hypothesis. The inclusion of the interaction term of
PTD and approach-oriented coping (β = .03, p = .743) in Model 2 and the one of PTD and
avoidance-oriented coping (β = -.04, p = .656) in Model 3 did not significantly improve the
model fit compared to Model 1.1. Both interaction terms were not statistically significant.
Neither approach- nor avoidance-oriented coping differently predicted PTG depending on
PTD levels.
Testing the coping flexibility hypothesis. InModel 4, the inclusion of the coping
flexibility score (β = .23, p = .012) instead of approach- and avoidance-oriented coping as
independent predictors significantly increased the model fit, Dm (1, 3124.38) = 6.47, p <
.011), compared to the Baseline Model and explained additional 5% of the variance in PTG.
A higher coping flexibility score measured at three months after SCI diagnosis predicted
higher PTG levels assessed at discharge from clinical rehabilitation.
Sensitivity Analyses
Bootstrapping of the 95% confidence interval of the unstandardized regression
coefficients in all regression models supported the findings from above (see supplementary
Table S1). Furthermore, the complete case analysis (n = between 89 and 91 depending on the
model tested) resulted in similar findings as well. However, the effects of symptoms of PTSD
(β between .20 and .29 in Models 1-4), approach-oriented coping (β between .36 and .43 in
Models 1-3), and PTD (β = .44 in Models 2-3) tended to be stronger in the complete case
analyses, whereas the effect of avoidance-oriented coping (β between .02 and .17 in Models
1-3) tended to be weaker (see supplementary Table S2).
The current study examined the role of approach- (i.e., positive reinterpretation,
acceptance, and active coping) and avoidance-oriented coping strategies (i.e., denial) assessed
three months post-injury as predictors of PTG at rehabilitation discharge among individuals
recently diagnosed with an SCI. Supporting previous research (e.g., Helgeson et al., 2006), we
found that both types of coping strategies significantly predicted higher levels of PTG, even
when controlling for initial symptoms of PTSD, social support, and optimism. We then tested
two possible explanations for this finding. First, we did not find empirical support for the
Janus face of PTG hypothesis as an explanation: PTD did neither moderate the effect of
approach- nor avoidance-oriented coping on PTG. In contrast, we found support for the
second explanation, the coping flexibility hypothesis: Coping flexibility significantly
predicted higher levels of PTG.
Degree of PTD and Different Types of Coping Indicating Two Faces of PTG?
We did not find indications that PTG might have reflected different facets in the
current sample which could explain its positive association with both approach- and
avoidance-oriented coping strategies. However, the results of the respective moderation
analyses should be interpreted carefully as the relatively small sample size limited power to
detect small effects (see strengths and limitations section). If replicated in studies with larger
sample sizes, the finding that PTD does not moderate the prediction of PTG by approach- and
avoidance-oriented coping would contradict the reasoning that self-perceived PTG may have
two faces; one that reflects realistic changes resulting from cognitive processing, the other
(ongoing) denial or avoidance of negative changes, as hypothesized in the Janus face model of
PTG (Maercker & Zoellner, 2004; Zoellner & Maercker, 2006) and by Park (1998). In short,
we did not find evidence for another face of PTG besides the one resulting from constructive
cognitive processing, which is indicative of a realistic view on posttraumatic life changes
Coping Flexibility as a Predictor of PTG?
The results supported the coping flexibility hypothesis as an explanation that PTG was
positively related to the use of both approach- and avoidance-oriented coping within the first
three months post-injury. Importantly, our results confirm and expand previous
cross-sectional research finding that flexible coping is positively associated with PTG (e.g., Cohen
& Katz, 2015). A flexible use of approach- and avoidance-oriented coping strategies may thus
enable individuals to process trauma at times, but also to avoid thoughts and activities when
such a confrontation is too overwhelming, which together, may enable the experience of PTG
(see also Janoff-Bulman, 2006). This finding is compatible with Joseph and Linley’s (2005)
PTG model which integrates such a function of avoidance-oriented coping as a means for
distress reduction preceding engagement in cognitive processing.
Considering the solid theoretical background but very limited empirical research
regarding both the Janus face of PTG and the coping flexibility hypotheses, the current study
is as one of the first steps to close those important research gaps. In this respect, this is the
first longitudinal study examining and finding a flexible use of approach- and
avoidance-oriented coping strategies to predict higher PTG levels after potentially traumatic events such
as SCI. Moreover, as we found limited support for the Janus face of PTG hypothesis, we
increased confidence that the potential two facets of PTG being predicted differently by these
types of coping may not serve as an alternative explanation for those findings.
Limitations and future research
This study is subject to several limitations which need to be considered when
interpreting the results. First, we used a limited and unbalanced set of different approach-
(positive reinterpretation, acceptance, active coping) and avoidance-oriented coping strategies
(denial). We operationalized avoidance-oriented coping only with the Brief COPE’s denial
theories about adaptation to the onset of a chronic disability highlight that denial can have
both adaptive (e.g., stress reduction) and maladaptive (e.g., interference with psychosocial
reorganization) functions, depending on the context and the duration of its use (see Livneh,
2009a, for a review). In support of these ideas, denial has been found to be inconsistently
associated with different indicators of psychosocial adaptation (Livneh, 2009b; van Leeuwen,
Kraaijeveld, Lindeman, & Post, 2012). Nevertheless, these findings suggest that denial can act
as a means to reduce distress in this context. However, individuals with SCI also use other
avoidance-oriented coping strategies such as mental disengagement or self-distraction in order
to reduce distress resulting from SCI (e.g., Pollard & Kennedy, 2007). Thus, assessing
avoidance-oriented coping more broadly may reveal stronger effects on PTG, also regarding
the flexibility score. This could be tested in future studies.
Second, our measure of coping flexibility was limited in that higher levels only
indicate that individuals were more likely to have used both approach- and avoidance-oriented
coping strategies since the onset of SCI. However, this does not allow inferences to be made
about when and in which order individuals used the different types of coping. Therefore, an
important avenue for future research is to assess the use of approach- and avoidance-oriented
coping at multiple time points after potentially traumatic events as predictors of subsequent
PTG. This would allow for a better understanding of their interplay in the development of
PTG. Furthermore, future studies could also examine whether the use of different types of
coping in PTG development actually corresponds to situational demands. This would
integrate the concept of coping flexibility, as outlined by Bonanno and Burton (2013), more
fully into PTG research.
Third, operationalizing coping flexibility by using measures which were not
specifically developed to assess coping flexibility is a common practice, but generally reveals
weaker effect sizes than by using instruments specifically designed to measure this construct
the current findings by using specific measures of coping flexibility, such as the PACT scale
(Bonanno et al., 2011), are needed to be able to judge the importance of flexible coping in
PTG development more precisely.
Fourth, the statistical power to detect interaction effects may have been low, favoring
the coping flexibility hypothesis, which tested only main effects, over the Janus face of PTG
hypothesis. Assuming ideal conditions (e.g., perfect reliability), the minimally required
sample size to detect interaction effects is N = 26, 55, and 392 for large, moderate, and small
effect sizes respectively (Cohen, 1988). In practice, however, determining the minimally
required sample size regarding regression models including interaction terms can hardly be
done (Dawson, 2014). Therefore, we relied on the sample size of another study (N = 102)
finding significant interaction terms when examining the Janus face model of PTG (Zoellner,
Rabe, Karl, & Maercker, 2008) and used bootstrapping to increase confidence in the results.
Nevertheless, as measurement error can result in a loss of power (Dawson, 2014), we may
have missed small effects given the limited reliability of our measures of approach- and
avoidance-oriented coping.
Conclusion and Clinical Implications
The results of the current study contribute to a better understanding of the processes
leading to the experience of PTG. We found PTG to be predicted by the prior use of both
approach- and avoidance-oriented coping and the coping flexibility concept to be a suitable
explanation for this finding. Therefore, clinical interventions aiming to foster the experience
of PTG in individuals with SCI or potentially also after other potentially traumatic events
could focus on a coping training, particularly on imparting information about the appropriate
use of both approach- and avoidance-oriented coping strategies. Findings regarding the
relationship between avoidance-oriented coping strategies such as denial and adjustment
more beneficial when such coping strategies are used sparingly and early in the adaptation
process to SCI and other chronic disabilities (Livneh, 2009b). Though negative consequences
may be expected when used constantly, a restricted use of denial and potentially other
avoidance-oriented coping strategies may allow for a temporary reprieve from distress and to
gradually accept the onset of the disability as well as to mobilize other approach-oriented
coping strategies such as positive reappraisal (Livneh, 2009a). Regarding PTG development,
however, more fine-grained research about the temporal and situational dependency of the
adequacy of approach- and avoidance-oriented coping strategies is needed.
References
Baker, J. M., Kelly, C., Calhoun, L. G., Cann, A., & Tedeschi, R. G. (2008). An examination
of posttraumatic growth and posttraumatic depreciation: Two exploratory studies.
Journal of Loss and Trauma, 13, 450-465. doi: 10.1080/15325020802171367
Barnard, J., & Rubin, D. B. (1999). Small-sample degrees of freedom with multiple
imputation. Biometrika, 86, 948-955. doi: 10.1093/biomet/86.4.948
Bonanno, G. A., & Burton, C. L. (2013). Regulatory flexibility: An individual differences
perspective on coping and emotion regulation. Perspectives on Psychological Science,
8, 591-612. doi: 10.1177/1745691613504116
Bonanno, G. A., Pat-Horenczyk, R., & Noll, J. (2011). Coping flexibility and trauma: The
Perceived Ability to Cope With Trauma (PACT) scale. Psychological Trauma:
Theory, Research, Practice, and Policy, 3, 117-129. doi: 10.1037/a0020921
Cann, A., Calhoun, L. G., Tedeschi, R. G., & Solomon, D. T. (2010). Posttraumatic growth
and depreciation as independent experiences and predictors of well-being. Journal of
Loss and Trauma, 15, 151-166. doi: 10.1080/15325020903375826
Retrieved from http://CRAN.R-project.org/package=boot
Carver, C. S. (1997). You want to measure coping but your protocol's too long: Consider the
Brief COPE. International Journal of Behavioral Medicine, 4, 92-100. doi:
10.1207/s15327558ijbm0401_6
Cheng, C., Lau, H.-P. B., & Chan, M.-P. S. (2014). Coping flexibility and psychological
adjustment to stressful life changes: A meta-analytic review. Psychological Bulletin,
140, 1582-1607. doi: 10.1037/a0037913
Cheng, C., Wong, W.-M., & Tsang, K. W. (2006). Perception of benefits and costs during
SARS outbreak: An 18-month prospective study. Journal of Consulting and Clinical
Psychology, 74, 870-879. doi: 10.1037/0022-006x.74.5.870
Chun, S., & Lee, Y. (2008). The experience of posttraumatic growth for people with spinal
cord injury. Qualitative Health Research, 18, 877-890. doi:
10.1177/1049732308318028
Cohen, J. (1988). Statistical power analysis for the behavioral sciences (2nd ed.). Mahwah:
NJ: Lawrence Erlbaum Associates.
Cohen, J. (1992). A power primer. Psychological Bulletin, 112, 155-159. doi:
10.1037/0033-2909.112.1.155
Cohen, J., Cohen, P., West, S. G., & Aiken, L. S. (2003). Applied multiple
regression/correlation analysis for the behavioral sciences (3rd ed.). Mahwah, NJ:
Lawrence Erlbaum Associates.
Cohen, O., & Katz, M. (2015). Grief and growth of bereaved siblings as related to attachment
style and flexibility. Death Studies, 39, 158-164. doi: 10.1080/07481187.2014.923069
Craig, A., Tran, Y., & Middleton, J. (2009). Psychological morbidity and spinal cord injury:
A systematic review. Spinal Cord, 47, 108-114. doi: 10.1038/sc.2008.115
Davison, A. C., & Hinkley, D. V. (1997). Bootstrap methods and their applications.
Dawson, J. F. (2014). Moderation in management research: What, why, when, and how.
Journal of Business and Psychology, 29, 1-19. doi: 10.1007/s10869-013-9308-7
Enders, C. K. (2010). Applied missing data analysis. New York, NY: Guilford Press.
Gangstad, B., Norman, P., & Barton, J. (2009). Cognitive processing and posttraumatic
growth after stroke. Rehabilitation Psychology, 54, 69-75. doi: 10.1037/a0014639
Graham, J. W., Olchowski, A. E., & Gilreath, T. D. (2007). How many imputations are really
needed? Some practical clarifications of multiple imputation theory. Prevention
Science, 8, 206-213. doi: 10.1007/s11121-007-0070-9
Helgeson, V. S., Reynolds, K. A., & Tomich, P. L. (2006). A meta-analytic review of benefit
finding and growth. Journal of Consulting and Clinical Psychology, 74, 797-816. doi:
10.1037/0022-006x.74.5.797
Horowitz, M. J. (1986). Stress response syndromes (2nd ed.). New York, NY: Free Press.
Janoff-Bulman, R. (2006). Schema-change perspectives on posttraumatic growth. In L. G.
Calhoun & R. G. Tedeschi (Eds.), Handbook of posttraumatic growth - Research and
practice (pp. 81-99). Mahwah, NJ: Lawrence Earlbaum Associates.
Joseph, S., & Linley, P. A. (2005). Positive adjustment to threatening events: An organismic
valuing theory of growth through adversity. Review of General Psychology, 9,
262-280. doi: 10.1037/1089-2680.9.3.262
Kapsou, M., Panayiotou, G., Kokkinos, C. M., & Demetriou, A. G. (2010). Dimensionality of
coping: An empirical contribution to the construct validation of the Brief-COPE with a
Greek-speaking sample. Journal of Health Psychology, 15, 215-229. doi:
10.1177/1359105309346516
Kunz, S., Joseph, S., Geyh, S., & Peter, C. (2017). Posttraumatic growth and adjustment to
spinal cord injury: Moderated by posttraumatic depreciation? Psychological Trauma:
Theory, Research, Practice, and Policy, 9, 434-444. doi: 10.1037/tra0000164
after breast cancer: Prevalence, predictors and relationships with psychological health.
Journal of Clinical Psychology in Medical Settings, 17, 14-22. doi:
10.1007/s10880-009-9183-6
Livneh, H. (2009a). Denial of chronic illness and disability: Part 1. Theoretical, functional,
and dynamic perspectives. Rehabilitation Counseling Bulletin, 52, 225-236. doi:
10.1177/0034355209333689
Livneh, H. (2009b). Denial of chronic illness and disability: Part II. Research findings,
measurement considerations, and clinical aspects. Rehabilitation Counseling Bulletin,
53, 44-55. doi: 10.1177/0034355209346013
Maercker, A., & Zoellner, T. (2004). The Janus face of self-perceived growth: Toward a
two-component model of posttraumatic growth. Psychological Inquiry, 15, 41-48.
McNeish, D., & Stapleton, L. M. (2016). Modeling clustered data with very few clusters.
Multivariate Behavioral Research, 51, 495-518. doi:
10.1080/00273171.2016.1167008
Meng, X.-L., & Rubin, D. B. (1992). Performing likelihood ratio tests with multiply-imputed
data sets. Biometrika, 79, 103-111. doi: 10.1093/biomet/79.1.103
Park, C. L. (1998). Implications of posttraumatic growth for individuals. In R. G. Tedeschi, C.
L. Park & L. G. Calhoun (Eds.), Posttraumatic growth: Positive changes in the
aftermath of crisis (pp. 149-172). Mahwah, NJ: Lawrence Erlbaum Associates.
Park, C. L., Riley, K. E., & Snyder, L. B. (2012). Meaning making coping, making sense, and
post-traumatic growth following the 9/11 terrorist attacks. The Journal of Positive
Psychology, 7, 198-207. doi: 10.1080/17439760.2012.671347
Pat-Horenczyk, R., Saltzman, L. Y., Hamama-Raz, Y., Perry, S., Ziv, Y., Ginat-Frolich, R., &
Stemmer, S. M. (2016). Stability and transitions in posttraumatic growth trajectories
among cancer patients: LCA and LTA analyses. Psychological Trauma: Theory,
Pollard, C., & Kennedy, P. (2007). A longitudinal analysis of emotional impact, coping
strategies and post-traumatic psychological growth following spinal cord injury: A
10-year review. British Journal of Health Psychology, 12, 347-362. doi:
10.1348/135910707x197046
Prati, G., & Pietrantoni, L. (2009). Optimism, social support, and coping strategies as factors
contributing to posttraumatic growth: A meta-analysis. Journal of Loss and Trauma,
14, 364-388. doi: 10.1080/15325020902724271
Roth, S., & Cohen, L. J. (1986). Approach, avoidance, and coping with stress. American
Psychologist, 41, 813-819. doi: 10.1037/0003-066x.41.7.813
Rubin, D. B. (1987). Multiple imputation for nonresponse in surveys. New York, NY: Wiley.
Shand, L. K., Cowlishaw, S., Brooker, J. E., Burney, S., & Ricciardelli, L. A. (2015).
Correlates of post-traumatic stress symptoms and growth in cancer patients: A
systematic review and meta-analysis. Psycho-Oncology, 24, 624-634. doi:
10.1002/pon.3719
Taylor, S. E., & Stanton, A. L. (2007). Coping resources, coping processes, and mental
health. Annual Review of Clinical Psychology, 3, 377-401. doi:
10.1146/annurev.clinpsy.3.022806.091520
Tedeschi, R. G., & Calhoun, L. G. (2004). Posttraumatic growth: Conceptual foundations and
empirical evidence. Psychological Inquiry, 15, 1-18. doi:
10.1207/s15327965pli1501_01
Thoresen, S., Tambs, K., Hussain, A., Heir, T., Johansen, V. A., & Bisson, J. I. (2010). Brief
measure of posttraumatic stress reactions: Impact of Event Scale-6. Social Psychiatry
and Psychiatric Epidemiology, 45, 405-412. doi: 10.1007/s00127-009-0073-x
Tillmann, R., Voorpostel, M., Kuhn, U., Lebert, F., Ryser, V.-A., Lipps, O., . . . Antal, E.
(2016). The Swiss Household Panel Study: Observing social change since 1999.
10.14301/llcs.v7i1.360
Val, E. B., & Linley, P. A. (2006). Posttraumatic growth, positive changes, and negative
changes in Madrid residents following the march 11, 2004, Madrid train bombings.
Journal of Loss and Trauma, 11, 409-424. doi: 10.1080/15325020600685519
Van Buuren, S. (2012). Flexible imputation of missing data. Boca Raton, FL: Chapman &
Hall/CRC Press.
van Buuren, S., & Groothuis-Oudshoorn, K. (2011). mice: Multivariate imputation by chained
equations in R. Journal of Statistical Software, 45, 1-67. doi: 10.18637/jss.v045.i03
van Leeuwen, C. M., Kraaijeveld, S., Lindeman, E., & Post, M. W. (2012). Associations
between psychological factors and quality of life ratings in persons with spinal cord
injury: A systematic review. Spinal Cord, 50, 174-187. doi: 10.1038/sc.2011.120
von Elm, E., Altman, D. G., Egger, M., Pocock, S. J., Gotzsche, P. C., & Vandenbroucke, J.
P. (2007). The Strengthening the Reporting of Observational Studies in Epidemiology
(STROBE) statement: Guidelines for reporting observational studies. The Lancet, 370,
1453-1457. doi: 10.1016/s0140-6736(07)61602-x
von Hippel, P. T. (2009). How to impute interactions, squares, and other transformed
variables. Sociological Methodology, 39, 265-291. doi:
10.1111/j.1467-9531.2009.01215.x
Weiss, D., & Marmar, C. (1997). The Impact of Event Scale-Revised. In J. P. Wilson & T. M.
Keane (Eds.), Assessing psychological trauma and PTSD: A practitioner's handbook
(pp. 399-411). New York, NY: Guilford Press.
World Health Organization. (2013). International perspectives on spinal cord injury. Geneva,
Switzerland: WHO Press.
Zoellner, T., & Maercker, A. (2006). Posttraumatic growth in clinical psychology: A critical
review and introduction of a two component model. Clinical Psychology Review, 26,
Zoellner, T., Rabe, S., Karl, A., & Maercker, A. (2008). Posttraumatic growth in accident
survivors: Openness and optimism as predictors of its constructive or illusory sides.
Journal of Clinical Psychology, 64, 245-263. doi: 10.1002/jclp.20441
[image:26.595.73.519.288.527.2]Tables
Table 1
Demographic and Injury-related Characteristics of the Sample (N = 122)
Characteristic n (%) M SD n (%) missing
Age at injury in years 54.30 16.48 0
Gender 0
Male 87 (71.3)
Female 35 (28.7)
Marital status 0
Single (never married) 34 (27.9)
Married 70 (57.4)
Widowed 6 (4.9)
Divorced 12 (9.8)
Duration of clinical rehabilitation in days 160.85 57.24 0
Type of injury 8 (6.6)
Incomplete paraplegia 50 (41.0) Complete paraplegia 24 (19.7) Incomplete tetraplegia 33 (27.1) Complete tetraplegia 6 (4.9)
Table 2
Distributional Properties and Pooled Correlation Coefficients of the Study Variables (N = 122)
Construct n (%) missinga α M SD Range 1. 2. 3. 4. 5. 6. 7. 8.
1. PTG 15 (12.3) .88 20.02 11.71 2-47 - .24** .18 .20* .46*** .28** -.03 -.18
2. Approach coping 4 (3.3) .76 17.68 3.98 6-24 - -.27** .69*** -.22* -.14 .15 .43***
3. Avoidance copingb 0 .75 9.39 4.85 6-24 - .16 .41*** .27** -.13 -.27**
4. Coping flexibility 4 (3.3) - - - .05 .04 -.06 .14
5. PTD 17 (13.9) .89 10.33 10.04 0-50 - .37*** -.20* -.41***
6. Symptoms of PTSD 9 (7.4) .72 7.30 4.53 0-24 - -.17 -.39***
7. Social support 5 (4.1) .77 7.21 2.18 0-10 - .32***
8. Optimism 3 (2.5) - 8.37 1.86 0-10 -
Note. α, M, SD, and range rely on unimputed data and correlations on imputed data. PTG = posttraumatic growth. PTD = posttraumatic
depreciation. PTSD = posttraumatic stress disorder.
a n (%) participants with missing values in one or more items composing the scale. b Because coping flexibility is calculated as the proportion of
approach (six items on a scale from 1-4) and avoidance coping (two items on a scale from 1-4), we multiplied the avoidance coping sum score by 3
to make the distributional characteristics comparable to the ones of approach coping.
* p < 0.05. ** p < 0.01. *** p < 0.001.
Table 3
Pooled Results of Hierarchical Multiple Regression Analyses Testing Incremental Prediction of PTG
Model 1 Model 2 Model 3 Model 4
Predictor β FMI β FMI β FMI β FMI
Social support .04 .13 .08 .15 .08 .16 .07 .12
Optimism -.16 .24 -.09 .28 -.08 .22 -.12 .23
Approach coping .30** .17 .32*** .20 .32*** .22 - -
Avoidance coping .23* .13 .11 .24 .12 .27 - -
PTD .30** .39 .30** .40 - -
Approach coping x PTD .03 .18 - - - -
Avoidance coping x PTD -.04 .55 - -
Coping flexibility .23* .08
∆R2 .12 .00 .01 .05
R2 .28 .38 .39 .21
(df1, df2) Dm (2, 1649.82) 7.63*** (1, 501.22) 0.11 (1, 54.05) 0.20 (1, 3124.38) 6.47*
Comparison Model 1 vs Baselinea Model 2 vs Model
1.1b
Model 3 vs Model 1.1b
Model 6 vs Baselinea
Note. All models were adjusted for between clinic variance (results not exposed). PTSD = posttraumatic stress disorder. PTD = posttraumatic
depreciation. β = standardized regression coefficient. FMI = fraction of missing information. ∆R2 = increase in explained variance. R2 = proportion
of explained variance. df = degrees of freedom. Dm = Wald test statistic.
a Baseline Model = including the dummy-coded rehabilitation centers, symptoms of PTSD, social support and optimism as predictors. b Model 1.1 =
including the dummy-coded rehabilitation centers, symptoms of PTSD, social support, optimism, approach- and avoidance-oriented coping, and
PTD as predictors.
Figure
Figure 1. Flow diagram depicting participation in the current study.
Consent to LS (n =318)
Completing T1, T2, and T4
assessments sequentially (n =
244)
Completing T1 assessment (n =
165)
Completing T2 assessment (n =
144)
Completing T4 assessment (n =
132)
At least one item of the scales at
T2 and T4 answered (n =122)
Measurement occasion collapsed (n = 74):
- T1 and T4 collapsed (n = 15)
- T2 and T4 collapsed (n = 59)
T1 not completed (n = 79):
- Informed consent after T1 (n = 58)
- Consent withdrawal (n = 6)
- Sudden discharge (n = 6)
- Back to acute care (n = 3)
- Language problems (n = 3)
- Other (n = 3)
T2 not completed (n = 21):
- Discharge before T2 (n = 14)
- Consent withdrawal (n = 5)
- Other (n = 2)
T4 not completed (n = 12):
- Consent withdrawal (n = 6)
- Sudden discharge (n = 4)
- Other (n = 2)
One scale completely missing (n = 10):
- Brief COPE (n = 7)