Root gravitropism: Quantification, challenges and solutions
Lukas Muller, Malcolm J Bennett, Andy French, Darren M. Wells and Ranjan Swarup Centre for Plant Integrative Biology and School of Biosciences, University of Nottingham, Sutton Bonington Campus, Loughborough. UK. LE12 5RD
Abstract
Better understanding of root traits such as root angle and root gravitropism will be crucial for development of crops with improved resource use efficiency. This paper describes a high-throughput, automated image analysis method to trace Arabidopsis (Arabidopsis thaliana) seedling roots grown on agar plates. The method combines a ‘particle-filtering algorithm with a graph-based method’ to trace the centre line of a root and can be adopted for the analysis of several root parameters such as length, curvature, and stimulus from original root traces.
Key words Root gravitropism, RooTrace, Image analysis, Arabidopsis
Introduction
Environmental signals can have profound impact on plant growth and development. Plants have evolved sophisticated mechanisms to respond to these signals. For example, in response to gravity, shoots and roots of higher plants modify their direction of growth by employing tropic responses. Root gravitropism enables plants to explore the soil environment and acquire anchorage and resources and therefore has a direct bearing on crop productivity. Better understanding of root traits such as root angle and root gravitropism will be crucial for development of crops with improved resource use efficiency.
experiments suggest that the columella cells in the root cap are the site of gravi-perception. A large body of genetic and physiological evidence suggest a crucial role for starch-filled plastids (termed statoliths) in columella cells for gravity perception (reviewed in Swarup et al 2013).
Upon gravity perception, a signal is generated in the columella cells which is then transmitted through the lateral root cap cells to the gravi-responsive tissues of the elongation zone. Genetic and cell biology approaches have now established that this signal is plant hormone auxin reviewed in Swarup et al (2013).
Plastid sedimentation results in asymmetric release of auxin in the columella cells (Boonsirichai et al, 2003; Ottenschlager et al, 2003; Rashotte et al, 2001; Swarup and Bennett 2009). The resulting auxin gradient is transported from columella cells via the lateral root cap to the gravitropic responsive tissues in the elongation zone (Swarup et al, 2005) where auxin inhibits cell expansion on the lower side thus causing differential growth resulting in root bending.
whereas Swarup et al (2005) acquired images every 30 minutes over an eight hour period.
With advances in imaging techniques and refinement in image acquisition software, several software packages have been developed for root architectural traits analysis including root gravitropism (Basu et al., 2007, Chavarrıa-Krauser et al 2007; Qi et al., 2007). Many of these packages required the use of high resolution images or considerable user intervention.
Later French et al (2009) developed a high-throughput, automated image analysis package termed RootTrace to trace Arabidopsis seedling roots grown on agarose plates. The method combines a ‘particle-filtering algorithm with a graph-based method’ to trace the centre line of a root. Additional software can quantify several root parameters including length and curvature from original root traces. This package is simple, fast, and robust and does not require high resolution images. It does however require suitably-captured images of light roots on a dark background, and the roots to not be overlapping. It also makes assumptions about the growth of the root – namely that roots should be generally growing from top to bottom on the image plane. It does not measure architecture – for this we refer the reader to our RootNav tool (http://www.plantphysiol.org/content/162/4/1802.full). For detailed requirements see French et al (2009) and accompanying software documentation.
Materials
1. Growth medium
Any suitable agar based growth medium can be used for these assays. We typically use full strength Murashige and Skoog (MS) media (4.3g/L) supplemented with 1% sucrose but ½ or even ¼ strength MS medium with or without sucrose can also be used.
2. Petri plates (preferably square) 3. Laminar flow cabinet
4. Bleach for seed surface sterilization
We typically use 50% sodium hypochlorite solution for surface sterilisation of Arabidopsis seeds but lower sodium hypochlorite solutions (5-25%) have also been reported.
5. 70% (v/v) ethanol
6. Sterile Whatman filter paper 7. Suitable growth room
Typically for Arabidopsis we use 20±2°C with 16h photoperiod; 100 μE light intensity).
Methods
Growth Media
To prepare full strength MS medium supplemented with 1% sucrose, dissolve 4.3g of MS salts and 10 g of sucrose in approximately 800 mL of distilled water. Adjust the pH to 5.8 using 1 M KOH and make up the volume to 1L with distilled water. Dispense the media into bottles, add bacto-agar (10 gram/L) and autoclave. Upon sterilisation, the media is cooled to about 50°C and is poured into sterile petri plates (for a standard 15 cm square petri plate, 50 mL is sufficient). Once set, plates can be stored at 4°C for a couple of weeks (or even longer).
Seed sterilisation
Aliquot Arabidopsis seeds in an Eppendorf tube (1.5 ml) and add approximately 1 ml of bleach solution. Mix well and incubate at room temperature for 7 to 8 minutes. Fill the tube with approximately ½ ml of water containing 0.15% Triton X-100 (or similar surfactant) and mix well. Allow the seeds to settle to the bottom of the tube and then decant the solution in a waste bottle carefully. Fill the tube again with water containing Triton X-100, mix well and then allow the seeds to settle. Decant the solution in a waste bottle. Repeat the last step one more time with water containing Triton X-100 and then two to three more times with pure distilled water (no Triton X-100). Squirt the seeds on a sterile Whatman number 1 filter paper using 70% ethanol. Allow the seeds to air dry for about 30-40 minutes in a laminar flow hood (see note 1).
Plating
Use a sterile scalpel to unstuck the seeds from the filter paper and plate them in a row on MS agar medium with gentle tapping. A Gilson pipette can also be used to place the water-suspended sterile seeds (no ethanol wash) in a row on MS plates (see note 1). Vernalise the seeds in dark at 4°C for 2 days
Root gravitropism assay
Transfer the plates to a suitable growth room (typically for Arabidopsis we use 20±2°C with 16h photoperiod; 100 μE light intensity) and place them vertically.
Seedlings are grown vertically for 4 days on MS plates and the plates are then turned at an angle of 90°. Photographs are taken every ten minutes for up to 24 hrs (See note 2).
Image analysis
The images can be analysed for root gravitropic curvature using either RooTrace software or using manual image analysis.
A. Using Root Trace software
Root Trace software is available from https://sourceforge.net/projects/roottrace
Open RootTrace software
Click Advanced
Click Invert box if necessary (for images taken using infra-red camera, i.e. dark
roots on a light background)
Click Rotation if necessary (Clockwise or anticlockwise). The roots should be
straight down.
Click Tip angle box
Import images (Tip: Normally no more than 20 images are required. Gravitropic
response will be finished in 6 hours. We routinely select 3 images every 30
minutes, up to six hours or 2 images every hour up to 8 to 10 hours).
Identify a region with up to 10 roots per analysis (avoid roots that are too close to
each other). Crop the image to include the selection.
Mark start points for the tracing. To do this, right click somewhere further up the
root from the tip. RootTrace will trace downwards from this point. Do this for every root.
The next step is to define the background near each root; this allows the software
to learn what the background appears like near each root. To do this, left-drag and make a square next to the root tip (TIP it is best to drag the mouse top left to bottom right). This step needs to be done for all the selected roots. (TIP Order matters – select the background in the same order as you selected the root tips.
them. Make sure the background numbers correspond to the root numbers in the
image in the software).
Click the Misc tab, and change the tip point to fit setting to 6. Note, this affects
the distance back from the tip than RootTrace will fit a line through, in order to measure an angle for the tip. Smaller distances mean a quicker response to root angle changes, at the cost of more susceptibility to noise.
Make a new folder for data (create a folder in the same folder where the images are; calling the folder ‘output’ is good practice, and if it exists before loading the images, RootTrace will automatically set it as a folder to store output files.)
Go to the main menu and click GO to run the software.
Once it is complete, check each image for tip angle tracking. Angles will be
shown as orange lines offset from the root, and represent the detected angle of the tip, and if it looks correct, you can optionally delete all the tracked photos from this newly created folder (not the originals) as well all curvature files. The aim is to ensure tracking has been successful, to ensure the correct points are measured for the tip angles.
Multiple output files are produced. The data of interest for this work will be saved in an XL CSV file called ‘tip angle to vertical’.
You should delete all the data for all the roots that have not been correctly
tracked (as judged above).
Troubleshooting
RootTrace was originally designed to track roots growing under normal growth conditions i.e. without rotating the plate for gravitropism. If tracking the root to the tip becomes a problem tracking may fail.
For example, in Figure 1, at places root becomes almost transparent and thus causing tracking to fail. To overcome this, consider:
[image:9.612.82.213.220.570.2] Do you need to track to the tip? Tracking just the time points whilst the bend is
evolving may be sufficient. You can identify this point on the output images or in the Excel data.
Rotating the images by 45 degrees can improve tracking success round the
[image:10.612.189.421.362.592.2]corners. Of course, final angles in the output files must be adjusted accordingly (Figure 2).
Selecting Advanced -> ‘End Detection version #2’ forces the software to use an
alternative algorithm to detect the ends of the roots. If the software does not initially track well to the root tips, experiment with this setting.
B. Manual Image Analysis
1. For manual image analysis, take images every 30 minutes. (We typically take images every 30 minutes up to 8-10 hours and then also take an image at 24 hr) 2. Measure the root angle using a protractor.
3. Do this for every root in all the images for all the samples/treatments.
4. The data can be presented as individual wheel diagrams (Swarup et al 2004) or as a time series (Swarup et al 2005).
5. For wheel diagram we routinely group the roots in 40 degrees angles (0-40, 40-80, 80-120 etc and express them as percentage of roots bending at a given angle group. The size and the angle of the bar represent percentage of roots and angle respectively (Figure 3).
145° 180°
103° 140°
137° 82°
83°
86°
88°
0 180
270
90 90
0 180
270
Sample i
Sample ii
A
hr 0 1 2 3 4 5 6
g
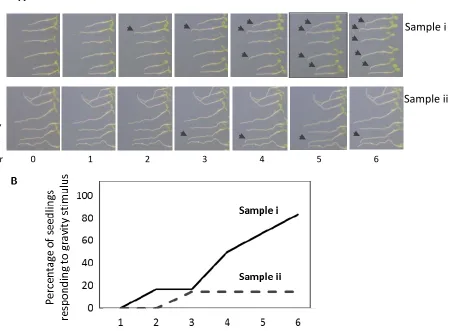
6. To express the data as a time series, individual wheel diagrams are done for every sample/treatment for all the time points and then all the data is condensed into one graph (time series) by calculating number of roots responding to the gravity stimulus at any given time (Figure 4).
[image:12.612.85.537.436.767.2]Figure 4. Manual quantification of root bending kinetics. Root bending kinetics can be calculated from different time point images. In this example, images were taken every hour after the gravity stimulus (A) and the bending of root kinetics shown as percentage of root responding to the gravity stimulus (B). Arrowhead indicates the roots responding to the gravity vector.
Acknowledgement
We acknowledge support from Biological and Biotechnological Science Research Council (BBSRC) the European Research Council (ERC), Royal Society and Newton International and Advanced Fellowship awards.
References
Basu P, Pal A, Lynch JP, Brown KM (2007) A novel image analysis technique for kinematic study of growth and curvature. Plant Physiol, 145: 305–316
Blancaflor EB, Fasano JM and Gilroy S (1998) Mapping the functional roles of cap cells in the response of Arabidopsis primary roots to gravity. Plant Physiology 116, 213-222. Boonsirichai K, Sedbrook JC, Chen RJ, Gilroy S and Masson PH (2003) ALTERED RESPONSE TO GRAVITY is a peripheral membrane protein that modulates gravity-induced cytoplasmic alkalinization and lateral auxin transport in plant statocytes. Plant Cell 15, 2612-2625.
French, A, Ubeda-Tomás, S, Holman, T.J., Bennett, M.J. and Pridmore, T. (2009). High-throughput quantification of root growth using a novel image-analysis tool. Plant Physiol, 150, 1784.
Knight, TA (1806) On the direction of the radicle and germen during the vegetation of seeds. Philosophical Transactions of the Royal Society, London – Biological Sciences 99, 108–120.
Murashige T and Skoog F (1962) A Revised Medium for Rapid Growth and Bio Assays with Tobacco Tissue Cultures. Physiologia Plantarum, 15, 473-497.
Naeem, A. French, AP., Wells D.M.and Pridmore, T (2011) High-throughput feature counting and measurement of roots. Bioinformatics, 27, 1337.
Ottenschlager I, Wolff P, Wolverton C, Bhalerao RP, Sandberg G, Ishikawa H, Evans M and Palme K (2003) Gravity-regulated differential auxin transport from columella to lateral root cap cells. Proceedings of the National Academy of Sciences of the United States of America 100, 2987-2991.
Rashotte AM, DeLong A and Muday GK (2001) Genetic and chemical reductions in protein phosphatase activity alter auxin transport, gravity response and lateral root growth. Plant Cell 13, 1683-1697.
Sato EM, Hijazi H, Bennett MJ, Vissenberg K, Swarup R (2015) New insights into root gravitropic signalling. J Exp Bot, 66, 2155-2165.
Swarup R and Bennett MJ (2014) Auxin Transport: Providing plants with a new sense of direction. Biochemist 36, 12-16.
Swarup R, Wells D, Bennett MJ. 2013. Root gravitropism. In: Eshel A, Beeckman T, eds. The hidden half. IV ed.: CRC Press, pp 19-34.
Swarup R, Péret B. 2012. AUX/LAX family of auxin influx carriers-an overview. Frontiers in Plant Science 3, 225.
Swarup R, Bennett MJ. 2009. Root gravitropism. Annual Plant Reviews 37, 157-174. Swarup R, Kramer E, Perry P, Knox K, Leyser HMO, Haseloff J, Beemster G, Bhalerao R and Bennett M (2005). Root gravitropism requires lateral root cap and epidermal cells for transport and response to a mobile auxin signal. Nature Cell Biol, 7, 1057-1065
Qi X, Qi J, Wu Y (2007) RootLM: a simple color image analysis program for length measurement of primary roots in Arabidopsis. Plant Root 1: 10–16