For Peer Review
HOW TOURISTS CHOOSE THEIR DESTINATIONS: Evaluating choice strategies and methods of their
measurement
Journal: Journal of Travel Research
Manuscript ID: JTR-15-07-37
Manuscript Type: Empirical Research Articles
Keywords: Tourist decision making, non-compensatory strategies, greedoid estimation method, China outbound
Abstract:
A detailed understanding of consumers’ choice strategies is essential in order to explain and predict consumption patterns, yet they have been somewhat neglected in tourism research. This study utilised an
experimental research design to investigate two types of choice strategies in tourists’ destination choices, applying an innovative method, greedoid analysis, to estimate and infer a typical non-compensatory choice strategy (lexicographic by aspect [LBA]). The paper explores possible indicators for evaluating models of different choice strategies. The data were obtained from Chinese long-haul outbound tourists. The findings suggest the LBA model estimated by greedoid method offers potential advantages over weighted compensatory strategy for understanding tourists’ preferences, as it performs better in replicating the observed preference order compared to compensatory choice models.
For Peer Review
HOW TOURISTS CHOOSE THEIR DESTINATIONS:Evaluating choice strategies and methods of their measurement
ABSTRACT
A detailed understanding of consumers’ choice strategies is essential in order to explain and predict consumption patterns, yet they have been somewhat neglected in tourism research. This study utilised an experimental research design to investigate two types of choice strategies in tourists’ destination choices, applying an innovative method, greedoid analysis, to estimate and infer a typical non-compensatory choice strategy (lexicographic by aspect [LBA]). The paper explores possible indicators for evaluating models of different choice strategies. The data were obtained from Chinese long-haul outbound tourists. The findings suggest the LBA model estimated by greedoid method offers potential advantages over weighted compensatory strategy for understanding tourists’ preferences, as it performs better in replicating the observed preference order compared to compensatory choice models.
Keywords: Tourist decision making, non-compensatory strategies, greedoid estimation method, China outbound.
For Peer Review
INTRODUCTIONMuch of the research done on destination decision making has focused on understanding the attributes that tourists consider important and how they evaluate them (e.g. Haahti, 1986; Go & Zhang, 1997; Basala & Klenosky, 2001; Beerli & Martin, 2004), whereas much less attention has been given to the choice strategies tourists employ in making those decisions. Indeed, a recent review found that most of the theory developed in this area has been based on a variance perspective, which focuses only on the decisions made, at the expense of understanding the processes by which decisions are reached, and this has constrained theory building in relation to tourism consumer
behaviour (Smallman & Moore, 2010). Recent pleas have been for additional process-tracking methods to build and extend theories of tourism decision making (Sirakaya & Woodside, 2005).
Beyond the confines of tourism, choice theory is a well-established aspect of buyer decision theory (Howard & Sheth, 1969; Spiggle & Sewell, 1987). Yet empirical studies on choice strategies remain sparse, largely because the concept of ‘choice strategy’ has been deemed rather abstract. Additionally, the use of choice strategies is likely to vary according to different contexts (Crompton, 1992; Crompton & Ankomah, 1993) making replication
problematic. The abstract nature of the problem requires advanced methods of analysis that are able to approximate the relevant mental processes, and these have only recently been developed. Furthermore, data collection in this area should ideally account for the contextual application of a range of rule types, particularly since tourism is a broad, multifaceted phenomenon. For instance, some tourism decisions are not characterised by
high-involvement, considerable information search and deliberative evaluation of alternatives, whereas others clearly are (Crompton, 1992; Mansfield, 1992). 3
For Peer Review
It is therefore necessary both to derive a series of choice strategy models and to test their empirical fit across a range of scenarios.
The majority of studies that have specifically examined tourists’ evaluation processes are predicated on a single (albeit popular) type of decision making, known as the weighted additive strategy, which is fundamentally predicated on the assumption that tourists are rational and utility maximizers (e.g. Woodside & Lysonski, 1989; Papatheodorou, 2001; Seddighi & Theocharous, 2002). Therefore, tourists’ preferences revealed from previous empirical studies are estimated and explained as to how much utility/influence each attribute level has on a decision (e.g. Basala & Klenosky, 2001; Suh & Gartner, 2004; Tsaur & Wu, 2005; Ciná, 2012). The result is that other types of
possible choice strategies have been largely overlooked, although there are some notable exceptions in which tourists’ decision-making strategies have been studied in the context of shopping and transportation (Au & Law, 2000; Law & Au, 2000; van Middelkoop, Borgers, & Timmermans, 2003). However, the general applicability of the weighted additive strategy has been
questioned. For instance, due to cognitive limitations, consumers have been shown to use simplified strategies, based on non-compensatory preferences in order to make judgements and decisions quickly and efficiently (Yee, Dahan, Hauser & Orlin, 2007).
In the general area of destination decisions however, a literature search suggests that no empirical study has evaluated different choice strategies, despite recent theoretical advances which have pointed out a range of possible approaches (Decrop & Kozak, 2009). Consequently there has been little critical attempt to unpack what types of decision-making strategies tourists employ in selecting a destination. This represents a crucial gap in knowledge concerning an important, arguably the predominantly important, aspect of decision-making processes in tourism. It is for these reasons that 3
For Peer Review
this paper aims to contribute to this knowledge gap by: 1) investigating the utilization of another typical choice strategy by tourists (non-compensatory choice, which is not based on utility maximization); 2) exploring an
innovative method (greedoid analysis) that can be effectively applied to estimate non-compensatory choice strategies empirically, and; 3)
introducing two promising indicators to evaluate model fit to different choice strategies. Thus this study aims to contribute valuable insights on explaining, understanding and predicting tourists’ choice preference from a
non-compensatory perspective and offers a systematic method to empirically capture different mental mechanisms of tourism decision making.
HOW DOES A TOURIST CHOOSE A DESTINATION?
Among so many alternative destinations, how does a tourist decide on one in particular? The mental processes underlying decision-making are called choice strategies, and in relation to destination choice can be complex, and as such have been the subject of research for decades (e.g. Recker & Schuler, 1981; Woodside & Lysonski, 1989; Um & Crompton, 1990; Mansfield, 1992; Morley, 1994; Jang & Cai, 2002; Seddighi & Theocharous, 2002;
Rewtrakunphaiboon & Oppewal, 2008; Decrop, 2010). Tourists selecting a destination will necessarily resort to a choice strategy (perhaps
unconsciously), to make comparisons consistent, to work out their preference order among the alternatives and eventually to make a final choice. Although theoretically, tourists may evaluate destinations in a holistic sense (Decrop & Kozak, 2009), often tourists do not derive utility by
possessing or using travel destinations as a whole, but by consuming
destination related attributes (e.g. transport, accommodation and attractions) (Morley, 1992; Tussyadiah, Kono & Morisugi, 2006). Therefore, in the context of this study, we refer to choice strategies as the ways in which the
destination attributes are considered and evaluated. 3
For Peer Review
An important feature that can be used to distinguish between choice strategies is whether trading-off among attributes is allowed by decision makers. If values on different attributes can be traded off against one another, the choice strategy is said to be compensatory. Otherwise, the strategies are non-compensatory (Abelson & Levi, 1985). According to the compensatory choice approach, the process requires decision makers to evaluate
alternatives across a number of different attributes where a perceived negative value of one attribute can be compensated by positive values of other attributes (Svenson, 1979). The weighted additive strategy is a typical compensatory strategy which seeks to adjust for the importance attached to each attribute by weighting its utility value, and only then are the utility values of all attributes summed, before the alternative with maximum utility is selected (Wright, 1975).
However, as the numbers of destinations and attributes increase,
compensatory strategies, especially the weighted additive strategy, demand complex cognitive processing on the part of the decision-maker (Crompton & Ankomah, 1993). The issue of information overload is becoming ever more pertinent in the current digital and globalised era, since tourists have a massive amount of available information about a very large number of destinations. However, the extent of information search and processing may also vary (Hyde, 2008). In some emerging market contexts, where tourists have a limited amount of experience of travel to long-haul destinations, comprehensive evaluation based on such complex problem-solving may be substituted by strategies which require less information processing.
Additionally, due to the intangibility of tourism products, destination choice may sometimes be based less on objective criteria and more on an expected set of experiences (Smallman & Moore, 2010). Therefore, whilst objective criteria such as cost (price) are relevant and are effective in modelling 3
For Peer Review
destination choice, some criteria may tend towards less on quality of the product and more on the desired experience or impressions about places. These attributes are associated with emotions rather than cognitive processing, implying that the absence of a certain attribute may generate sufficient negative emotion for tourists to avoid using a compensatory
strategy. For instance, the idea of trading off an attribute such as the safety of a destination against other attributes can provoke significant negative
emotions (Drolet & Luce, 2004). These characteristics make the arena of destination choice a promising context to investigate the use of simpler non-compensatory strategies. The literature distinguishes between three classic types of non-compensatory decision strategies: conjunctive, disjunctive and lexicographic (Abelson & Levi, 1985; Bettman, Johnson & Payne, 1991).
The conjunctive strategy is also called the satisficing strategy (Rossi & Allenby, 2003). It assumes that decision-makers define minimum cut-off points for several important attributes. If an alternative falls below any of the cut-off points, it is rejected. In a tourism context, a destination would be selected only if minimum cut-off points on all important attributes are exceeded. The disjunctive strategy also requires a set of cut-off points on the attributes. In contrast to the conjunctive strategy, an alternative may be accepted when it has at least one value greater than the corresponding cut-off. The disjunctive strategy is often used to screen a wide range of
alternatives to generate a smaller, more manageable consideration set in which each alternative surpasses a threshold on at least one criterion. These two strategies do not require any ranking or weighting of attributes by the decision-maker. However, in many decision making contexts, the evaluation attributes considered by decision makers are not equally important. When attributes are rank ordered in importance, they are said to be in
lexicographic order (Laroche & Kim, 2003). 3
For Peer Review
The lexicographic strategy proposes that individuals compare attributes amongst alternatives in a stepwise fashion (Crompton & Ankomah, 1993). When the attributes are categorical in nature, such as the mode of transport used to reach the destination (unlike price, say, which is continuous in nature), the LBA strategy is likely to be employed. For each attribute the corresponding ‘aspects’ are determined and these are rank ordered to determine the decision maker’s preference (Dieckmann, Dippold & Dietrich, 2009). For example, for the attribute ‘mode of transport’, the aspect can be ‘bus’, ‘plane’, ‘car’, etc. A decision-maker then starts with the most important attribute, and only the alternatives possessing the desired attribute aspect are selected for further consideration. When there are ties, the decision maker continues the comparison based on the second most important attribute aspect. This selection process is repeated until all alternative destinations have been sorted, and the top-ranked destination is the final choice. The hierarchical order of these aspects that decision makers use to make the selection is termed the ‘aspect order’.
It is evident that choice strategies differ in terms of how much effort they require (Bettman et al., 1991). Tourists using a lexicographic choice strategy make less effort in sorting information than those using a weighted
compensatory strategy. According to Sen (2003), different choice strategies often lead to different choices. Therefore, investigation of the choice
strategies used by decision-makers is fundamental for us to get a clear insight into tourism decision-making behaviour.
METHODOLOGY AND STUDY DESIGN
Multi-criteria choice modelling methods
Besides those studies previously mentioned that have focused on identifying the attributes involved in tourism decision making, efforts have been made to 3
For Peer Review
model destination choice through different estimation methods, including; various regression analyses (e.g. Morley, 1994; Seddighi & Theocharous, 2002), the AHP analysis (Analytic Hierarchy Process) (e.g. Hsu, Tsai, & Wu, 2009) and conjoint analysis (e.g. Ciná, 2012).
Regression analysis is used to estimate how the value of total preference of destinations changes when any one of the relevant attributes varies. If the final choice of tourists is formulated either in terms of whether or not a certain destination is chosen (dichotomous variable) or, which destination among a few options is chosen (categorical variable), it is possible to use logistic regression, also known as a logit model, to find out the possibility of each outcome based on the independent variables (the predictors).
Regression analyses simplify the complex mental decision-making process into an causal-effect relationship between independent variables and dependent variables. The literature is dominated by this kind of causal
analysis of independent variables explaining choices by tourists (Smallman & Moore, 2010). The simplification enables statistical calculations for such a complex problem but it does not allow explanatory insights concerning the true process of tourist’s decision-making (Li, 2013).
Compared with regression analyses, the AHP analysis explains the decision-making as a hierarchical comparison process in which the decision criteria (attributes) can be divided into several layers of sub-criteria. This method estimates the relative important of attributes within the hierarchical structure by conducting a series of paired comparisons (Hsu et. Al., 2009). Although the paired comparison for respondents at each stage is quite simple, the workload could be huge if there were a large number of attributes within one category. If for example there are 9 attributes within the same superior criterion, then decision makers would need to complete 45 comparisons to ensure all the attributes are compared. Additionally, where there is a large 3
For Peer Review
number of alternatives, the number of comparisons among alternatives regarding each attribute’s quality score would be too complex (Li, 2013).
Conjoint analysis is one of the most popular market research tools used to determine what combination of attributes has most influence on respondent choice by estimating the values or part-worth of each attribute (Dieckmann et al., 2009). It has also been widely applied in tourism contexts (e.g. Basala & Klenosky, 2001; Suh & Gartner, 2004; Ciná, 2012). The popularity of conjoint analysis could be due to three reasons: 1) it can estimate the contributions of different attributes to respondents’ choice in terms of direction and
magnititude. 2) Conjoint analysis can be used to establish a model of consumer judgement, which allows us to predict consumer preferences about any combinations of attributes, even those not included in the original observations. 3) By including hold-out profiles in the design of data collection, the method allows a further evaluation on whether the choice model
established is predictive of the new preference data (Green & Srinivasan, 1978), which cannot be achieved by the other methods outlined.
Despite the fact that the methods are different in forms, they all focus on investigating the specific ‘utility values’ of attributes or attribute aspects, which implies that a compensatory (weighed additive) decision making process is taken for granted. The existence of other types of choice strategy is therefore largely neglected in empirical tourism studies. One reason for the oversight may be due to the lack of advanced estimation methods and tools. Recently however, a new tool, called greedoid method, has been developed to deduce non-compensatory (lexicographic) decision processes from
preference data in consumer research (Yee et al., 2007, Kohli & Jedidi, 2007).
Although greedoid method is not able to estimate part-worth values of the attributes, it is specifically designed for non-compensatory strategy models 3
For Peer Review
in which the computer deduces the aspect order through a matching
procedure rather than identifying utility values of attribute aspects through statistical estimations. It provides a possible tool to quantify
non-compensatory decision making theories empirically (Kohli & Jedidi 2007). By adopting this method, we are able to reveal and predict tourists’ preference based on the fact that tourists are not always rational and able to make comprehensive, analytic decisions.
Additionally, the greedoid analysis can deal with full-rank, partial-rank and consider-then-rank tasks. For conjoint analysis, the respondents need to fully rank all the stimuli provided. If a respondent only ranked some of the stimuli since he/she assumes the remaining stimuli are the same, his/her preference data cannot be analysed, which is a waste of useful information. Additionally, since greedoid analysis does not need the stimuli to be fully ranked, it
requires a smaller respondent workload than traditional conjoint analysis, which could lead to higher response rates. Thus this method was adopted in this research to infer the LBA choice strategy that may be used, in this case by Chinese long-haul outbound tourists. In order to answer the key question of whether the LBA model is appropriate for explaining and predicting tourists’ preference, the weighted additive model estimated by conjoint analysis was used as a benchmark for comparison.
Greedoid analysis
Greedoid analysis is based on a so-called ‘greedy algorithm’. The greedy algorithm aims to solve a combinatorial optimisation problem step by step (Edmonds, 1971; Korte & Lovász, 1984). It can be used to mimic non-compensatory choice strategies, particularly lexicographic preferences. Generally speaking, greedoid analysis serves two functions. Firstly, in analysing respondents’ preference data regarding a range of alternatives 3
For Peer Review
(different combinations of attribute aspects), greedoid analysis deduces the ‘aspect order’ (i.e. the ranking) that was used to make a selection. Secondly, since not everyone follows a perfect LBA strategy, the greedoid analysis provides a ‘cost’ indicator for each respondent that reveals the extent to which the LBA strategy was applied.
The greedoid computer programming introduced by Yee et al (2007), which had previously been applied on ranking data, was adopted in this study. The details of the greedy algorithm and the mathematics behind the computer programming are illustrated in Yee et al (2007). Here, a simple example of tourism destination decision making is presented to illustrate how greedoid-based programming works.
Assume tourists utilise an LBA choice strategy and there are 3 attributes (with 6 aspects) that are important for tourists: price (13,000 and 18,000), distance (long-haul and short-haul) and types of destination (natural landscape and culture). There are possible 8 combinations of the 6 aspects. In the empirical set-up, each respondent is presented with a corresponding set of 8 ‘stimuli cards’ and asked to rank them in order of preference.
A typical preference ranking of the 8 possible combinations presented by stimuli cards may be:
1. Price 13,000, long-haul, natural landscape 2. Price 13,000, long-haul, culture
3. Price 18,000, long-haul, natural landscape 4. Price 18,000, long-haul, culture
5. Price 13,000, short-haul, natural landscape 6. Price 18,000, short-haul, natural landscape 7. Price 13,000, short-haul, culture
8. Price 18,000, short-haul, culture 3
For Peer Review
By observing the preference ranking, it is possible to tell that this respondent uses a perfect LBA choice strategy, since all long-haul destinations are put forward before any other destinations and then if there are ties, the
destinations with lower price level are ranked above the destinations with higher ones; and then if there are still ties, the ones with natural landscape are ranked before cultural destinations. Thus, the ‘aspect order’ deduced for this respondent is long-haul > price 13, 000 > natural landscape. When the number of aspects is small and the respondents follow a perfect LBA strategy, the ‘aspect order’ is often evident on visual inspection of the data. But when there are many aspects and many respondents, it is necessary to employ a computer program. The computer program checks every possible aspect order in an efficient way to find out which one can be used to replicate the preference data stated by respondents.
However, sometimes respondents do not follow a perfect LBA strategy, and no such aspect order can be deduced to replicate a respondent’s preference ranking exactly. In these cases, the program would find the best-fit aspect order to replicate the closest preference ranking at the minimum ‘cost’. The ‘cost’ is the number of violated ranking pairs produced by comparing the preference ranking of the respondent and the preference ranking produced by the deduced aspect order. The higher the number of violated ranking pairs (the higher the cost), the less is the extent to which the LBA strategy was applied.
The original program used in Yee et al (2007) calculates the number of violated ranking pairs irrespective of whether the error happens at the beginning or at the end of the ranking sequence. However, based on observation during the data collection for this study, on the selection of tourist destinations, it was noted that people tended to restrict their 3
For Peer Review
attention to a subset of the destinations presented; that is, some of the destinations they simply did not consider to be places they would visit, and they consequently spent less time evaluating them. This suggests that the ranking order at the beginning may be more reflective of respondent’s real preferences than the ranking order at the end.
If the errors at the beginning are counted as equal to those at the end, there is a risk that the detection of the optimal aspect order may be driven by the responses (rankings) that are actually least reflective of a respondent’s preferences. This concern raises a critical question about how to calculate the ‘cost’ in greedoid analysis. We opted to use a weighting scheme to
calculate the ‘costs’. Since there was no reference in the literature specifying criteria or strategies for weighting, we chose to apply a linearly decreasing scheme. With the help of Michael Yee, this study modified the greedoid
program by adding a weighting scheme to the software. Thus for a ranking of N options, the weights for calculating the violated pairs from the first to the second last position (rank) are from (N-1) to 1. If there was no aspect order that could be found to replicate the observed preference ranking order, the modified program would find an aspect order which costs the minimum weighted number of violated ranking pairs.
Questionnaire design
In order to conduct greedoid analysis and to compare conjoint analysis to estimate different choice strategy models, an experimental survey was designed. For the survey, commonly used choice criteria (attributes) by Chinese long-haul outbound tourists were identified from previous studies through desk research (e.g. Yu & Weiler, 2001; Kim, Guo & Agrusa, 2005; Arlt, 2006; Sparks & Pan, 2009) and these were compared and confirmed through six in-depth interviews with staff in major tour operators (e.g. tour guides on international trips and marketing managers for international destinations). 3
For Peer Review
The interview stage was adopted for the following reasons: 1) all the informants are knowledgeable about Chinese long-haul outbound tourists. Thus the interview enabled us to double check if the attributes found by previous studies are the ones commonly concerned or queried by Chinese long-haul outbound tourists. 2) The informants are familiar with various long-haul destination packages, which ensured that the attribute aspects (i.e. level of price) used in the experimental design are the ones that are relevant to their customers and adequately represent actual destination products. 3) The interview was helpful to collect additional information to facilitate the survey such as the characteristics of Chinese long-haul outbound tourists, where they could be accessed and methods to approach them.
Through this process, 5 attributes with 11 aspects were confirmed for the experimental survey design. The 5 attributes (in italic) and their aspects were:
(1) Package price per person: around Ren Min Bi [RMB] 9,000, around RMB 13,000-17,000, above RMB 18,000.
(2) Risk involved in obtaining a visa: less risk/more risk of being refused (3) Whether the destination country is famous: famous
country/non-famous country
(4) Suitability for branded shopping opportunities: good for brand shopping/not suitable for brand shopping
(5) Time schedule: tightly organised journey with tours of more scenic spots/relaxing journey with more free time
The 48 (3*24) possible combinations based on the 5 attributes’ aspects were
reduced to an 8-profile nearly orthogonal design. This plan generated by SPSS ensures the highest level of coverage of different combinations of aspects with the minimum number of stimuli necessary for the estimation of conjoint analysis. Besides the 8 profiles, another 2 hold-out profiles
For Peer Review
randomly generated by SPSS were included in the design. The hold out profiles were not used for the estimation of different choice strategy models but to test how well the models derived from the analysis predict new data. The use of hold-out profiles enables comparison on predictive accuracy between compensatory and non-compensatory choice models.
The questionnaire consisted of two parts. The first part was a tailor-made experimental design in which respondents were asked to sort and rank the 10 stimuli profiles, where 1 was the most attractive destination tour and 10 the least. No attempt was made to present respondents with actual
destinations, and the cards were labelled simply ‘Destination itinerary 1’ through to ‘Destination itinerary 10’. The aspects combinations of the 10 stimuli (destination cards) are listed in Table 1 and Figure 1 provides a translated example of how the stimuli were presented to respondents. The second part of the survey was composed of three demographic questions including gender, age and occupation to distinguish different groups of tourists.
INSERT TABLE 1 HERE INSERT FIGURE 1 HERE
Data collection
A survey was conducted by using a convenience sampling approach from March to June 2012. In total, 201 participants completed the survey. This represented an adequate sample size in comparison with similar studies that have applied this type of experimental design methodology, and has
advantages over similar studies which have larger sample sizes but drawn from student respondents (e.g. Dieckmann et al., 2009; Yee et al., 2007). Of those, 78 were recruited at the CAISSA tour operator while they were enquiring about information about outbound trips or when they were 3
For Peer Review
identified as imminently due to take an outbound trip. Among the top four tour operators in Beijing, CAISSA is the only one which gave permission to access their customers. Due to a low response rate (25%), it took an average 8 hours each working day to recruit 8 respondents who met the
requirements and were willing to assist with the survey.
In order to control the bias that may generated due to the selection of a particular tour operator, the other 123 respondents were recruited through a snowball sampling method. The respondents either had long-haul travelling experience before or the necessary financial resources and also the desire to take an outbound trip in the near future. Since the experimental task is relatively complex, the survey was conducted face to face and the sorting process of each respondent was observed in order to obtain more reliable and complete data. The sorting task took on average 15-20 minutes for each to complete.
Although the convenience sampling method may not produce representative results for the whole population, there were two reasons for its use in this research; the exploratory nature of the study and, the difficulties
encountered in locating actual or potential long-haul outbound tourists. Although convenience sampling may be weak regarding statistical inferences relating to the population outside the sample, it has proved very useful for identifying issues, exploring promising hypotheses and collecting other sorts of non-inferential data (Fricker & Schonlau, 2002). As the main purpose of the study was to explore the use of non-compensatory choice models rather than the generation of generalizable statistical conclusions, this approach was deemed appropriate.
Moreover, unlike normal consumers, long-haul outbound tourists cannot be easily located at a shopping mall, for instance. The venue used to recruit 3
For Peer Review
respondents required careful consideration to enable the identification of respondents who were actual long-haul outbound tourists or were highly likely to take a long-haul trip in the near future. In order to locate as many respondents as possible within the time and financial constraints, the office of a large-scale international tour operator was suggested by interview informants as appropriate venues. In addition, the initial respondents of the snowball sampling were introduced by the initial informants.
Data analysis
The data analysis included two steps; preference estimation based on LBA choice strategy model and, model fit evaluation between LBA strategy and the weighted compensatory strategy. Because greedoid analysis is a
preference estimation method based on non-compensatory choice strategy, it reveals the hierarchical aspects order for each respondent. Unlike the
indicator of overall utility, which is central to conjoint analysis, it is not possible to average aspect orders to obtain a description of preferences in the whole sample. Instead, based on aspect orders of each individual, we constructed a hierarchical clustering tree for the whole sample. The procedure was to summarise the proportions of the respondent sample selecting a given aspect as their primary choice criterion first. Subsequently, it summarised the proportions selecting a given aspect as their second choice criterion within the group of respondents who chose the same primary choice criterion. The procedure continued until all the aspect orders were summarized.
In terms of model fit evaluation, two indicators were used to evaluate the two choice models: the accuracy of prediction on the hold-out data and the number of costs. The hold-out data are the data that are not used in the modelling of the choice strategies, but reserved for the accuracy assessment 3
For Peer Review
of the models. Since cards 9 and 10 are hold out profiles, the rankings of the two cards were used as the hold-out data. The accuracy of the prediction on hold-out data has been used successfully to compare the predictive power of choice models in marketing and consumer studies (Kohli & Jedidi 2007; Yee et al., 2007; Dieckmann et al., 2009).
The modified ‘cost’ with the weighted scheme was the indicator used to assess the extent to which the LBA strategy was applied during the sorting process. The smaller the number of violated pairs, the higher was the
likelihood that respondent used the LBA strategy. The ‘cost’ in the case of the compensatory choice strategy was calculated manually, in two steps. Firstly, the conjoint analysis provided the utility score of each destination card for each respondent. The 10 destination cards were then ranked according to these scores. Secondly, the estimated ranking order of the 10 destination cards was compared with the actual observed ranking order. The violated pairs (cost) were identified by comparing the two ranking orders and each pair was multiplied by the weights. The final number was obtained by summing the weighted costs.
One clarification is that among the 201 useable questionnaires, 184
respondents provided a full ranking of the 10 stimuli destination cards, while the remaining 17 respondents were able to provide only a partial ranking of the destination cards. Thus all 201 respondents were processed by greedoid analysis to reveal tourists’ preference based on the LBA model. For the model fit comparison, since the conjoint analysis cannot make estimations based on a partial ranking, only the 184 full ranking orders were used in this part of analysis.
FINDINGS
Preference estimation based on a non-compensatory (LBA) choice strategy
For Peer Review
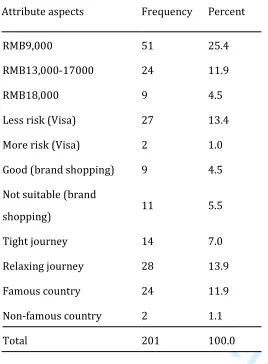
Among the 11 attribute aspects, the most popular first aspect used by the respondents was price at RMB9, 000, which was used by 25% (51) of participants (See Table2). In other words, for one quarter of respondents, low price (RMB9, 000) was the most important criterion (aspect) on which to evaluate alternative destinations. For these respondents, all destinations not meeting this criterion were put aside, no matter how attractive they were in terms of other attributes. For 14% of respondents (28), a relaxing journey with more free time was the most important criterion, and for yet another 13% (27) an easy visa application (low risk of rejection) was the single most important attribute. Famous country and price at 13,000-17,000 were endorsed by 12% (24) of respondents as their primary criterion. The proportions of the respondents who used the other six aspects as their first evaluation criterion were relatively small (no more than 10% for each aspect).
INSERT TABLE 2 HERE
For further identifying the clusters which used the same/similar aspect order to make the selections, the hierarchical clustering tree was constructed. Due to the space limitation, Figure 2 presents only a partial tree with important nodes. These nodes represented the most commonly used attribute aspect(s) at each stage. For example, for the clustering of the first aspect used, only five attribute aspects mentioned above were included since these five aspects were the most commonly used, each accounting for more than 10% of respondents. For the group of respondents (51) who used price as their first criterion, they have 10 aspects to use as their second important criterion. Only aspect(s) chosen by more than five respondents as their second
criterion was included. This was price 13,000-17,000 which was used by 36 out of 51 respondents. Among the 36 respondents, only the aspect(s) used by more than five respondents as the third criterion were presented.
For Peer Review
Since the focus of this paper is to evaluate the use and predictive power of the non-compensatory strategy model, the results of the preference
estimation of the conjoint analysis are not presented here (however, they can be provided on request).
Model fit evaluations
For the 184 respondents with complete rankings, the weighted
compensatory model predicted about 80% (147) rank orders of the hold-out data correctly, whereas the LBA model predicted a slightly lower proportion correctly (76%, 140 respondents). This comparison of prediction rates using hold-out stimuli has a number of limitations. Only two destinations could be used as the hold-out data, as the conjoint analysis requires a minimum of eight stimuli. When using larger sets of stimuli, a larger number of hold-out stimuli can be applied, which may lead to a clearer differentiation of the two models than is possible in our case. Moreover, for all respondents whose destination preference could be predicted accurately by both models, this basis of comparison is intrinsically unable to provide a verdict about which of the two models is more appropriate. Therefore, this study adopts the ‘cost’ as another method for comparing the predictive power of the choice models.
The results of the cost indicator for each choice model are presented in table 3. The average cost of the whole sample is 17.39 for the LBA model and 21.4 for the weighted compensatory model. The standard error of mean and standard deviation for the LBA model are smaller than for the weighted compensatory model. A smaller standard error indicates that the sample mean of the costs more accurately reflects the mean of the costs for the actual population (all Chinese long-haul outbound tourists). A smaller standard deviation indicates the individual costs vary less from the mean.
INSERT TABLE 3 HERE 3
For Peer Review
The maximum value of the cost within the whole sample was 84 for the LBA model and 134 for the weighted compensatory model. Since the theoretical maximum cost is 285, the averaged percentage cost for each model is 6% (17.39/285) LBA and 8% conjoint analysis (21.4/285) respectively (from data in Table 3). In other words, the LBA model could replicate 94% of observed preference orders of the whole sample; the weighted
compensatory model could replicate 92%. Based on these statistics, it can be inferred that the LBA model performs slightly better in replicating the
observed ranking order than the weighted compensatory model.
To further examine the suitability of each model at an individual level, for each respondent the choice strategy model that produced the fewest errors (least cost) was assigned to him/her. The frequency statistics of the
respondents assigned to the two choice models are presented in Table 4. These tests revealed that 67 respondents (36%) were predicted better by the weighted compensatory choice model and 117 respondents (64%) were predicted better by the LBA choice model. Based on this indicator, the LBA model performs better in predicting the preferences of the sample than the weighted compensatory model.
INSERT TABLE 4 HERE
A further point to note was that among the 184 respondents, there were 20 respondents (10%) whose observed rankings could be perfectly reproduced (No cost) by the LBA choice strategy. Although the number of respondents within this group is too small to produce any significant findings, it is still worth looking at the preference characteristics of this group, since it may provide promising hypotheses for further studies investigating decision-makers who tend to use a LBA strategy. A frequency analysis was run on the 3
For Peer Review
first important aspect used by these 20 respondents. Instead of lowest price, the first aspect most frequently used by these perfect LBA decision-makers was a relaxing journey with more free time (7). But there remained a number of people (6) who used lowest price as their first choice criterion.
DISCUSSION
Issues regarding the non-compensatory choice strategy model
Although a compensatory choice model has been widely employed in many studies of tourism decision making (e.g. Morley, 1994; Papatheodorou, 2001; Seddighi & Theocharous, 2002; Ciná, 2012), it is evident that under certain circumstances – notably where the decision maker has limited time, energy and information – simpler, non-compensatory choice strategies are favoured by decision makers (Yee, et al., 2007; Hauser, et al., 2009). In the context of the present research, most prospective Chinese long-haul outbound tourists have limited knowledge of long-haul alternative destinations. When visiting tour operators, they are faced with large numbers of alternative destination packages and large amounts of information. Under these circumstances, a non-compensatory choice strategy is likely to be used, especially at the first stage of decision making, when the consideration set is formed (Parkinson & Reilly, 1979; Brisoux & Laroche, 1981; Crompton & Ankomah, 1993).
However, the use of the non-compensatory strategy model has not
previously been quantified within tourism decision-making contexts. This study suggests that a non-compensatory strategy is appropriate. Additionally, the goodness of fit for the LBA model indicates the promising predictive power of this model in this context, i.e. the destination preferences of Chinese long-haul outbound tourists.
The investigation of non-compensatory choice strategies provides a different perspective for understanding the mechanisms behind tourist decision-3
For Peer Review
making behaviour. Moreover, preference estimation based on the non-compensatory model adds additional information to conventional,
compensatory model approaches. It provides a hierarchical ranking order of each choice criterion, with a focus on the priority of influence for each choice criterion. For instance, the time schedule is one of the most important
attributes used by Hong Kong residents in choosing a package tour (Wong & Lau, 2001) and in the study of Chinese outbound tourists conducted by Zhu (2005), the time schedule was also an important attribute. The importance of the time schedule was also highlighted by the present study sample.
However, greedoid analysis offers the potential for additional insight into how this attribute is preferred. The present study found that a relaxing journey with more free time was the second most popular aspect used by tourists as their first-choice criterion (and was the most popular among those respondents who followed a perfect LBA strategy). Additionally, the greedoid analysis provided the aspect order for each respondent. The
hierarchical preference clustering tree derived from these aspect orders can be used as the basis for more refined market segmentation.
The non-compensatory (LBA) choice strategy estimated in this research is based on the lexicographic preference first introduced by Georgescu-Roegen (1954) within economics and the greedoid analysis used to infer the LBA strategies was introduced by Kohli and Jedidi (2007) and Yee et al. (2007) independently in marketing research. The application of the
non-compensatory theory and the estimation method from these other
disciplines entailed more than a simple process of quantifying theories of consumer decision-making, but involved a process of careful knowledge adaption and reflection, based on the particular characteristics of tourism products.
For Peer Review
Due to the intangibility of tourism products, some of the choice criteria used by tourists tend to be more abstract and associated with more emotional engagement than those used to select everyday products, such as the colour of a cell phone or the amount of computer memory. Therefore a more careful identification of these choice criteria (attributes) and their values (aspects) was required. The attributes and the aspects of the attributes presented to the respondents should be the ones that reflect the real performance of the available destinations. This revealed the importance of the qualitative
interview stage to ensure the attributes and aspects were genuinely relevant to actual destination packages.
Evaluation of model fit
As for the model fit evaluation, this research provides two possible estimation methods to evaluate the predictive ability of different choice strategy models. One is the test on hold-out data, while the other is the power to replicate the real preference order, named "the number of cost". The former has been widely used in previous studies but the latter is an innovation adopted in this research. The inclusion of this indicator is necessary and important during the investigation of choice strategies because it can help us to identify those individuals who can be predicted accurately by a certain choice model. Even for the tourists who do not use a certain choice strategy consistently, this indicator is able to suggest to what extent a certain choice strategy is applied. Such information is crucial for understanding tourists' preferences based on the choice strategy models they use.
The methods used to calculate the cost was another issue addressed in this study. Although Yee et al. (2007) and Kohli and Jedidi (2007) used different programs to generate their aspect orders, the principles they used to identify the ‘best’ aspect order were identical, which involved finding the aspect 3
For Peer Review
order that generates the minimum number of violated pairs (costs). This principle does not consider the fact that the importance of particular pair violations may vary with their position in the observed ranking order,
although the weighted minimum number of costs was discussed in the thesis of Michael Yee. A linearly decreasing weighting was used in this research. However, whether a linearly decreasing weighting is the most appropriate way to reflect tourist preference is a question that needs to be further investigated. An alternative weighting scheme could give larger weights for all the alternatives within the consideration set and smaller weights for all the other alternatives.
Managerial implications
As mentioned, the use of different choice strategies often leads to different choice outcomes (Sen, 2003). Therefore, investigating which choice strategy model is more appropriate for a specific tourism market is of great
importance for practitioners (e.g. tour operators and destination organizations) to develop more effective advertising and destination products. For example, for the Chinese long-haul tourists who can be
predicted better by a lexicographic strategy, the advertisement should focus on the most important attribute and emphasize their performance (expected attribute aspects). While for the group which can be predicted better by a weighted additive strategy, it may be more effective to emphasize the wider range of attributes in combination and their components.
Moreover, the hierarchical clustering based on the aggregation of individual aspect orders can provide valuable guidance for market segmentation and product design. For example, the aspect order ‘RMB9, 000 > RMB 13,000-17,000 > Less risk (Visa)’ suggests a preference for cheap price and less risk while the aspect order ‘Relaxing journey with more free time > Good for brand shopping’ suggests two distinguishable markets. Therefore the 3
For Peer Review
hierarchical preference clustering could yield a range of new product/market opportunities for destinations.
Additionally, the use of non-compensatory strategies to form the consideration set was suggested by previous tourism decision making literatures (e.g. Crompton & Ankomah, 1993; Perdue & Meng, 2006). Although the use of non-compensatory strategies for consideration set formation was not been investigated in this research, greedoid analysis is able to deal with consider-then-rank data, which can be used for identifying the attribute aspects that tourists used to eliminate the destinations at the stage of consideration-set formation. Such information would also be of great help for destination marketing organizations to improve their offer and for marketers to devise appropriate marketing strategies.
CONCLUSIONS
This study has made use of advanced analysis methods to understand the dynamic mental processes at work in destination choice revealing for the first time that tourist choice may not always be the result of (bounded) rationality cognitive processes. The research required the application and integration of interdisciplinary knowledge and computer programming to demonstrate that new explanatory models can be more effective in
predicting tourist’s preferences than conventional weighted additive models. The paper thus responds to the identified need for complex process models that acknowledge the social and cultural contexts in which tourists make decisions (Smallman & Moore, 2010). Whilst this paper does not follow the naturalistic enquiry route advocated by Smallman & Moore (2010), it does offer a unique insight into the underlying mental processes in tourist destination decision making.
For Peer Review
This paper demonstrates that a simplifying strategy can well approximate tourists’ choice processes, and suggests that non-compensatory approaches can be used to examine tourist choice. This casts doubt on the rationality assumed in conventional models of tourist consumer behaviour. The quantification of non-compensatory choice strategies in tourist destination selection and the inference of the existence of the LBA choice strategy suggest this as a promising model to explain and predict destination preferences. This is the first study to apply greedoid analysis in an
investigation of consumers’ preferences for intangible products, extending our understanding of the ‘greedy algorithm’ into what are generally assumed to be high-involvement purchase contexts. Indeed, the study has improved the validity of the method regarding the calculation of costs, which is likely to be useful for future studies beyond the tourism context.
Finally, this research investigated a specific target market (Chinese long haul outbound) in which the LBA strategy may be suited. Other tourism related decision-making behaviour (e.g. choice of short-haul destinations, choice of travel mode, hotel or tour operators) may be considered and investigated in the future. The tourism choice contexts in which non-compensatory
approaches may be applied is potentially very wide.
As an exploratory study, this research has a number of limitations regarding methodology as well as research focuses. Based on these limitations,
recommendations are made for future studies. Firstly, instead of a random sample, a convenience sample was used with 201 respondents. The make-up and relatively small sample size do not permit generalizability to the whole population. Yet in terms of the study aim to explore the use of an LBA strategy and to estimate the effectiveness of this model in relation to conventional methods, the sample size is adequate. A larger sample size is 3
For Peer Review
required for future studies however, to increase the representativeness of the findings on tourists’ preference.
Secondly, in this study, the destinations investigated are not real destinations but stimuli which contain different combinations of destination attributes' aspects. A further link with actual destinations should be made in future studies. Yet the qualitative data was useful to help generate realistic
attributes for this market. For example, ease of obtaining a visa is relatively fixed for each destination country, Australia or New Zealand are relatively easy as opposed to the USA, for example, which contains a greater risk of visa rejection for Chinese tourists.
Additionally, this study did not provide insights regarding the influence of culture. How the cultural characteristics influence tourists' selection of the choice criteria and choice strategies should be examined in the future in addition to cross-cultural comparison.
REFERENCES
Abelson, R. P. & Levi, A. (1985). Decision making and decision theory. In G. Lindzey & E. Aronson (Eds.), The Handbook of Social Psychology. New York: Random House.pp 231-309.
Ajzen, I.& Driver, B. L. (1992). Application of the theory of planned behavior to leisure choice. Journal of Leisure Research, 24, 207-224.
Arlt, W. G. (2006). China's outbound tourism. London: Routledge.
Au, N.& Law, R. (2000). The Application of Rough Sets to Sightseeing Expenditures. Journal of Travel Research, 39, 70-77.
For Peer Review
Basala, S. L.& Klenosky, D. B. (2001). Travel-style preferences for visiting a novel destination: A conjoint investigation across the novelty-familiarity continuum. Journal of Travel Research, 40, 172-182.
Beerli, A. & Martin, J. D. (2004). Factors influencing destination image. Annals of Tourism Research, 31, 657-681.
Bettman, J.R., Johnson, E.J.& Payne, J. W. (1991). Consumer decision making. In T. S. Roberson & H.H. Kassarjian (Eds.), Handbook of Consumer Behavior.. Englewood Cliffs: PrenticeHall.pp. 50-84.
Brisoux, J. E., & Laroche, M. (1981). Evoked set formation and composition: An empirical investigation under a routinized behavior situation. Advances in Consumer Research, 8, 357-361.
Chi, C.G-Q.& Qu, H. (2008). Examining the structural relationships of
destination image, tourist satisfaction and destination loyalty: An integrated approach. Tourism Management, 29, 624-636.
Ciná, V.Z. (2012). Tourism marketing: a game theory tool for application in arts festivals. Tourism Economics, 18, 43-57.
Crompton, J.L. (1992). Structure of Vacation Destination Choice Sets. Annals of Tourism Research, 19, 420-434.
Crompton, J.L. & Ankomah, P.K. (1993). Choice set propositions in destination decisions. Annals of Tourism Research, 20, 461-476.
Czerlinski, J., Gigerenzer, G., Goldstein, D., Todd, P.& Group, A.B.C.R. (1999). How good are simple heuristics? In Simple Heuristics That Make Us Smart. Oxford, Oxford University Press.pp. 97-118.
For Peer Review
Decrop, A. (2010). Destination choice sets: An inductive longitudinal approach. Annals of Tourism Research, 37, 93-115.
Decrop, A.& Kozak, M. (2009). Decision strateigies in tourism evaluation. In M. Kozak & A. Decrop (Eds.), Handbook of Tourist Behavior Theory & Practice. New York, Routledge.pp. 67-82.
Dieckmann, A., Dippold, K.& Dietrich, H. (2009). Compensatory Versus Noncompensatory Models for Predicting Consumer Preferences. Judgment and Decision Making, 4, 200-213.
Drolet, A.& Luce, M.F. (2004). The rationalizing effects of cognitive load on emotion-based trade-off avoidance. Journal of Consumer Research, 31, 63-77.
Edmonds, J. (1971). Matroids and the greedy algorithm. Mathematical Programming, 1, 127-136.
Fricker, R. D.& Schonlau, M. (2002). Advantages and disadvantages of internet research surveys: Evidence from the Literature. Field Methods, 14, 347-367.
Gabbott, M.& Hogg, G. (1994). Consumer Behaviour and Services: A Review.
Journal of Marketing Management, 10, 311-324.
Georgescu-Roegen, N. (1954). Choice and revealed preference. Southern Economic Journal, 21, 119-130.
Go, F. & Zhang, W. (1997). Applying importance-performance analysis to beijing as an international meeting destination. Journal of Travel Research, 35, 42-49.
Green, P. E., & Srinivasan, V. (1978). Conjoint Analysis in Consumer Research: Issues and Outlook. Journal of Consumer Research, 5, 103-123.
For Peer Review
Haahti, A. J. (1986). Finland's competitive position as a destination. Annals of Tourism Research, 13, 11-35.
Hauser, J. R., Ding, M.& Gaskin, S. P. (2009). Non-compensatory (and
Compensatory) Models of Consideration-Set Decisions. In Proceedings of the Sawtooth Software Conference, Delray Beach, FL, Mar. 23-27. Pp 207-232. www.sawtoothsoftware.com/download/techpap/2009Proceedings.pdf
Howard, J. A. & Sheth, J.N. (1969).The Theory of Buyer Behavior. New York, John Wiley.
Hsu, T-K., Tsai, Y-F.& Wu, H-H. (2009). The preference analysis for tourist choice of destination: A case study of Taiwan. Tourism Management, 30, 288-297.
Hyde, K. F. (2008). Information processing and touring planning theory.
Annals of Tourism Research, 35, 712-731.
Jang, S. & Cai, L. A. (2002). Travel motivations and destination choice: A study of British outbound market. Journal of Travel & Tourism Marketing, 13, 111- 133.
Kim, S. S., Guo, Y.& Agrusa, J. (2005). Preference and positioning analyses of overseas destinations by mainland chinese outbound pleasure tourists.
Journal of Travel Research, 44, 212-220.
Kohli, R.& Jedidi, K. (2007). Representation and inference of lexicographic preference models and their variants. Marketing Science, 26, 380-399.
Korte, B.& Lovász, L. (1984). Greedoids and linear objective functions. SIAM Journal on Algebraic Discrete Methods, 5, 229-238.
For Peer Review
Lancaster, K. J. (1966). A new approach to consumer theory. Journal of Political Economy, 174, 132–157.
Laroche, M.& Kim, C. (2003). Which decision heuristics are used in
consideration set formation. Journal of consumer Marketing, 20, 192-209.
Law, R. & Au, N. (2000). Relationship modeling in tourism shopping: a decision rules induction approach. Tourism Management, 21, 241-249.
Li, C. (2013). Tourist destination choice: A review and critical evaluation of preference estimation methods in tourism marketing research. In S. McCabe (Eds.), Handbook of Tourism Marketing. London, Routledge. pp. 313-326.
Mansfield, Y. (1992). From Motivation to Actual Travel. Annals of Tourism Research, 19, 399-419.
Morley, C.L. (1992) A microeconomic theory of international tourism demand. Annals of Tourism Research, 19(2), 250-267.
Morley, C. L. (1994). Experimental destination choice analysis. Annals of Tourism Research, 21, 780-791.
Papatheodorou, A. (2001). Why people travel to different places. Annals of Tourism Research, 28, 164-179.
Parkinson, T. L.& Reilly, M. (1979). An information processing approach to evoked set formation. Advances in Consumer Research, 6, 227-231.
Perdue, R.& Meng, F. (2006). Understanding choice and rejection in destination consideration sets. Tourism Analysis,11(6), 337–348.
Recker, W. W.& Schuler, H. J. (1981). Destination choice and processing spatial information: Some empirical tests with alternative constructs.
Economic Geography, 57, 373-383. 3
For Peer Review
Rewtrakunphaiboon, W.& Oppewal, H. (2008). Effects of package holiday information presentation on destination choice. Journal of Travel Research,
47, 127-136.
Rossi, P. E.& Allenby, G. M. (2003). Bayesian statistics and marketing.
Marketing Science, 22, 304-328.
Seddighi, H. R.& Theocharous, A. L. (2002). A model of tourism destination choice: a theoretical and empirical analysis. Tourism Management, 23, 475-487.
Sen, A. (1997). Maximization and the act of choice. Econometrica, 65, 745-779.
Smallman, C. & Moore, K. (2010). Process Studies of Tourists’ Decision-Making. Amnnals of Tourism Research, 37 (2), 397–422.
Sparks, B.& Pan, G. W. (2009). Chinese outbound tourists: Understanding their attitudes, constraints and use of information sources. Tourism Management, 30, 483-494.
Spiggle, S. & Sewall, M.A. (1987) A Choice Sets Model of Retail Selection.
Journal of Marketing, 51, 97-111.
Svenson, O. (1979). Process descriptions of decision making. Organizational Behavior and Human Performance, 23, 86-112.
Tussyadiah, I. P., Kono, T., & Morisugi, H. (2006). A Model of Multidestination Travel: Implications for Marketing Strategies. Journal of Travel Research, 44, 407-417.
Um, S.& Crompton, J. L. (1990). Attitude determinants in tourism destination choice. Annals of Tourism Research, 17, 432-448.
For Peer Review
Van Middelkoop, M., Borgers, A.& Timmermans, H. (2003).Inducing Heuristic Principles of Tourist Choice of Travel Mode: A Rule-Based Approach. Journal of Travel Research, 42,75-83.
Wong, S.& Lau, E. (2001). Understanding the behavior of Hong Kong Chinese tourists on group tour packages. Journal of Travel Research, 40, 57-67.
Woodside, A.G.& Lysonski, S. (1989). A general model of traveler destination choice. Journal of Travel Research, 27, 8-14.
Wright, P. (1975). Consumer Choice Strategies: Simplifying vs. Optimizing.
Journal of Marketing Research, 12, 60-67.
Yee, M., Dahan, E., Hauser, J. R.& Orlin, J. (2007). Greedoid-Based noncompensatory inference. Marketing Science, 26, 532-549.
Yu, X.& Weiler, B. (2001). Mainland Chinese pleasure travelers to Australia: A leisure behavior analysis. Tourism Culture & Communication, 3, 81-91.
Zhu, Y. (2005). Analysis of China outbound tourists: Characteristic
according to “Principle of the wooden barrel”. Journal of Beijing International Studies University, 129, 103-113.
For Peer Review
HOW TOURISTS CHOOSE THEIR DESTINATIONS:Evaluating choice strategies and methods of their measurement
Table1 Aspects combinations of the 10 stimuli (destination cards)
Destination
cards Price
Level of
Risk of
Rejection
for a Visa
Availability of
Brand
Shopping
Organized/
Relaxed
Schedule
Fame of
destination
1 RMB9,000 More risk Not suitable Relaxing Non-famous destination
2 RMB9,000 More risk Good Tightly
organized
Non-famous
destination
3 RMB 18,000 Less risk Not suitable Tightly organized
Non-famous
destination
4 RMB9,000 Less risk Not suitable Relaxing Famous destination
5 RMB 18,000 More risk Good Relaxing Famous destination
6 RMB9,000 Less risk Good Tightly Famous destination
7 RMB13,000 More risk Not suitable Tightly Famous destination
8 RMB13,000 Less risk Good Relaxing Non-famous destination
9 RMB 18,000 More risk Not suitable Tightly Famous destination
10 RMB9,000 Less risk Not suitable Tightly Non-famous destination 3
For Peer Review
Table 2 Frequencies of first aspect used by tourists
Table 3 Statistical comparison of costs between two strategy models
Lexicographic by aspect Weighted compensatory
N
Valid 184 184
Missing 0 0
Mean of costs 17.39 21.40
Std. Error of Mean 1.17 1.59
Std. Deviation 15.82 21.52
Maximum 84 134
Attribute aspects Frequency Percent
RMB9,000 51 25.4
RMB13,000-17000 24 11.9
RMB18,000 9 4.5
Less risk (Visa) 27 13.4
More risk (Visa) 2 1.0
Good (brand shopping) 9 4.5
Not suitable (brand
shopping) 11 5.5
Tight journey 14 7.0
Relaxing journey 28 13.9
Famous country 24 11.9
Non-famous country 2 1.1
Total 201 100.0
[image:37.612.111.468.532.697.2]For Peer Review
Table 4 Frequencies of the respondents suits different choice strategies
Choice model Frequency Percent
Weighted
compensatory 67 36.4
Lexicographic by
aspect 117 63.6
Total 184 100.0
For Peer Review
HOW TOURISTS CHOOSE THEIR DESTINATIONS:
Evaluating choice strategies and methods of their measurement
Figure1 Example of the stimuli cards used for the sorting task
Destination itinerary 1
Price: RMB 9,000 per person
Visa: more risk of being refused
Shopping: not suitable for brand shopping
Time schedule: relaxed schedule
Famous: non-famous country 3
For Peer Review
Figure 1 Hierarchical Clustering Tree
http://mc.manuscriptcentral.com/jotr