1
Development of a composite substrate peel test to assess moisture
1
sensitivity of aggregate-bitumen bonds
2
3
Jizhe Zhang (Corresponding author)
4
PhD Student
5
Nottingham Transportation Engineering Centre, Department of Civil Engineering
6
University of Nottingham, University Park, Nottingham NG7 2RD, United Kingdom
7
Tel: 01158468442; Email: [email protected]
8 9
Gordon D. Airey
10
Professor
11
Nottingham Transportation Engineering Centre, Department of Civil Engineering
12
University of Nottingham, University Park, Nottingham NG7 2RD, United Kingdom
13 14
James Grenfell
15
Senior Technical Officer
16
Nottingham Transportation Engineering Centre, Department of Civil Engineering
17
University of Nottingham, University Park, Nottingham NG7 2RD, United Kingdom
18 19
Alex K. Apeagyei
20
Research Fellow
21
Nottingham Transportation Engineering Centre, Department of Civil Engineering
22
University of Nottingham, University Park, Nottingham NG7 2RD, United Kingdom
23 24
Martyn Barrett
25
Technical Officer
26
Nottingham Transportation Engineering Centre, Department of Civil Engineering
27
University of Nottingham, University Park, Nottingham NG7 2RD, United Kingdom
28 29
30
31
2
Abstract: Moisture damage in asphalt mixtures is a complicated mode of pavement distress
1
that results from the loss of interfacial adhesion between the aggregate and bitumen and/or
2
the loss of cohesion within the bitumen film. This paper presents the development of suitable
3
procedure to prepare peel test specimens using coarse aggregates and compare the results
4
with the established standard peel test. The newly developed composite substrate peel test
5
(CSPT) was found to be effective in characterising the moisture sensitivity of the
aggregate-6
bitumen bond and the results correlated well with the results from a standard peel test. The
7
results from the CSPT and the standard peel test showed that the fracture energy after
8
moisture damage was found to be aggregate type dependent. Based on the standard peel test
9
and CSPT, the moisture sensitivity of aggregate-bitumen bonds were evaluated by the
10
retained fracture energy. Limestone tends to have better resistance to moisture damage than
11
granite when moisture adsorptions are similar. Furthermore, in terms of similar aggregates,
12
lower moisture adsorption results in better moisture resistance. This phenomenon suggests
13
that in a susceptible asphalt mixture, the effect of aggregate may be more influential than the
14
effect of bitumen. Strong correlations were found between the standard peel test and the
15
CSPT in terms of moisture damage evaluation and suggest that the CSPT maybe a more
16
practical procedure to test the aggregate-bitumen bond for actual aggregates used in asphalt
17
mixtures.
18
19
Keywords: Peel test, bitumen, aggregate, moisture damage, CSPT
20
21
1. Introduction
22
23
The total road length in the UK is estimated to be approximately 250 thousand miles with
24
most of these roads being surfaced with asphalt mixtures [1]. Asphalt mixture is a composite
3
material consisting of aggregates (coarse and fine), bitumen and filler, mixed in a
1
predetermined ratio at high temperatures followed by compaction in order to produce a
2
flexible pavement [2]. When subjected to loading traffic, asphalt pavements deteriorate
3
gradually with the passage of time because of repeated traffic loading and environmental
4
attack [3]. In England and Wales, approximately 2.8 billion pounds are spent every year by
5
local authorities on road maintenance [4]. It is generally accepted that moisture damage is
6
one of the major causes of pavement deterioration.
7
8
Moisture damage in asphalt pavements can generally be classified as the gradual deterioration
9
of strength, stiffness and durability because of the presence of moisture in a liquid or vapour
10
state [5]. In addition, the presence of moisture can accelerate the distress of asphalt pavement
11
in several different modes, such as rutting, fatigue cracking, thermal cracking and the
12
formation of potholes [6, 7]. Recent research studies have also shown that moisture damage
13
maybe reversible under certain conditions [8]. In the field, the moisture damage normally
14
happens first at the interface of two pavement layers or at the bottom of pavement layers and
15
develops gradually upward. In addition, it has been observed that moisture damage is more
16
prone to occur in the wheel path in comparison with locations between the wheel paths or on
17
the shoulder [9].
18
19
There are several factors which may influence the development of moisture damage or
20
moisture sensitivity of an asphalt pavement, such as aggregate mineralogy, surface texture of
21
the aggregate, bitumen chemistry and the compatibility between aggregate and bitumen [10].
22
In addition, factors such as permeability of the asphalt mixtures, volumetric properties of the
23
asphalt mixture and the ambient conditions are all important when considering the
24
susceptibility of asphalt mixtures to moisture damage [11]. Based on previous research,
4
moisture damage is mainly characterised as the adhesive failure between aggregate and
1
bitumen or bitumen-filler (mastic) [12]. It has been suggested that the adhesion between
2
aggregate and bitumen in the dry condition and its degradation with the presence of water are
3
the two main attributes which determine the moisture sensitivity of pavements [13]. The
4
physico-chemical interactions between aggregates and bitumen in the presence of moisture
5
are believed to partially govern the moisture sensitivity of asphalt mixture, which can also
6
affect the serviceability, performance and durability of the asphalt pavement.
7
8
By evaluating the moisture damage of adhesion between aggregates and bitumen, efforts have
9
been made with numerous testing methods having been developed. Based on previous
10
research, standard tests on loose coated aggregates, such as the boiling water test and rolling
11
bottle test, are considered as direct methods to access moisture sensitivity by visual
12
inspection [14]. However, these tests rely on the basis of comparative evaluation so that the
13
results cannot be used to explain the actual mechanisms that contribute to moisture damage
14
and it is hard to correlate test data with field performance [15, 16]. So, it seems important to
15
develop testing techniques and procedures that can directly measure the strength of
16
aggregate-bitumen adhesive bond.
17
18
Over the past few years, several testing techniques used in other areas have been selected and
19
developed to measure the adhesion between aggregate and bitumen in the dry condition and
20
after moisture damage. The peel test is a method to measure the adhesive fracture energy of
21
the bonded interface of composited materials and has been successfully used to evaluate the
22
moisture sensitivity of different aggregate-bitumen combinations [17, 18]. This test is based
23
on the fracture mechanics approach to measure the adhesive fracture energy of
aggregate-24
bitumen joints tested in both the dry state and after being conditioned in moisture [19].
5 1
The peel test used for aggregate-bitumen adhesive testing requires the preparation of a large
2
flat aggregate surface with regular shape. In this case, only large stone boulders could be used
3
for the peel substrate preparation. This paper presents a newly designed procedure to prepare
4
a composite substrate using coarse aggregates as a practical alternative to the standard peel
5
test. The innovation of this procedure is the ability to combine several coarse aggregates
6
together and get a flat aggregate surface that can be easily used for the peel test rather than
7
use stone boulders. The paper evaluates the susceptibility of the aggregate-bitumen bonds to
8
moisture damage based on values obtained from the new CSPT as compared to the standard
9
peel test. The reliability of the newly developed composite substrate peel test (CSPT) was
10
evaluated using the standard peel test.
11
12
Four different types of aggregate (two limestones and two granites) and one type of bitumen 13
were selected for testing. The mechanical tests, consisting of the newly developed CSPT and 14
the standard peel test, were used for measuring retained fracture energy after moisture 15
conditioning. The moisture sensitivity of the aggregate-bitumen combinations were 16
characterised by analysing the results obtained from the mechanical tests. Finally, the 17
correlation between these two tests was analysed by comparing the moisture sensitivity 18
ranking of the two tests. 19
20
2. Materials
21
22
2.1 Bitumen
23
24
One 40/60 penetration grade bitumen was used in this study (bitumen B1). The properties of
6
the bitumen were measured using the softening point (BS EN 1427) and penetration (BS EN
1
1426) tests with softening point and penetration values of 51.2°C and 46 (0.1mm),
2
respectively.
3
4
2.2 Aggregates
5
6
Four types of aggregate (including boulders and coarse aggregates) from different quarries
7
were selected as substrates. They included two limestone ‘basic’ aggregates (L1 and L2) and
8
two granite ‘acidic’ aggregates (G1, G2). In this research, these four aggregates were used for
9
both the newly developed CSPT and standard peel test. The water absorption of these four
10
aggregates was evaluated according to the ASTM standard (ASTM C127-15) and the results
11
shown in Table 1. The results show that L1 has a far higher moisture absorption than L2 and
12
G2, which are very similar, while G1 has the lowest moisture absorption.
13
14
3. Experimental Programme
15
16
3.1 Mineral Liberation Analyser (MLA) test
17
18
The mineralogical compositions of aggregates have a significant influence on moisture 19
damage susceptibility of asphalt mixtures. The mineralogy of the different aggregates was 20
studied using a Mineral Liberation Analyser (MLA) in order to understand the effect of their 21
morphology on moisture damage resistance of aggregate-bitumen bonds. The experimental 22
procedures used for the mineralogical composition testing can be found in previous 23
publications [11, 20]. 24
7
3.2 Peel test
1
2
The peel test (as described in ASTM D6862-11) is used to measure the fracture energy of
3
flexible laminates and is widely used in aerospace, automotive and electronics applications
4
[21, 22, 23]. This test is considered to be a reliable method to measure the peel strength
5
(fracture energy) if suitable corrections for plastic work can be performed [24].
6
7
3.2.1 Substrate preparation 8
9
For the peel testing, the specimen should be rectangular, with the rigid aggregate substrate
10
and the flexible peel arm adhered along most of the length. The rigid aggregate should be
11
thick enough to withstand the expected tensile force. The flexible peel arm should have good
12
adhesion with bitumen to avoid fracture at the interface. In this research, an aluminium alloy
13
with a thickness of 0.2 mm was selected as a flexible peel arm. According to previous
14
research [19], the aggregate substrates were produced from aggregate boulders with the
15
overall dimensions selected as 150 mm × 20 mm × 10 mm.
16
17
The stone boulders were first wet-sawn to get aggregate slabs with a thickness of 10 mm.
18
Then, the aggregate slabs were trimmed to a size of 150 mm long and 20 mm wide, as shown
19
in Figure 1a. In this case, only large stone boulders (>200 mm) could be used for the
20
substrate preparation. However, commonly used asphalt mixture aggregates are crushed
21
coarse aggregates (20 mm - 32 mm) which are significantly smaller than stone boulders.
22
23
This paper presents the development of a novel method to prepare a composite substrate
24
using crushed coarse aggregates (Figure 1b) as a more practical replacement for the aggregate
8
substrate prepared from boulders (Figure 1a). The innovation of this procedure is the ability
1
to combine several coarse aggregates together and get a flat surface that can be used for the
2
peel test.
3
4
In order to combine the coarse aggregates together, a mould made up from five aluminium
5
plates was designed and shown in the schematic diagram in Figure 2. These five aluminium
6
plates could then be assembled together by using eight screws to produce inside dimensions
7
of 150 mm × 20 mm × 50 mm.
8
9
Figure 3 shows the whole procedure in terms of substrate preparation using coarse
10
aggregates. For the substrate preparation, graded or crushed rocks with sizes passing 50 mm
11
and retained on 20 mm were first trimmed using a trimming saw (as shown in Figure 3a) to
12
get an appropriately rectangular aggregate with one dimension being less than 20 mm. The
13
trimmed coarse aggregates are shown in Figure 3b. The aluminium mould was then
14
assembled and a release compound (Dow Corning DC4) used to grease the inside of the
15
mould surface to avoid it sticking to the epoxy resin used in the next step, as shown in
16
Figures 3c and d. An epoxy resin bonding material (Araldite), as shown in Figure 3e, was
17
prepared by mixing the two components together according to the required proportions. The
18
trimmed aggregates were assembled into the mould followed by filling the spaces in the
19
mould with the epoxy resin as shown in Figure 3f. The assembled mould was stored at room
20
temperature for 24 hours to allow the epoxy resin to cure. After 24 hours of curing, the mould
21
was disassembled and the cured sample tipped out, as shown in Figure 3g. Finally, the cured
22
sample was cut down the middle to get two substrates with a thickness no less than 10 mm, as
23
shown in Figure 3h.
24
9
3.2.2 Adhesion specimen fabrication
1
2
The aggregate substrates, including the standard aggregate substrates and composite
3
substrates using coarse aggregates, with dimensions of 150 mm × 20 mm × 10 mm were
4
prepared as previously described. They were then bonded to the aluminium peel arm using
5
bitumen as the adhesive layer. The thickness of the bitumen adhesive layer is controlled by
6
placing five wire spacers on the aggregate and results in a 0.25 mm film thickness. The
7
sample preparation consists of the following steps [17]:
8
1. Surface pre-treatment. Aggregate substrate was ground using sand paper to get a
9
smooth surface. The ground substrate and peel arm are then wiped gently using a damp
10
paper towel to remove any dust.
11
2. Pre-heating the aggregate and the bitumen. The aggregate and peel arm are then placed
12
in an oven at 150°C for 1 hour. Bitumen is preheated to 150°C prior to making the
13
joint.
14
3. Placing the sharp crack initiator. A release Polytetrafluoroethylene (PTFE) film of
15
dimensions 20 mm × 12 mm × 75 μm is placed on the aggregate surface at one end.
16
4. Five wire spacers with a length of 20 mm are placed on the aggregate. The diameter of
17
the wire controls the thickness of the bitumen (adhesive) layer.
18
5. The liquid bitumen is applied (at 150°C) evenly along the surface of the aggregate.
19
6. The preheated aluminium peel arm (of length 50 mm longer than the aggregate
20
substrate and of thickness 0.2 mm) is placed on the top of the bitumen layer.
21
7. Gentle pressure is applied on top of the joint to control the thickness of the bitumen
22
layer. The pressure should be uniformly distributed over the bond area. The excess
23
bitumen at the edges of the specimen was trimmed with a heated knife.
24
8. All specimens were stored at room temperature ready for further testing.
10 1
3.2.3 Moisture conditioning
2
3
The prepared aggregate-bitumen adhesion specimens were tested in the dry condition or after 4
moisture-conditioned. Moisture was introduced into the aggregate-bitumen interface by 5
submerging the completed specimens in distilled water at 20°C for 7 days or 14 days. During 6
the conditioning period, moisture could reach the aggregate-bitumen interface and directly 7
attack the bond. The specimens should be tested within 1 hour after removing them from the 8
water bath. 9
10
3.2.4 Parameter evaluation
11
12
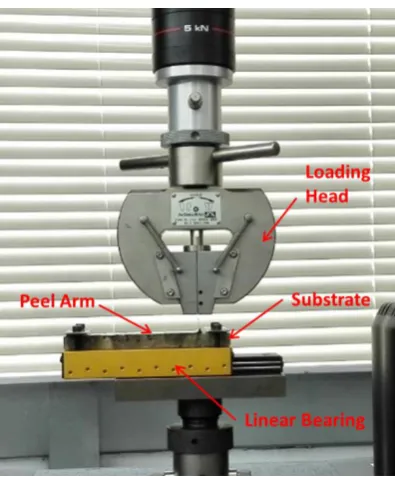
A universal testing machine (UTM) which can supply a constant rate of grip separation was
13
used to measure the tensile force during the peel test. The sample was attached to a linear
14
bearing to get a highly accurate and smooth motion. During testing, the free end of the peel
15
arm was gripped by the UTM fixture and stretched up at the speed of 10 mm/min with the
16
peel angle being maintained at 90°, as shown in Figure 4. The tensile force was recorded
17
during the fracture development and the results used to calculate the fracture energy.
18
19
The achieved peel force was first used to calculate the uncorrected adhesive fracture energy,
20
using Equation as follows:
21
22
𝐺 =𝑃
𝑏(1 − cos 𝜃) (1) 23
24
where 𝑃 is the average peel force, 𝑏 is the width of the adhesive surface and 𝜃 is the applied
11
peel angle.
1
2
Then, the corrected fracture energy is obtained by removing the energy associated with the
3
plastic bending of the peel arm:
4
5
𝐺𝐴 = 𝐺 − 𝐺𝑃 (2) 6
7
where 𝐺𝐴 is the corrected fracture energy and 𝐺𝑃 is the energy associated with the plastic
8
bending of the peel arm.
9
10
In order to calculate the fracture energy of the aggregate-bitumen bond, the mechanical
11
properties of the aluminium peel arm were first determined using the same tensile speed as
12
the peel test. In order to describe the elastic and plastic deformation of the peel arm, the
13
stress-strain curve should be fitted with a bi-linear or power law equation [19]. The purpose
14
of the bi-linear and power law curve fits is to get a number of parameters which are used to
15
calculate the fracture energy. The following parameters of the bi-linear model (Eq. 3) for the
16
peel arm were used for the plastic corrections as described in the following equation:
17
18
𝜎 = 𝜎𝑦+ 𝛼𝐸1(𝜀 − 𝜀𝑦) (3) 19
20
where 𝜎𝑦 is yield stress and 𝜀𝑦 is the yield strain, 𝐸1 is the elastic modulus of the peel arm, 𝐸2 21
is the plastic modulus of the peel arm, 𝑛 is the work hardening coefficient of the peel arm and
22
𝛼 is the ratio of plastic modulus to elastic modulus, 𝐸2⁄𝐸1.
23
24
The measured stress-strain curve was modelled using the bi-linear model and the parameters
12
gained from the fitting process are shown in Table 2. The value of the corrected fracture
1
energy was then calculated using large displacement beam theory.
2
3
4. Results
4
5
4.1 Mineralogy of aggregates
6
7
The scan images of the four aggregate surfaces obtained from MLA test are presented in
8
Figure 5 with one colors representing one type of mineral. From this figure it can be seen that
9
minerals in the granite samples (G1 and G2) exhibit considerable texture and the distribution
10
is more complex, while the limestone surfaces (L1 and L2) are simple with one dominant
11
mineral making up almost all of the mineral composition. The mineralogical compositions of
12
these four aggregates are shown in Table 3. As shown in this table, chlorite, albite and quartz
13
are the dominant minerals for these two granite aggregates with contents greater than 10%.
14
There are two other minerals, epidote and anorthite, detected in G1 and G2 respectively with
15
presences higher than 10%. For the limestone (L1 and L2) samples, calcite is the predominant
16
phase when compared to the other minerals present, with 96.98% and 99.48% by weight,
17
respectively. It is believed that the large proportion of the albite and quartz phases have the
18
potential to lead to moisture damage due to the poor adhesion between quartz and bitumen
19
[25].
20
21
4.2 Fracture energy calculation for both CSPT and standard peel test
22
23
The purpose of the peel test was to determine the fracture energy of aggregate-bitumen bonds
24
as a function of material type and moisture conditioning time. Results are presented for four
13
replicate tests performed on each aggregate-bitumen combination. The tensile force was
1
recorded by the UTM during testing and the tensile load versus displacement curve was
2
plotted. For the standard peel test, the tensile force tends to remain at an approximately
3
constant value after the initial stage. Normally, around 50 mm of constant crack propagation
4
region will be selected for average tensile force calculation and this procedure has been
5
presented in previous publications [17, 18].
6
7
In terms of the newly developed CSPT, the method to calculate the average tensile force
8
showed some difference in comparison with the standard peel test, with one type of specimen
9
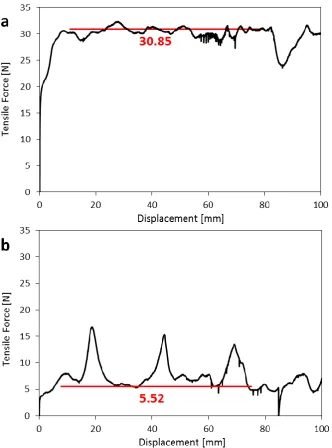
(G2) being selected to illustrate this point, as shown in Figure 6. In the dry condition, as
10
shown in Figure 6a, the tensile force values were constant with the development of the
11
fracture. This means that the average tensile force could be calculated using the same
12
approach as the standard peel test. After moisture conditioning, the tensile force is not
13
constant and three obvious fluctuations occurred with the crack propagation, as shown in
14
Figure 6b. In this condition, the values in the fluctuations need to be removed and the
15
baseline of the curve used as the useful average tensile force. The average force of each
16
sample and the parameters in Table 2 were entered into the Microsoft excel macro IC Peel
17
software to calculate the fracture energy [26].
18
19
4.3 CSPT results
20
21
4.3.1 Fracture energy in dry condition
22
23
Specimens prepared with bitumen and the four coarse aggregates (L1, L2, G1 and G2) were
24
subjected to the CSPT. The aggregates were first combined together using epoxy resin and
14
the self-designed mould followed by preparing the peel test specimen, as described in Section
1
3.2.1 and 3.2.2. The tensile load and fracture energy of specimens before and after moisture
2
damage were evaluated based on the procedures in Sections 3.2.4 and 4.2.
3
4
Table 4 shows the average fracture energy and test variability (standard deviation) of
5
specimens before moisture conditioning with results being achieved with the newly
6
developed CSPT. The standard deviation suggests the test has low variability. From this table
7
it can be seen that all specimens have almost the same fracture energy in dry condition,
8
irrespective of which aggregate was used. Without moisture conditioning, a cohesive failure
9
occurred within the bulk of the bitumen, as shown in Figure 7. The fracture energy depended
10
on the cohesive bond in the bulk of the bitumen layer. This is why all aggregates show almost
11
the same fracture energy in the dry condition.
12
13
4.3.2 Failure behaviour after moisture conditioning
14
15
To simulate the effect of moisture on the bonding properties between bitumen and aggregate,
16
the whole specimen was submersed in water at 20°C for 7 days and 14 days. During that
17
time, moisture is able to reach the aggregate-bitumen interface in three different ways:
18
through the top and bottom of the aggregate, through the edge of aggregate-bitumen interface
19
and through the bitumen film. After moisture conditioning, specimens were removed from
20
the water bath and then subjected to the peel test within 1 hour.
21
22
In this research, the loading behaviour and failure surface of the two granite samples were
23
selected for detailed analyse as shown in Figure 8. It can be seen that these samples showed
24
different loading behaviour and failure surfaces due to the different moisture sensitivity of the
15
aggregates. The sample prepared with G1 aggregate showed mainly cohesive failure with
1
adhesive failure occurring at both edges of the specimen after 14 days of moisture
2
conditioning with the tensile load not decreasing significantly in comparison with the tensile
3
load in Figure 6a. In contrast, the failure surface of G2 is nearly completely adhesive and the
4
tensile load decreased significantly. There are also three obvious fluctuations (peaks) due to
5
the cohesive failure over the epoxy resin segments between two adjacent aggregates. From
6
this figure it can be seen that the tensile load accurately reflects the failure mode which
7
demonstrates that the composite substrate could be used for fracture energy evaluation.
8
9
4.3.3 Retained fracture energy
10
11
The effect of moisture on the bond strength could be captured using a single retained fracture
12
energy percentage as a more elegant and unified way of characterising aggregate-bitumen
13
bond strength. In general, the larger the magnitude of retained fracture energy of a joint, the
14
greater the resistance to failure from applied loading after moisture conditioning. The
15
retained fracture energy of specimens after 7 days and 14 days moisture conditioning were
16
calculated by dividing the conditioned fracture energy by the dry fracture energy, and the
17
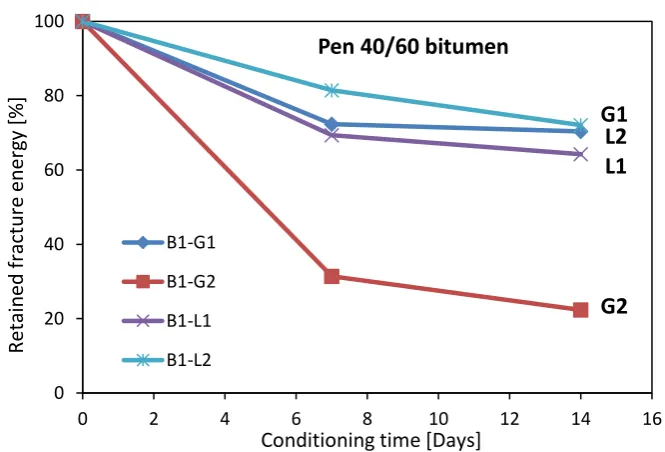
results are shown in Figure 9. Because the materials used in CSPT are coarse aggregates used
18
in actual asphalt mixture field applications, the results are much more reliable in terms of
19
identifying a ‘good’ versus ‘bad’ moisture resistant mixture.
20
21
As shown in Figure 9, one effect of moisture on the aggregate-bitumen interface is the
22
reduction in fracture energy with different aggregates showing different values. The
23
significant difference in retained fracture energy could be explained by the water adsorption
24
properties and mineral composition of the aggregates. For G1 aggregate, the dominant
16
mineral phases, albite and quartz, are considered to be sensitive to moisture damage.
1
However, because of its lower moisture absorption (0.13%), it is hard for water to diffuse
2
through the aggregate to the aggregate-bitumen interface to weaken the bond. The other
3
granite aggregate G2 with higher moisture adsorption values had the lowest retained fracture
4
energy. This is not surprising as G2 aggregate has had a long history of very poor moisture
5
damage performance in the field [27]. In terms of the limestone aggregates (L1 and L2), both
6
showed good moisture resistance due to their dominant mineral phase (calcite) being able to
7
form a stable bond with bitumen even in the presence of water. The slightly lower result of
8
L1 could be attributing to its higher water adsorption (2.21%) in comparison with L2
9
(0.46%). On this basis, it is reasonable to state that the moisture sensitivity of
aggregate-10
bitumen bonds is not only controlled by the mineralogical compositions but the moisture
11
absorption of the aggregate should also be considered.
12
13
4.4 Standard peel test results
14
15
4.4.1 Fracture energy in dry condition
16
17
Table 5 shows the dry fracture energy values of aggregate-bitumen bonds based on the
18
standard peel test. In this test, the aggregate substrates were prepared from big aggregate
19
boulders. Before moisture conditioning, all specimens showed cohesive failure surface which
20
correlated well with the newly developed CSPT. It can be seen from this table that the
21
fracture energy of these four samples show similar values demonstrating the influence of
22
aggregate is minimised. Another finding is that the fracture energy values obtained from the
23
standard peel test are similar to those from the new CSPT, as shown in Table 4. This
17
indicates that the CSPT is able to correctly evaluate the fracture energy of aggregate-bitumen
1
bonds in the dry condition.
2
3
4.4.2 Failure behaviour after moisture conditioning
4
5
The specimens prepared based on the standard peel test were also subjected to moisture
6
conditioning following the procedures as shown in Section 3.2.3. After peel testing, the
7
loading behaviour and failure surfaces of G1 and G2 were selected to compare with the CSPT
8
results, as shown in Figure 10. It can be seen that the G1 specimen results in a higher loading
9
value in comparison with G2 identical to the trend found from the CSPT results in Figure 8.
10
The G1 specimen shows cohesive failure while the G2 specimen shows mostly adhesive
11
failure. From this figure it can be seen that the tensile load has a strong relationship with the
12
failure mode. For example, the tensile load value of G2 fluctuates according to the proportion
13
of cohesive/adhesive failure with cohesive failure tending to exhibit a higher tensile load
14
while adhesive failure results in a lower value.
15
16
With the aim of directly comparing the measurements made with CSPT and the standard peel
17
test, the loading behaviour of the G1 and G2 specimens obtained from these two tests were
18
plotted in Figure 11. From this figure it can be seen that by using the same aggregate, these
19
two different tests show similar loading results thus demonstrating that the newly developed
20
CSPT could obtain similar loading behaviour as determined with the standard peel test.
21
22
4.4.3 Retained fracture energy
23
18
After moisture damage, the retained fracture energy of the four samples was defined as the
1
ratio of fracture energy after moisture conditioning to the one before moisture conditioning.
2
Plotted against time, the retained energy could be used to characterise the moisture resistance
3
with higher values suggesting better moisture resistance properties. Figure 12 shows plots of
4
retained fracture energy with conditioning time for the four specimens obtained from the
5
standard peel test. From this figure it can be seen that these four specimens showed different
6
retained fracture energy with the passage of time. This could be explained in aspects of
7
moisture absorption and mineralogical composition of aggregates as described in Section
8
4.3.3. It is noticeable that the four specimens showed the same ranking in terms of the
9
retained fracture energy as the results from CSPT (Figure 9). It can therefore be concluded
10
that the newly developed CSPT can be considered to be a reliable alternative to the standard
11
peel test to identify the moisture sensitivity of aggregate-bitumen bonds.
12
13
4.5 Correlation between CSPT and standard peel test
14
15
To quantify the relationship between the CSPT and the standard peel test, the retained
16
fracture energies from the two tests were plotted against each other. Figure 13 shows the plot
17
depicting the relationship between retained fracture energy, including 7 days and 14 days,
18
obtained from the CSPT and those from the standard peel test. It can be seen that the eight
19
results are all located on one trend line demonstrating that the CSPT and the standard peel
20
test give almost the same evaluation in terms of the moisture susceptibility of the different
21
aggregate-bitumen systems. It should be noted that in general the CSPT results are lower in
22
comparison with the standard peel test. The results suggest that the newly developed CSPT is
23
reliable in term of moisture damage evaluation and provides a more practical means of
19
assessing the moisture damage performance of aggregate-bitumen systems using actual
1
asphalt mixture coarse aggregates rather than large aggregate boulders.
2
3
5. Conclusions
4
5
The following conclusions were deduced based on the results presented in this study:
6
As shown by both the CSPT and standard peel test, the aggregate properties do not
7
influence the bonding strength of aggregate-bitumen combinations in the absence of
8
moisture when the dominant failure mechanism is cohesive. Under these dry conditions
9
the samples from both tests showed similar fracture energy values.
10
The magnitude of the fracture energy in the presence of water was found to be
11
aggregate type dependent rather than bitumen dependent with failure being adhesive in
12
nature. The tests demonstrated that the physico-chemical properties of the aggregates
13
play a fundamental and significant role in the development of the moisture damage
14
performance of aggregate-bitumen bonds.
15
The newly developed CSPT was found to be effective in characterising the moisture
16
resistance of the aggregate-bitumen bonds.
17
The retained fracture energy results were shown to be sensitive to moisture
18
conditioning and the moisture resistance could be explained by the moisture adsorption
19
and mineralogical compositions of the aggregates. Limestone tended to have better
20
resistance to moisture damage than granite with the same moisture adsorption.
21
Furthermore, in terms of similar mineralogical compositions, lower moisture adsorption
22
resulted in better moisture resistance.
23
The newly developed CSPT and the standard peel test showed the same ranking in
24
terms of the moisture damage evaluation demonstrating that the CSPT is a reliable and
20
feasible design to assess the moisture damage performance of aggregate-bitumen
1
systems.
2
3
Acknowledgements
4
The authors acknowledge the assistance of the following Nottingham Transportation
5
Engineering Centre personnel: Richard Blackmore, Lawrence Pont and Jonathan Watson for
6
material testing.
7
8
References
9
1. https://www.gov.uk/government/statistics/road-lengths-in-great-britain-2014
10
2. Airey G. and Wu J. The influence of aggregate interaction and aging procedure on
11
bitumen aging [J]. Journal of Testing and Evaluation, 2009, 37(5): 1-8.
12
3. Qiao Y., Flintsch G., Dawson A. and Parry T. Examining Effects of Climatic Factors
13
on Flexible Pavement Performance and Service Life [J]. Transportation Research
14
Record: Journal of the Transportation Research Board, 2013 (2349): 100-107.
15
4. Annual Local Authority Road Maintenance (ALARM) Survey 2014. Asphalt Industry
16
Alliance,
17
〈http://www.asphaltindustryalliance.com/images/library/files/ALARM_Survey_2014.
18
pdf〉[accessed 03.07.14].
19
5. Airey G.D., Choi Y.K., Collop A.C., Moore A.J.V. and Elliott R.C. Combined
20
Laboratory Ageing/Moisture Sensitivity Assessment of High Modulus Base Asphalt
21
Mixtures (With Discussion) [J]. Journal of the Association of Asphalt Paving
22
Technologists, 2005, 74: 307-346.
23
6. Kim Y.R., Little D.N. and Lytton R.L. Effect of moisture damage on material
24
properties and fatigue resistance of asphalt mixtures. Journal Transportation Research
21
Record (TRB) 2004; 1891: 48–54.
1
7. Mehrara A. and Khodaii A. A review of state of the art on stripping phenomenon in 2
asphalt concrete [J]. Construction and Building Materials, 2013, 38: 423-442.
3
8. Apeagyei A.K., Grenfell J.R.A. and Airey G.D. Observation of reversible moisture 4
damage in asphalt mixtures [J]. Construction and Building Materials, 2014, 60: 73-80.
5
9. Lu Q. Investigation of conditions for moisture damage in asphalt concrete and
6
appropriate laboratory test methods [D]. University of California Transportation
7
Center, 2005.
8
10.Grenfell J., Ahmad N., Liu Y., Apeagyei A., Large L and Airey G. Assessing asphalt
9
mixture moisture susceptibility through intrinsic adhesion, bitumen stripping and
10
mechanical damage [J]. Road Materials and Pavement Design, 2014, 15(1): 131-152.
11
11.Grenfell J., Ahmad N., Airey G.D., Collop A.C. and Elliott R. Optimising the
12
moisture durability SATS conditioning parameters for universal asphalt mixture
13
application. International Journal of Pavement Engineering 2012; 13(5): 433–50.
14
12.Fromm H.J. The mechanisms of asphalt stripping from aggregates surfaces. Journal of
15
the Association of Asphalt Paving Technologists 1974, vol. 43, pp. 191-223.
16
13.Mo L., Huurman M., Wu S. and Molenaar A.A.A. Ravelling investigation of porous
17
asphalt concrete based on fatigue characteristics of bitumen–stone adhesion and
18
mortar [J]. Materials & Design, 2009, 30(1): 170-179.
19
14.Whiteoak D. The shell bitumen handbook [M]. Shell Bitumen UK, 1990.
20
15.Liu Y., Apeagyei A., Ahmad N., Grenfell G. and Airey G. Examination of moisture
21
sensitivity of aggregate–bitumen bonding strength using loose asphalt mixture and
22
physico-chemical surface energy property tests [J]. International Journal of Pavement
23
Engineering, 2014, 15(7): 657-670.
22
16.Airey G.D. and Choi Y.K. State of the art report on moisture sensitivity test methods
1
for bituminous pavement materials [J]. Road Materials and Pavement Design 2002,
2
3(4): 355-372.
3
17.Zhang J., Airey G.D. and Grenfell J.R.A. Experimental evaluation of cohesive and
4
adhesive bond strength and fracture energy of bitumen-aggregate systems[J].
5
Materials and Structures, 2015: 1-15.
6
18.Zhang J., Apeagyei A.K., Airey G.D. and Grenfell J.R.A.. Influence of aggregate
7
mineralogical composition on water resistance of aggregate–bitumen adhesion [J].
8
International Journal of Adhesion and Adhesives, 2015, 62: 45-54.
9
19.Blackman B.R.K., Cui S., Kinloch A.J. and Taylor A.C. The development of a novel
10
test method to assess the durability of asphalt road-pavement materials. International
11
Journal of Adhesion and Adhesives 2013; 42: 1-10.
12
20. Zhang J., Apeagyei A.K. and Airey G.D. Effect of Aggregate Composition on
13
Moisture Sensitivity of Aggregate-Bitumen Bonds, Transportation Research Board 14
94th Annual Meeting. 2015 (15-0999). 15
21.Kawashita L.F., Moore D.R. and Williams J.G. Analysis of peel arm curvature for the
16
determination of fracture toughness in metal-polymer laminates. Journal of materials
17
science 2005; 40(17): 4541-4548.
18
22.Horgnies M., Willieme P. and Gabet O. Influence of the surface properties of
19
concrete on the adhesion of coating: Characterization of the interface by peel test and
20
FT-IR spectroscopy. Progress in Organic Coatings 2011; 72(3): 360-379.
21
23.Leforestier E., Darque-Ceretti E., Peiti D. and Bolla M. Peeling and characterisation
22
of the carbon fibre-based radicular adhesive anchorage interface, International Journal
23
of Adhesion and Adhesives 2007; 27(8): 629–635.
23
24.Horgnies M., Darque-Ceretti E., Fezai H. and Felder E. Influence of the interfacial
1
composition on the adhesion between aggregates and bitumen: Investigations by
2
EDX, XPS and peel tests. International Journal of Adhesion and Adhesives 2011;
3
31(5): 238–247.
4
25.Apeagyei A.K., Grenfell J. and Airey G.D. Moisture-induced strength degradation of
5
aggregate–asphalt mastic bonds. Road Materials and Pavement Design 2014; 15(1):
6
239-262.
7
26.IC Peel software. http://www3.imperical.ac.uk/meadhesion/testprotocols/peel.
8
Imperial College London. Accessed 14 March 2013.
9
27.Airey G.D., Collop A.C., Zoorob S.E. and Elliott R.C. The influence of aggregate,
10
filler and bitumen on asphalt mixture moisture damage. Construction and Building
11
Materials 2008, 22(9): 2015-2024.
12
13
14
15
16
17
18
19
20
21
24
Figures
1 2
[image:24.595.95.499.308.537.2]3
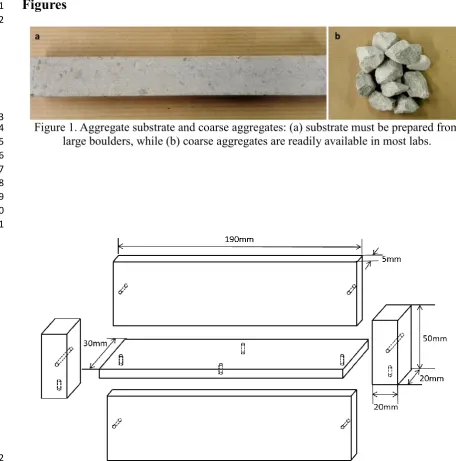
Figure 1. Aggregate substrate and coarse aggregates: (a) substrate must be prepared from
4
large boulders, while (b) coarse aggregates are readily available in most labs.
5 6 7 8 9 10 11
12
Figure 2. Schematic of the aluminium mould used for composite substrate preparation
25 1
Figure 3. Procedures for aggregate substrate preparation: (a) trim saw, (b) aggregates after
2
trimming, (c) release compound, (d) assembled mould, (e) epoxy resin, (f) combine trimmed
3
aggregates in the mould and fill the gaps with epoxy resin, (g) cured composite aggregate, (h)
4
composite substrate used for peel test.
5 6 7 8
9 10
Figure 4. Details of peel test equipment
[image:25.595.198.396.485.724.2]26 1
Figure 5. Scanned images of aggregate surfaces with one colors representing one type of
2
mineral
27 1
Figure 6. Measured tensile stress-strain curve of: (a) B1-G2 in dry condition using CSPT and
2
(b) B1-G2 after 14 days conditioning using CSPT. The three fluctuations presented in Figure
3
6b are due to the epoxy resin segments between two aggregates resulting in high bond
4
strength with bitumen even after moisture damage.
5 6 7 8 9
10
Figure 7. Failure surface of specimens prepared with G2 aggregates in dry condition
[image:27.595.93.496.633.717.2]28 1
Figure 8. Failure surfaces and loading behaviour of two specimens (G1 and G2) after 14 days
2
of moisture conditioning using CSPT
3 4 5 6 7
8
Figure 9. Retained fracture energy with respect to moisture damage achieved from CSPT
9 10
0 20 40 60 80 100
0 2 4 6 8 10 12 14 16
B1-G1
B1-G2
B1-L1
B1-L2
Retain
ed
fr
actu
re
en
erg
y
[%]
Conditioning time [Days]
G2 Pen 40/60 bitumen
[image:28.595.130.463.494.720.2]29 1
Figure 10. Failure surfaces and loading behaviour of two samples (G1 and G2) after 14 days
2
of moisture conditioning using standard peel test
3 4 5 6 7
8
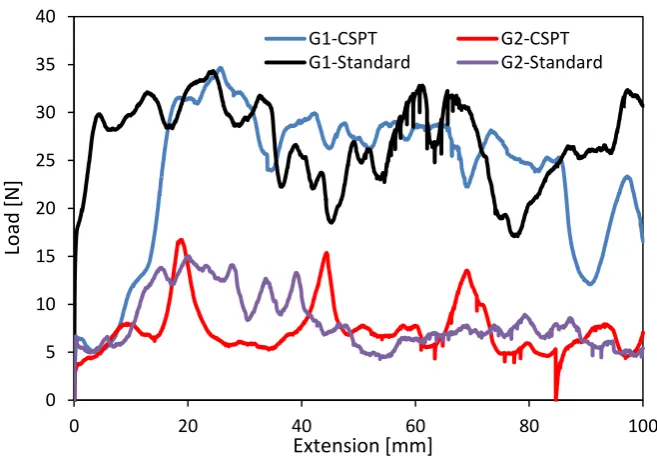
Figure 11. Loading behaviour of two samples (G1 and G2) after 14 days of moisture
9
conditioning obtained using both standard peel test and CSPT
10
0 5 10 15 20 25 30 35 40
0 20 40 60 80 100
G1-CSPT G2-CSPT
G1-Standard G2-Standard
Extension [mm]
Lo
ad
[
N
[image:29.595.132.461.506.734.2]30 1
[image:30.595.132.462.87.308.2]2
Figure 12. Retained fracture energy with respect to moisture damage achieved from standard
3 peel test 4 5 6 7 8
Figure 13. Plots of CSPT retained fracture energy and standard peel test retained fracture
9
energy of specimens prepared with B1 bitumen showing good agreement between these two
10 tests 11 12 13 14 15 16 17
y = 1.0971x + 12.736 R² = 0.8439
0 20 40 60 80 100 120
0 20 40 60 80 100
CSPT retained fracture energy [%]
Stan d ar d peel test retai n ed fr actu re en erg y [%] 0 20 40 60 80 100
0 2 4 6 8 10 12 14 16
B1-G1 B1-G2 B1-L1 B1-L2 Retain ed fr actu re en erg y [%]
Conditioning time [Days]
G2 Pen 40/60 bitumen
[image:30.595.135.462.383.608.2]31
Tables
1 2
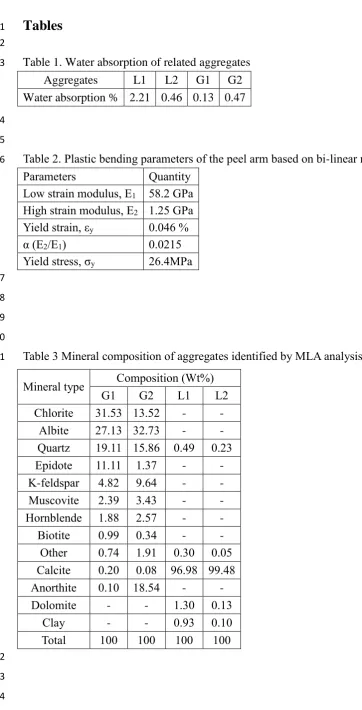
Table 1. Water absorption of related aggregates
3
Aggregates L1 L2 G1 G2 Water absorption % 2.21 0.46 0.13 0.47
4 5
Table 2. Plastic bending parameters of the peel arm based on bi-linear model fit
6
Parameters Quantity
Low strain modulus, E1 58.2 GPa High strain modulus, E2 1.25 GPa Yield strain, εy 0.046 % α (E2/E1) 0.0215 Yield stress, σy 26.4MPa
7 8 9 10
Table 3 Mineral composition of aggregates identified by MLA analysis
11
Mineral type Composition (Wt%)
G1 G2 L1 L2
Chlorite 31.53 13.52 - - Albite 27.13 32.73 - - Quartz 19.11 15.86 0.49 0.23 Epidote 11.11 1.37 - - K-feldspar 4.82 9.64 - - Muscovite 2.39 3.43 - - Hornblende 1.88 2.57 - - Biotite 0.99 0.34 - -
Other 0.74 1.91 0.30 0.05 Calcite 0.20 0.08 96.98 99.48 Anorthite 0.10 18.54 - -
Dolomite - - 1.30 0.13
Clay - - 0.93 0.10
Total 100 100 100 100
32
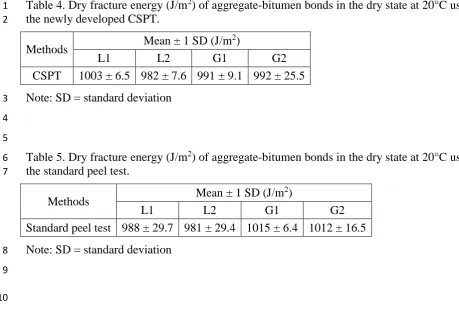
Table 4. Dry fracture energy (J/m2) of aggregate-bitumen bonds in the dry state at 20°C using
1
the newly developed CSPT.
2
Methods Mean ± 1 SD (J/m
2)
L1 L2 G1 G2
CSPT 1003 ± 6.5 982 ± 7.6 991 ± 9.1 992 ± 25.5
Note: SD = standard deviation
3 4 5
Table 5. Dry fracture energy (J/m2) of aggregate-bitumen bonds in the dry state at 20°C using
6
the standard peel test.
7
Methods Mean ± 1 SD (J/m
2)
L1 L2 G1 G2
Standard peel test 988 ± 29.7 981 ± 29.4 1015 ± 6.4 1012 ± 16.5
Note: SD = standard deviation
8 9