The comparative performance and behaviour of concrete
elements containing glass-fibre reinforced plastic
reinforcing bars.
ULAS, Esref M.
Available from Sheffield Hallam University Research Archive (SHURA) at:
http://shura.shu.ac.uk/20467/
This document is the author deposited version. You are advised to consult the
publisher's version if you wish to cite from it.
Published version
ULAS, Esref M. (2001). The comparative performance and behaviour of concrete
elements containing glass-fibre reinforced plastic reinforcing bars. Masters, Sheffield
Hallam University (United Kingdom)..
Copyright and re-use policy
I
SHEFFIELD, SI 1WB.
I
1 0 1 7 1 5 6 2 6 3
ProQuest Number: 10701114
All rights reserved
INFORMATION TO ALL USERS
The quality of this reproduction is dependent upon the quality of the copy submitted.
In the unlikely event that the author did not send a com plete manuscript and there are missing pages, these will be noted. Also, if material had to be removed,
a note will indicate the deletion.
uest
ProQuest 10701114
Published by ProQuest LLC(2017). Copyright of the Dissertation is held by the Author.
All rights reserved.
This work is protected against unauthorized copying under Title 17, United States C ode Microform Edition © ProQuest LLC.
ProQuest LLC.
789 East Eisenhower Parkway P.O. Box 1346
The comparative performance and behaviour of
concrete elements containing glass fibre-reinforced
plastic reinforcing bars
E§ref Muzaffer Ula§
A thesis submitted in partial fulfilment of the requirements of
Sheffield Hallam University
for the degree of Master of Philosophy
ABSTRACT
Corrosion of steel reinforcement is a major concern in concrete construction, particularly in aggressive environments. Therefore corrosion resistant materials such as fibre
composites are becoming increasingly feasible as an alternative concrete reinforcement. There are relatively few reported design guidelines for fibre composites in concrete. Hence, there is an urgent need for research and development to extend existing guidelines and standards such as those produced by the UK Institution of Structural Engineers and the ACI Committee (US), to encourage the wider use and acceptance of fibre composites as an alternative to steel in reinforced concrete elements.
This investigation compares the behaviour and properties of a range of reinforced concrete beams under two point loading comprising different concrete grades and types using both steel and Glass Fibre Reinforced Plastic (GFRP) as primary and secondary reinforcement. A variety of conventional and ‘novel’ rebar configurations were used to assess their effect upon material efficiency and load capacity. Compressive and tensile strength and elastic moduli of all component properties were measured together with load, deflection, rebar and concrete strains on the reinforced concrete beams. Health and safety concepts through a risk assessment process were introduced for the testing at an early stage of the
investigation.
Principal measures of beam performance include the ultimate load capacity, stiffness and failure modes together with a ‘performance quotient’; a mathematical expression derived as an efficiency comparator for beams of different types and composition. Photographic and video records were also used to monitor behaviour throughout. Experimental
measurements generally showed good agreement with the corresponding theoretical, quasi- theoretical and design based values although the latter tended to overestimate the structural performance of the beams. In general, load capacity increased with increase in main rebar area but was affected to a lesser extent by concrete strength. The beams reinforced with steel had a greater load capacity than those reinforced with GFRP. However, GFRP reinforced beams generally displayed a greater capacity to absorb energy than steel but exhibited reduced stiffness at any given load although this was enhanced by the inclusion of glass fibres in the mix. Cracks in the GFRP reinforced beams were usually larger and deeper compared with those in the equivalent steel reinforced beams. Failure of the more lightly reinforced steel beams, including one GFRP beam, were predominantly in ‘flexure’. The more heavily reinforced steel and the remainder of the GFRP reinforced beams
exhibited mostly ‘shear-bond’ type failure. The ‘novel’ rebar geometry proved to be a simple, efficient and viable alternative to conventional rebar configurations in terms of load capacity and preferred mode of failure.
It is suggested that further developments and applications could focus on small reinforced concrete elements such as lintels in aggressive environments and further refinement of the
DEDICATION
To my precious mother Ay§e Aysel and my father Ibrahim Mesut for their love, support and prayers...
Declaration
I hereby declare that no portion of the work referred to in this thesis has been submitted in
support of an application for another degree or qualification of this or any other university or other institution of learning. All sources of information have been duly acknowledged.
Esref Muzaffer Ulas
ACKNOW LEDGEMENTS
Firstly, the Author would like to express his deep and sincere gratitude to his supervisor, Mr Clifford Ellis for his continuous supervision, encouragement, support and valuable suggestions throughout the preparation o f this work.
The Author would like to thank Prof. Pritpal S. Mangat for recommending him to
undertake this research and recognising his potential in this field. The Author also would like to thank Dr. Fethi Al-Shawi for his help.
The Author appreciates the assistance of the IT and the technical staff, David Flatt, Howard Skipworth, Simon Outhwaite, Robert Skelton, Geoff Harwood, John Bickers, Peter Lonsbrough and Kevin Mason of the School of Environment and Development (former School o f Construction).
The Author is very grateful for financial supports through teaching and the research studentship over the years provided by the school at Sheffield Hallam University.
Thanks also go to all my past and present colleagues and friends at Sheffield Hallam University in particular, my comrades Miles Seaton, Finbar O’Flaherty and Feridun Duman, my mentors Sophie Maluski and Marinela Colina, Margaret Godwin (the best PA), Edita Varga, Shirley Gunee for their help and many happy memories over the past years. I wish them and their families more happiness in the future.
Table of Contents
Page
Abstract (ii)
Dedication (iii)
Declaration (iv)
Acknowledgements (v)
Table of Contents (vi)
List of Tables (xiii)
List of Figures (xvii)
Notations (xxii)
CHAPTER 1 1
1. INTRODUCTION 1
1.1 Background 1
1.2 Research Aims and Objectives 5
1.3 Thesis Layout 6
1.4 References 7
CHAPTER 2 8
2. LITERATURE REVIEW 8
2.1 Fibre Reinforced Plastic (FRP) Reinforcement 8
2.1.1 Fibre Types & Forms 8
2.1.1.1 Carbon Fibres 10
2.1.1.2 Aramid Fibres 10
2.1.1.3 Glass Fibres 11
2.1.1.4 Steel Fibres 12
2.1.1.5 Comparison of Carbon, Aramid and Glass Fibres 12
2.1.2 Resin Types 13
2.1.2.1 Thermosetting 14
2.1.2.2 Thermoplastic 15
2.1.2.3 Manufacture of Different Type and Size of FRP
Reinforcements 15
2.1.3 Comparison of FRP Reinforcements compared to Conventional
Steel Reinforcements 18
2.1.3.1 Manufacturers of FRP Composites for Concrete 18
2.2.1 Tensile Strength 20
2.2.2 Tensile Modulus of Elasticity 22
2.2.3 Compressive Strength 23
2.2.4 Compressive Modulus of Elasticity 23
2.2.5 Poisson’s Ratio 23
2.2.6 Shear Strength 24
2.2.6.1 Determination of Shear Properties 24
2.2.7 Relative Density 25
2.2.8 Coefficient of Thermal Expansion 25
2.3 Factors Affecting Performance of FRP Reinforcements 26
2.3.1 Void Content 26
2.3.2 Fatigue 26
2.3.3 Creep 26
2.3.4 Environmental Factors 27
2.3.4.1 Moisture & Incompatible Chemicals 28
2.3.4.2 Temperature 29
2.3.4.3 Stress Corrosion/Environmental Stress Cracking 30
2.3.4.4 Fire 31
2.3.4.5 Ultraviolet Rays 32
2.4 Bond Performance of Reinforcements 33
2.4.1 Steel Rebars 33
2.4.2 FRP Rebars 42
2.5 Field Applications of FRP Reinforcements 45
2.6 Cost Consideration 47
2.7 FRP Reinforced Concrete Elements 49
2.7.1 Externally Reinforced Concrete Elements Using FRP Composites 49
2.7.2 FRP Grid Reinforcements Used in Concrete Elements 52
2.7.3 Prestressed Concrete Beams Using FRP Tendons 53
2.7.4 Unstressed Concrete Beams Reinforced with FRP Composites 55
2.8 Conclusions 65
2.9 References 72
CHAPTER 3 86
3. EXPERIMENTAL WORK 86
3.1 Test Programme & Methodology 86
3.1.1 Part 1 - FRP & Steel Reinforced Normal, Medium and
3.1.2 Part 2 - High Strength Concrete Beams Reinforced with GFRP Reinforcing Bars Using Straight & Curved Geometric
Configurations 91
3.1.2.1 Procedure for Rebar Fixing 93
3.1.3 Part 3 - Various Concrete Types of Beams Reinforced with Optimum
GFRP Rebar Configurations 95
3.1.4 Part 4 - Normal Weight (C20) Concrete Beams Reinforced with GFRP and High Tensile Steel Rebars combined with
GFRP & Steel Stirrups 98
3.2 Materials 101
3.2.1 Reinforcement 101
3.2.1.1 Steel Rebars 101
3.2.1.2 GFRP Rebars 105
3.2.1.3 Tests Methods & Properties 106
3.2.1.3.1 Method 1 - GFRP rebars having plain ends 109
3.2.1.3.2 Method 2 - GFRP rebars having cast ends 111
3.2.1.3.3 Review of test methods and properties 118
3.2.2 Cementitious Materials 123
3.2.2.1 Cement 123
3.2.2.2 Microsilica 123
3.2.2.3 Chopped Glass Fibre Strands 124
3.2.3 Aggregates 125
3.2.3.1 Coarse aggregates 125
3.2.3.1.1 Normal weight 125
3.2.3.1.2 Lightweight 125
3.2.3.2 Fine Aggregate 125
3.2.4 Admixtures 127
3.2.5 Concrete Mixes 127
3.2.5.1 Properties & Mix Proportions 127
3.2.5.1.1 Normal, Medium and High Strength Concrete 127
3.2.5.1.1.1 Mixing Process 128
3.2.5.1.2 Microsilica Added Concrete 128
3.2.5.1.2.1 Mixing Process 129
3.2.5.1.3 Glassfibre Concrete Mix 129
3.2.5.1.3.1 Mixing Process 130
3.2.5.1.4 Lightweight Concrete 130
3.3. Manufacturing and Curing of Concrete Specimens 131
3.4 Instrumentation 133
3.4.1 Electrical Resistance Strain Gauges 133
3.4.1.1 Determination of a Suitable Location for the
Strain Gauges 135
3.4.2 Extensometer Gauges 139
3.4.3 Linear Variable Differential Transformer (LVDT) 139
3.4.4 Health and Safety Risk Assessment on Structural Testing of
Concrete Beams 141
3.5 Test Procedure 142
3.6 Conclusions 143
3.6.1 Materials 143
3.6.2 Equipment 143
3.6.3 Method of Monitoring Test 143
3.7 References 145
CHAPTER 4 147
4. PART 1: GFRP & STEEL REINFORCED NORMAL, MEDIUM AND HIGH
STRENGTH CONCRETE BEAMS 147
4.1 Section design and Detailing 147
4.1.1 Concrete Beam Sizing 147
4.2 Experimental and Theoretical Results 147
4.2.1 Behaviour up to Failure 147
4.2.2 Reinforcement Strains in the Maximum Bending Moment region 149
4.2.3 Reinforcement Strains in the Shear region 157
4.2.3.1 Concrete Strains in the Maximum Bending
Moment Region 160
4.2.3.2 Maximum Concrete Compressive Strain 170
4.2.3.3 Neutral Axis depth at the uncracked and the
cracked sections 173
4.2.4 Elastic & Ultimate Load/Moment Capacities 176
4.2.5 Ultimate Shear Capacity 179
4.2.6 Deflection 181
4.2.7 Cracking Behaviour 188
4.2.7.1 Modes of Failure 190
4.2.7.2 Estimation of Flexural Crack Widths 196
4.4 Conclusions 4.5 References
202
205
CHAPTER 5 206
5. PART 2: HIGH STRENGTH CONCRETE BEAMS WITH GFRP REBARS
USING CURVED & STRAIGHT GEOMETRIC CONFIGURATION 206
5.1 Experimental and Theoretical Results 206
5.1.1 Behaviour up to Failure 206
5.1.2 Reinforcement Stresses and Strains in the Maximum Bending
Moment Region 211
5.1.3 Reinforcement Strains in the Shear region 215
5.1.4 Concrete Strains in the Maximum Bending Moment Region 217
5.1.4.1 Maximum Concrete Compressive Strain 221
5.1.4.2 Neutral Axis depth at the uncracked and the
cracked sections 222
5.1.5 Concrete Strains in the Shear Region 225
5.1.6 Elastic & Ultimate Load/Moment Capacities 226
5.1.7 Ultimate Shear Capacity 228
5.1.8 Deflection 230
5.1.9 Cracking Behaviour 234
5.1.9.1 Modes of Failure 237
5.1.9.2 Estimation of Flexural Crack Widths 241
5.2 Performance Quotient (Qpi) 242
5.3 Conclusions 244
5.4 References 246
CHAPTER 6 247
6. PART 3: BEAMS OF VARIOUS CONCRETE TYPES REINFORCED WITH
OPTIMUM GFRP REBAR CONFIGURATIONS 247
6.1 Experimental and Theoretical Results 247
6.1.1 Behaviour up to Failure 247
6.1.2 Reinforcement Stresses and Strains in the Maximum Bending
Moment Region 249
6.1.3 Reinforcement Strains in the Shear region 254
6.1.4 Concrete Strains in the Maximum Bending Moment Region 255
6.1.4.1 Maximum Concrete Compressive Strain 260
the cracked sections 261
6.1.5 Concrete Strains in the Shear Region 264
6.1.6 Elastic & Ultimate Load/Moment Capacities 267
6.1.7 Ultimate Shear Capacity 269
6.1.8 Deflection 271
6.1.9 Cracking Behaviour 275
6.1.9.1 Modes of Failure 278
6.1.9.2 Estimation of Flexural Crack Widths 280
6.2 Performance Quotient (Qpi) 281
6.3 Conclusions 283
CHAPTER 7 287
7. PART 4: NORMAL WEIGHT CONCRETE BEAMS REINFORCED WITH GFRP AND HIGH TENSILE STEEL REBARS WITH GFRP AND MILD STEEL
STIRRUPS 287
7.1 Section Design and Detailing 287
7.2 Experimental and Theoretical Results 288
7.2.1 Behaviour up to Failure 288
7.2.2 Reinforcement Stresses and Strains in the Maximum Bending
Moment Region 293
7.2.3 Strains in the top bars at the maximum bending moment region 297
7.2.4 Reinforcement Strains in the Shear region 298
7.2.5 Stirrup strains in the shear region 299
7.2.6 Concrete Strains in the Maximum Bending Moment Region 300
7.2.6.1 Maximum Concrete Compressive Strain 305
7.2.6.2 Neutral Axis depth at the uncracked and
the cracked sections 306
7.2.7 Concrete Strains in the Shear Region at the location of
tension rebars 309
7.2.8 Concrete Strains in the Shear Region at the location of stirrups 310
7.2.9 Elastic & Ultimate Load/Moment Capacities 310
7.2.10 Ultimate Shear Capacity 313
7.2.11 Deflection 315
7.2.12 Cracking Behaviour 319
7.2.13 Modes of Failure 320
7.4 Conclusions 325
CHAPTER 8 328
8. CONCLUSIONS & RECOMMENDATION FOR FUTURE RESEARCH 328
8.1 Summary Review 328
8.2 Conclusions 333
8.3 Summary of Key Findings 341
8.4 Recommendation for Future Research 342
APPENDIX 1: Typical Tensile Properties of Single Fibres (xxv)
APPENDIX 2: The Comparison of Selected High Performance Fibres (xxvi)
APPENDIX 3: Grading Curve for Fine Aggregate (xxvii)
Grading Curve for Lightweight Aggregate (xxviii)
Grading Curve for Coarse Aggregate (xxix)
APPENDIX 4: A Representative Stress vs Strain of C20 Grade Concrete Cylinder used for
Determination of concrete modulus of elasticity (xxx)
APPENDIX 5: Sample Calculations (xxxi)
APPENDIX 6,7 & 8: The Crack Patterns of the Concrete Beams Tested in Parti (xlix)
APPENDIX 9: Geometrical Definition of the GFRP rebars used in Part 5 and Part 6 (lvi)
LIST OF PUBLICATIONS
1. A paper published in the ‘Proceedings of International Conference, Concrete in Mankind’, Dundee, Scotland, 1996.
2. An abstract published in ‘The Institution of Structural Engineers Young Researcher’s Conference’, London, UK, 1999.
List of Tables
Page
Table 2.1 Approximate chemical compositions of some glass fibres (wt %) 11
Table 2.2 Typical physical and mechanical properties of thermosetting resins 14
Table 2.3 Typical physical and mechanical properties of thermoplastic resins 15
Table 2.4 The common type resins used in different manufacturing technique 16
Table 2.5 Manufacturers of FRP composites 19
Table 2.6 The range of tensile strengths of different type of FRP composites 20
Table 2.7 The melting points of different materials 32
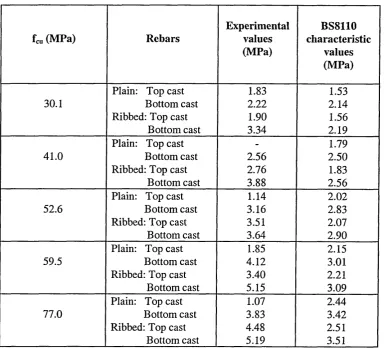
Table 2.8 The comparison of bond strength of steel rebars in concrete through
experimental results and BS8110 36
Table 2.9 Comparison of bond stresses measured using three methods 38
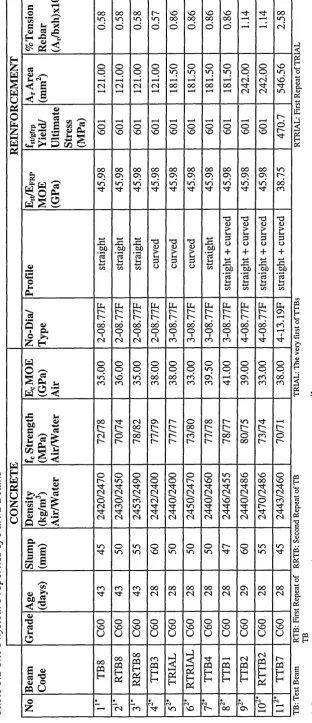
Table 3.1 The Physical Properties of Part 1 Beams 90
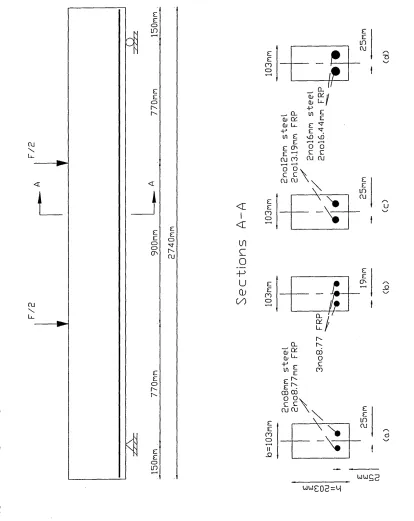
Table 3.2 The Physical Properties of Part 2 Beams 94
Table 3.3 The Physical Properties of Part 3 Beams 97
Table 3.4 The Physical Properties of Part 4 Beams 100
Table 3.5 Chemical composition of the steel rebars provided by the manufacturer 102
Table 3.6 Tensile Properties of steel rebars 103
Table 3.7 Typical mechanical properties of GFRP specified by the manufacturer 105
Table 3.8 GFRP and steel rebar diameters and the areas of the cross section 105
Table 3.9 Comparison of tensile test results of GFRP rebars from three different
methods of end anchorage 107
Table 3.10 Standards available for tensile test speed 108
Table 3.11 Technical data ofSikadur 32 112
Table 3.12 Comparison on the tensile properties of GFRP rebars using two different test speed extracted from Japanese and American Standards 113
Table 3.13 The tensile test results reported by Malvar 121
Table 3.14 Tensile test results of steel and GFRP rebras used in this study 122
Table 3.16 OPC-Normalweight concrete Properties & mix proportions 128
Table 3.17 OPC-Microsilica Concrete properties & mix proportions 128
Table 3.18 Cement-Glassfibre Concrete properties & mix proportions 129
Table 3.19 Cement-microsilica-lighweight Concrete properties & mix proportions 130
Table 3.20 Details of the two types of strain gauges 133
Table 3.21 Adhesives used in strain gauge installation 135
Table 3.22 Average pitch length of FRP rebars 136
Table 4.1 The physical properties and the test results used in the analysis of Part 1 148
Table 4.2 The comparison of tensile stresses in steel and GFRP rebars from the
tensile test and BS8110 equation 154
Table 4.3 The comparison of tensile strains in steel and GFRP rebars obtained from the ‘tensile; and ‘bending’ tests at failure load 156
Table 4.4 Extrapolated maximum concrete compressive strains in the beams 171
Table 4.5 The experimental and theoretical neutral axis depths of the beams at the
uncracked nd cracked sections 175
Table 4.6 Initial & ultimate load/moment capacity of Part 1 beams obtained from
theory and experiment 178
Table 4.7 Ultimate shear capacity of Part 1 beams 180
Table 4.8 Deflections of C20, C40 and C60 beams reinforced with GFRP/steel
rebars 187
Table 4.9 Average number of cracks in 8mm diameter steel and 8.77 mm diameter
GFRP reinforced beams at failure 189
Table 4.10 Average number of cracks in 12mm diameter steel and 13.19 mm diameter
GFRP reinforced beams at failure 189
Table 4.11 Average number of cracks in 16mm diameter steel and 16.44 mm diameter
GFRP reinforced beams at failure 190
Table 4.12 The modes of failure of <p8 steel and (j)8.77 GFRP reinforced C20, C40
and C60 concrete beams 194
Table 4.13 The modes of failure of (pi 2 steel and (pi 3.19 GFRP reinforced C20, C40
and C60 concrete beams 195
Table 4.14 The modes of failure of (pi 6 steel and (pl6.44 GFRP reinforced C20, C40
and C60 concrete beams 196
Table 4.16 Performance of Part 1 beams based upon performance quotient 201 Table 5.1 The physical properties and test results used in the analysis of Part 2 208
Table 5.2 The comparison of tensile stresses and strains in GFRP rebars from
the tensile and bending test (using BS8110 equation) 214
Table 5.3 Extrapolated maximum concrete compressive strains in the beams 221
Table 5.4 The experimental and the theoretical neutral axis depth of the beams at
the uncracked and cracked sections 222
Table 5.5 Elastic & ultimate load/moment capacity of Part 2 beams obtained from
theory and experiment 227
Table 5.6 Ultimate shear capacity of Part 2 beams 229
Table 5.7 Theoretical and experimental deflections of Part 2 beams 233
Table 5.8 The summary of average cracks in the beams 234
Table 5.9 The modes of failure of (p8.77 and (j)13.19 ‘straight o n l y ‘curved only’
and ‘straight and curved’ profile GFRP reinforced C60 concrete beams 240
Table 5.10 The estimated crack widths of Part 2 beams 241
Table 5.11 Performance Quotient of Part 2 Beams 243
Table 6.1 The physical properties and test results used in the analysis of Part 3 248
Table 6.2 The comparison of tensile stresses and strains in GFRP rebars from the
tensile test and BS8110 equation 253
Table 6.3 Extrapolated maximum concrete compressive strains in the beams 260
Table 6.4 The experimental and the theoretical neutral axis depth of the beams at the
uncracked and cracked sections 262
Table 6.5 A typical glassfibre added concrete strains measured from the shear regions of the beams reinforced with 4No8.77 and 4Nol3.19 GFRP rebars 265
Table 6.6 Elastic and ultimate load/moment capacity of Part 3 beams obtained from
theory and experiment 268
Table 6.7 Ultimate shear capacity of Part 3 beams 270
Table 6.8 Theoretical and experimental deflections of Part 3 beams 274
Table 6.9 The summary of average cracks in the beams 277
Table 6.10 The modes of failure of4No8.77 and 4Nol3.19 ‘straight and curved’
profile GFRP reinforced beams of various types 279
Table 6.12 Performance quotient of Part 3 beams 282
Table 7.1 The physical properties and test results used in the analysis of Part 4 beams 292
Table 7.2 The comparison of tensile stresses and strains in GFRP rebars from the
tensile and bending test (using BS8110 equation) 296
Table 7.3 Extrapolated maximum concrete compressive strains in the beams 305
Table 7.4 The experimental and the theoretical neutral axis depth of the beams at the
uncracked and cracked sections 307
Table 7.5 Elastic & ultimate load/moment capacity of Part 4 beams obtained from
theory and experiment 312
Table 7.6 Ultimate shear capacity of Part 4 beams 314
Table 7.7 Theoretical and experimental deflections of Part 4 beams 318
Table 7.8 The modes of failure of the concrete beams containing steel/GFRP stirrups 321
Table 7.9 Estimated crack widths of Part 4 beams 322
Table 7.10 Performance quotient of Part 4 beams 324
Table 8.1 Performance summary of Part 1 beams 330
Table 8.2 Performance summary of Part 2&3 beams reinforced with GFRP rebars 331
List of Figures
Page
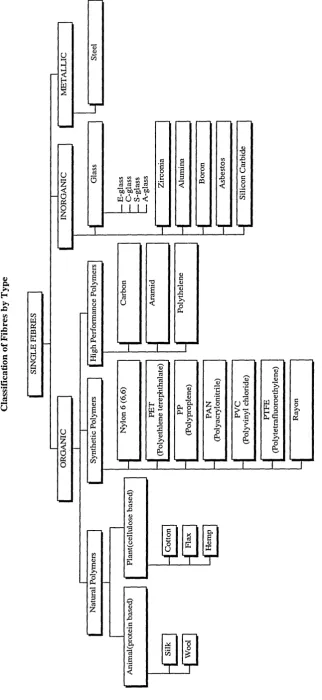
Figure 2.1 The classification of the fibres by type 9
Figure 2.2 Shear test set up 25
Figure 2.3 The loading arrangement for bond test 35
Figure 2.4 Loading and reinforcement arrangements of the beam specimens 38
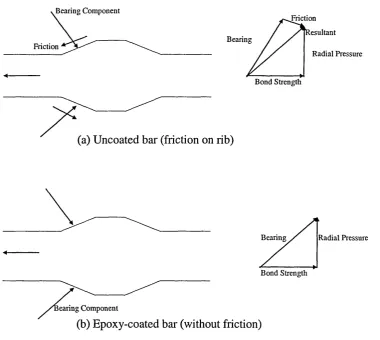
Figure 2.5 The resultant forces of bond on the bars 41
Figure 3.1 Typical loading arrangement and rebar configurations used in Part 1 89
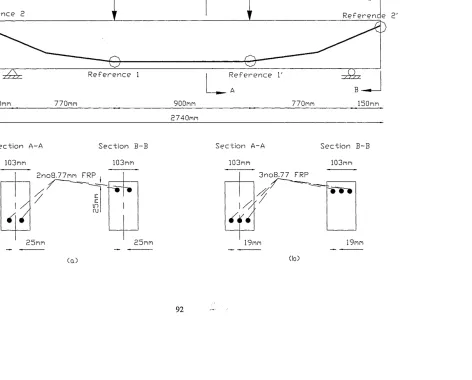
Figure 3.2 Typical loading arrangement and rebar configurations used in Part 2 92
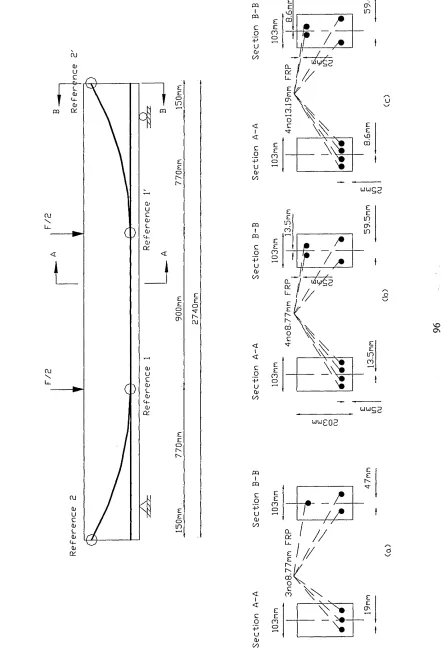
Figure 3.3 Typical loading arrangement and rebar configurations used in Part 3 96
Figure 3.4 Typical loading arrangement and rebar configurations used in Part 4 99
Figure 3.5 Stress versus strain graphs of steel rebars obtained during the tensile test 104
Figure 3.6 Stress versus strain graphs ofplain-end GFRP rebars obtained during the
tensile test 110
Figure 3.7 Stress versus strain graphs ofsteel-end GFRP rebars obtained during the
tensile test 116
Figure 3.8 Stress versus strain graphs of copper-end GFRP rebars obtained during the
tensile test 117
Figure 3.9 A representative graphs for the recovery of GFRP rebars under tension 119
Figure 3.10 A representative tensile stress versus strain graph of GFRP rebar measured
by an extensometer and a strain gauge 120
Figure 3.11 Sketch of strain gauge locations 137
Figure 3.12 Example of strain gauge readings monitored from different locations on
GFRP rebar 138
Figure 3.13 Location o f DEMECs and strain gauges 140
Figure 4.1 The location of the strain gauges in both shear and maximum bending
moment regions 149
Figure 4.2 Typical GFRP & steel rebar strains obtained from C40 grade concrete
beams at the maximum bending moment region 151
Figure 4.3 Typical concrete strains at the maximum bending moment region of
beams at the shear region 158
Figure 4.5 Steel & GFRP reinforcing bar strains obtained from C40 grade concrete
beams at the shear region 159
Figure 4.6 The location of the concrete strains measured at the maximum bending
moment region of the beams 160
Figure 4.7 An example of the concrete strains measured at the maximum bending moment region of C40 concrete beams reinforced with 8mm/8.77mm
diameter steel/GFRP rebars 161
Figure 4.8 An example of the concrete strains measured at the maximum bending moment region of C40 concrete beams reinforced with 12mm/13.19mm
diameter steel/GFRP rebars 162
Figure 4.9 An example of the concrete strains measured at the maximum bending moment region of C40 concrete beams reinforced with 16mm/16.44mm
diameter steel/GFRP rebars 163
Figure 4.10 An example of the experimental neutral axis depth for C20 concrete
beams reinforced with 8mm/8.77mm diameter steel/GFRP rebars 165
Figure 4.11 An example of the experimental neutral axis depth for C20 concrete
beams reinforced with 12mm/13.19mm diameter steel/GFRP rebars 166
Figure 4.12 An example of the experimental neutral axis depth for C20 concrete
beams reinforced with 16mm/l6.44mm diameter steel/GFRP rebars 167
Figure 4.13 An example strain distribution ofC20 concrete beam reinforced with
12mm diameter steel rebars 168
Figure 4.14 An example strain distribution ofC20 concrete beam reinforced with
13.19mm diameter GFRP rebars 169
Figure 4.15 Determination of neutral axis depth and the maximum concrete
compressive strain using measured concrete strains 170
Figure 4.16 Deflection of C20 grade concrete beams reinforced with GFRP/steel rebars 182
Figure 4.17 Deflection o f C40 grade concrete beams reinforced with GFRP/steel rebars 183
Figure 4.18 Deflection ofC60 grade concrete beams reinforced with GFRP/steel rebars 184
Figure 4.19 Details of the cross section used in the cracked width estimation 197
Figure 4.20 Sketch of maximum bending moment portion of the beam showing the
strains measured at two positions 198
Figure 5.1 Details of the beam reinforced with 2 & 3 straight profile GFRP rebars 209
Figure 5.2 Details of the beam reinforced with 2 & 3 curved profile GFRP rebars 209
Figure 5.3 Details of the beam reinforced with 3 & 4 straight & curved profile
Figure 5.4 The location of the strain gauges in both shear and maximum bending
moment region 211
Figure 5.5 Various profile of GFRP rebar strains obtained from C60 grade concrete
beams at the maximum bending moment region 212
Figure 5.6 Rebar strains in the shear region of the beams reinforced with 2 and
3 8.77 mm diameter GFRP rebars 216
Figure 5.7 An example of the concrete strains measured at the maximum bending moment region of C60 concrete beams reinforced with 3No 8.77 straight
& curved profile GFRP rebars 218
Figure 5.8 An example strain distribution of C60 grade concrete beam reinforced
with 3 8.77mm diameter straight profile rebars 219
Figure 5.9 An example strain distribution of C60 grade concrete beam reinforced
with 3 8.77mm diameter curved profile rebars 220
Figure 5.10 The experimental neutral axis depth for all the beams in Part 2 224
Figure 5.11 The concrete strains obtained in the shear regions of the beams 225
Figure 5.12 Load versus deflection response of Part 2 beams reinforced with straight
and curved profile GFRP rebars 231
Figure 5.13 The crack patterns of the beams reinforced with 2No 8.77mm diameter
‘straight only’ and ‘curved only’ profile GFRP rebars 235
Figure 5.14 The crack patterns of the beams reinforced with 3No 8.77mm diameter
‘straight only’ and ‘curved only’, ‘straight and curved’profile GFRP rebars 236
Figure 5.15 The crack patterns of the beams reinforced with 4No 8.77mm diameter
‘straight and curved’ profile GFRP rebars 237
Figure 6.1 Details of the beam reinforced with optimum GFRP rebar configurations 249
Figure 6.2 GFRP strains in the maximum bending moment region 251
Figure 6.3 A typical GFRP rebar shear strains measured from the microsilica added lightweight concrete beams reinforced with 4No 8.77 and4No 13.19 mm
diameter GFRP rebars 254
Figure 6.4 An example of the concrete strains measured at the maximum bending moment region ofC20 lightweight concrete beams reinforced with 4No 8.77
and 4No 13.19mm diameter ‘straight and curved’ profile GFRP rebars 256
Figure 6.5 An example of the concrete strains measured at the maximum bending moment region of C50 lightweight concrete beams reinforced with 4No 8.77
and 4No 13.19mm diameter ‘straight and curved’ profile GFRP rebars 257
Figure 6.6 An example strain distribution of C20 grade lightweight aggregate concrete beams reinforced with 4No 8.77diameter ‘straight and curved’ profile GFRP
Figure 6.7 An example strain distribution ofC20 grade lightweight aggregate concrete beams reinforced with 4No 13.19 diameter ‘straight and curved’ profile
rebars 259
Figure 6.8 The experimental neutral axis depth for all the beams in Part 3
Figure 6.9 The location of DEMEC disks in shear region
Figure 6.10 A typical glassfibre added concrete shear strains measured from the beams reinforced with 4No 8.77 and4No 13.19 diameter GFRP rebars
Figure 6.11 Load versus deflection response of Part 3 beams reinforced with ‘straight and curved’ profile GFRP rebars
Figure 6.12 The crack patterns of the various types of concrete beams reinforced with 4No 8.77mm diameter ‘straight and curved’ profile GFRP rebars
Figure 6.13 The crack patterns of the various types of concrete beams reinforced with 4No 13.19mm diameter ‘straight and curved’ profile GFRP rebars
Figure 7.1 Details of Part 4 beams
Figure 7.2 Steel and GFRP main bar strains in the maximum bending moment region
Figure 7.3 Strains measured in the top bars in the compression zone at the maximum bending moment region
Figure 7.4 Rebar strains in the shear region of the beams reinforced with 2No8/8.77 and 2Nol2/13.19 steel and GFRP stirrups
Figure 7.5 The bottom stirrups strains measured in the shear region
Figure 7.6 The side stirrups strains measured in the shear region
Figure 7.7 The concrete strains measured at the maximum bending moment region of C20 concrete grade beams reinforced with small diameter (08 and 08.77) steel and GFRP main rebars and mild steel and GFRP stirrups
Figure 7.8 The concrete strains measured at the maximum bending moment region of C20 concrete grade beams reinforced with large diameter
(012 and 013.19) steel and GFRP main rebars and mild steel and GFRP stirrups
Figure 7.9 An example strain distribution of C20 grade concrete beam reinforced with 2Nol2mm steel and 24No6mm mild steel stirrups
Figure 7.10 An example strain distribution of C20 grade concrete beam reinforced with 2Nol3.19mm GFRP and 24No6.9 mm GFRP stirrups
Figure 7.11 The experimental neutral axis depth for all the beams in Part 4
Figure 7.12 The concrete strains obtained in the shear regions of the beams at the location of tension rebars
Figure 7.13 The concrete strains obtained in the shear regions of the beams at the
location of stirrups
Figure 7.14 Load versus deflection response of Part 4 beams reinforced with steel/GFRP main rebars and stirrups
Figure 7.15 The crack patterns of the concrete beams reinforced with 2No8/8.77 rebars and steel/GFRP stirrups
Figure 7.16 The cracks patterns o f the concrete beams reinforced with 2Nol2/13.19 rebars and steel/GFRP stirrups.
310
316
319
NOTATION
The definitions of the symbols used in the thesis are given below.
ast tgfrp actual '■ experimental stress in the reinforcing bars at the cracked section (MPa)
fst i gfrp : stress in the reinforcing bars obtained from tensile test (MPa)
fyv: cliarecteristic strength of mild steel stirrups (MPa)
vmax theo : theoretical ultimate shear strength of the beam (MPa)
actual • actual ultimateshear strength of the beam based on shear force diagram (MPa)
f c : concrete cube strength (MPa)
Ejt/ggp : modulus of elasticity of the reinforcorcing bars (GPa)
Ec : modulus of elasticity of the concrete (GPa)
Zst/gftprheo : theoretical strain in the reinforcing bars at the uncracked section
£st/gfrpacta£ : experimental strain in the reinforcing bars at the uncracked section
£ st i gfrp ■ theoretical strainin the reinforcing bars at the cracked section actual -experimental strainin the reinforcing bars at the cracked section
e co: the maximum concrete compression strain
ecl : measured strain at the first DEMEC disk
ec2 : measured strain at thesecond DEMEC disk
ecZ: measured strain at the third DEMEC disk
ec4 imeasuredstrainatthefourthDEMECdisk
em : difference between measured strains at the fourth and the third DEMEC disks
Mtheowcr ’• theoretical bending moment at theuncrackedsection (kNrn)
M actual uncr '• experimental bending moment at theuncrackedsection (kNm)
Mactualcr '■ experimental bending moment at the cracked section (kNm) ^initial '• the initial visible crack load of the concrete beam (kN)
Fmax : the failure load of the concrete beam (kN)
w : distributed load (kN/m)
Athe0uncr • theoretical deflection at the uncracked section (mm) : theoretical deflection at the cracked section (mm) A actuals : experimental deflection at the uncracked section (mm) ^actual„ '• experimental deflection at the cracked section (mm)
: minimum cover to the reinforcing bar (mm)
wmax^o : estimated maximum crack width based on the theoretical formula (mm)
: crack width based on measured strain at the third DEMEC disk (mm)
: crack width based on measured strain at the fourth DEMEC disk (mm)
w r ml • average maximum crack width (mm)
Xtheouna- '■ theoretical neutral axis depth at the uncracked section (mm)
Xactualuncr '■ experimental neutral axis depth at the uncracked section (mm)
Xtheocr: theoretical neutral axis depth at the cracked section (mm)
Xactualcr : experimental neutral axis depth at the cracked section (mm)
a, : fixed distance from top edge of the beam to the first DEMEC disk (mm) a2 : fixed distance from top edge o f the beam to the second DEMEC disk (mm)
aCT : diagonal distance from the bottom edge of the beam to the edge o f the reinforcing bar (mm) b : width of the concrete section (mm)
d : effective depth of the concrete section (mm) h : overall depth of the concrete section (mm)
D : diameter of reinforcing bar (mm)
e: fixed distance between the two loading points (mm)
Ls : fixed distance for span (mm)
L : fixed distance from the loading point to the end of the beam (mm)
sv: spacing of stirrups along the beam (mm)
sVam : maximum spacing of stirrups along the beam (mm)
Astlgfrp : area of reinforcing bars (mm2)
: the cross sectional area of the two legs of the strirrup (mm2 )
Itheouncr '■ theoretical second moment of area of the uncracked section (mm4)
^ actual uncr : experimental second moment of area of the uncracked section (mm4)
Itheocr '■ theoretical second moment of area of the cracked section (mm4)
V h> J theo,.
' l '
V h> J theo„
V h> J actual. r \ '
V^b J
actual-: theoretical curvature o f the beams at the uncracked section (1/mm)
: theoretical curvature of the beams at the cracked section (1/mm)
: experimental curvature of the beams at the uncracked section (1/mm)
ncr
: experimental curvature of the beams at the cracked section (1/mm)
Pconcrete i density o f concrete (kg/m3)
p : tension reinforcing bars ratio (%)
kx : a constant value (1) given in BS 8110
k2 : a calculated value Jc given m B S8110
\25y
ae : modular ratio
K : a constant value based on the shape of bending moment diagram
Qp : performance quotient
CHAPTER 1
1. Introduction
1.1 Background
The development and innovations that have been achieved in the application of concrete over the centuries are remarkable. According to the archaeological excavations in former Yugoslavia it has been found that the earliest application of concrete was in floors and it is dated 5600 BC1. The Egyptian, Greek and Etruscans civilisations produced concrete in lime mortar composition before the Romans introduced and developed Pozzolonic cement in 75 BC from a red volcanic powder near Naples. The invention of Ordinary Portland Cement (OPC) which is widely used in today’s concrete structures, was in 1824 by an English man, Joseph Aspdin.
The presence of bronze strips and rods as reinforcing material in some concrete constructions is dated between 300BC-500AD, and may suggest that the Romans had first observed the limitation of concrete i.e. being strong in compression and weak in tension. A degree of enhancement in the tensile strength of concrete by using bronze reinforcement was achieved but the Romans soon realised that the structure had started having cracks and spalling had occurred. This was principally due to the higher coefficient of thermal expansion of bronze compare to concrete2. The practice of Reinforced Concrete (RC) using a mesh of iron rods and wires became clear in early 1830 and became common between 1848-1897. Eugene Freyssinet (France) discovered another way to overcome the shortcoming of concrete for sustaining flexural loads and introduced prestressed concrete to the construction industry in
1930. The use of prestressing on any scale in Britain was after high strength tensile steel became readily available in the 1940s.
actual structure and the substructure because of the use of inferior materials or poor workmanship.
The other one, which is the major problem in structural concrete, is the corrosion of steel reinforcement. This occurs when RC is exposed to weathering and it progresses quickly particularly in salt contaminated concrete structures i.e. in marine and coastal, highways and bridges when salt and de-icing chemicals are used or in chemical plants.
The complete discussion of the processes of corrosion together with the techniques available to control corrosion is beyond the scope of this research considering the processes and the techniques are subjects for investigation themselves. Therefore, they will be described in brief for comprehending and appreciating the complexity of the problem.
The corrosion or rusting of steel is a complex electro-chemical process that occurs with a flow of current from the reactive anodic region to the un-reactive cathodic region of steel. The sum of these reactions is given by the following equation:
4Fe + 3 0 2 + 2H20 = 2Fe20 3 H20 3
i.e. (Iron/Steel) + (Oxygen) + (Water) = (Rust)
It can be seen from above that the corrosion occurs when oxygen and water are present. This means that the rate of corrosion is directly related to the oxygen and water i.e. as the availability of oxygen and water increases, the rate of corrosion increases as well. The presence of atmospheric contaminants such as carbondioxide, chlorides and sulphates also has major effects on corrosion rates.
Carbonation caused by the steady diffusion of carbondioxide (CO2) into the concrete,
takes place very slowly, if concrete has low permeability. This can be achieved by well-compacted concrete, which has a low water/cement ratio. The depth of carbonation in a good quality concrete is between 10 and 20mm after years of
steel reinforcement at risk quicker than carbonation5. The main source of chlorides comes from salt. This means that the highly aggressive environments such as marine and coastal structures together with highways where de-icing salt used, are more susceptible to corrosion.
The source of sulphates comes from the ground. When they react with water they become active and produce acidic solution which destroys the passivity of steel in the concrete. The most common places where a high level of sulphates attacks concrete are industrial environments.
The concrete cover plays an important role in the protection of steel against corrosion. If the concrete cover is insufficient the steel rusts with a loss of some of the cross- sectional area. This leads to disruption and spalling of concrete. The corrosion of steel usually gives warning through cracks, which appear, along the location of reinforcement in the concrete with rust staining. However, in some cases the corrosion of steel spreads throughout the structure without any warning resulting in collapse6. The damage caused by the corrosion of steel is usually localised and repair is possible but very expensive. It has been reported that approximately £500M is spent each year on concrete repair in the UK7 and 42% of bridges in the USA need to
o
be repaired . The estimated cost of the repair bill on parking structures in Canada is $4 to $6 billion and on highway bridges in the USA is $50 billion9. This clearly illustrates the scale of the problem.
A considerable amount of research has been carried out by different groups and organisations around the world in finding out a better way of avoiding concrete deterioration caused by the corrosion of steel. Initially, improving the concrete by using high cement content and designing low water/cement ratio mixes together with improved quality control during and after the concrete placement play a very
important part in providing adequate durability of concrete.
There are several techniques available for controlling the corrosion of steel
used in bridges in North America since 197311 and has been studied and used in Europe including Britain, Norway and Holland since the 1980s12. The cathodic protection techniques have been developed and applied to a number of bridges in the USA and Canada13. Stainless steel has been developed in the UK and USA since 1910 and used in many structures14.
All these present techniques have inherent problems in relation with their use and application. Most of them are expensive and need continuous maintenance. Besides, whichever technique is employed the core material which is vulnerable to corrosion is still present and that is steel reinforcing bar.
1.2 Research Aims and Objectives
The overall investigation is based on the feasibility of using a relatively low cost glass FRP (GFRP) bar, of a type, which has been successfully applied to prestressed
concrete, as reinforcement in concrete.
Principal Aims
The principal aims of this work is to:
• review the practice of using GFRP as a reinforcement in concrete elements and structures and investigate the scope for improving its performance
• postulate simplified novel rebar configurations and compare their performance with that of conventional ones for a range of concrete grades and types
• evaluate and compare the material/performance efficiency over an optimal range of configurations rebar types and concrete grades tested in the investigation • test the validity of existing design criteria for assessing and predicting the
performance of GFRP reinforced elements
Objectives
The objectives of this work cover the following aspects:
• Review previous research, applications and limitations of FRP and GFRP as reinforcement for concrete
• Review existing test methods and assessments of performance
• Compare the fundamental behaviour of high tensile steel and GFRP as simple reinforcement configurations for a range of concrete grades
• Investigate the use of simple novel rebar geometries to enhance performance • Apply an idealised rebar geometry to a given concrete for optimising efficiency • Assess and compare the performance of conventionally reinforced concrete beams
using GFRP and high tensile steel rebar singly and in combination
• Compare and contrast the performance and material efficiency of the range of concrete elements tested
Although, FRP reinforcing bars have already been used in structural applications the performance of FRP reinforced concrete is not fully understood. In order to establish the objectives above, firstly, it was clearly necessary to identify the differences in mechanical properties of both conventional steel and the FRP bars. Secondly, it was also necessary to select certain criteria such as load and deflection capacities, failure mode together with the cross section of the concrete element to give a proper
definition of performance.
1.3 Thesis Layout
The thesis is divided into 8 Chapters. It presents a comprehensive literature review on the subject in Chapter 2. Previous research referred to in this thesis (wherever
possible) is listed at the end of each Chapter. An introduction to the thesis is given in Chapter 1.
Details of the experimental programme including the equipment and instrumentation used to monitor ‘two-point loading’ tests in the laboratory are given in Chapter 3. The comparative data based on the mechanical properties of steel and FRP is also included in this Chapter.
The results obtained from the ‘two-point loading’ tests on the simply supported concrete beams, the analysis of all data and the discussions are included in Chapters 4, 5, 6 and 7 respectively.
1.4 REFERENCES
1 Cement and Concrete Association, Highlights in the History of Concrete, ppl-43.
2 Doran D K,Construction Materials Pocket Book, ISBN 0750616660, pp80-134.
3 The Prevention of Corrosion on Structural Steels-BSC Publication, 1985.
4 Illston J M, Dinwoodie, J M & Smith, A A, The Nature and Behaviour of Structural Materials, ISBN 0-442-30144-6, 1979, pp553-615.
5 Leeming M B, Concrete in the Oceans: co-ordinating report on the whole programme, Offshore Technology Report OTH 87, 248, HMSO, 1989.
6 Clarke J L, The Need for Durable Reinforcement, Alternative Materials for the Reinforcement and Prestressing of Concrete, ISBN 0751400076, 1993, ppl-33.
7 Swiss Bank Corporation (STOCKBROKERS), Quarterly Building Bulletin, 26 January 1989, London, pp5-7.
8 Chartier G, People Who Drive on Glass Bridges, NEWS
http://www.nsf.gov/od/lpa/news/press/pr9569.htm, 1995, ppl-2.
9 Bedard C, Composite Reinforcing Bars: Assessing Their Use in Construction, Concrete International, January 1992, pp55-59.
10 Prenchio W F, Durability of Concrete Treated with Silanes, Concrete International, V8, November 1988.
11 McKenzie M, The Effects of Defects on the Durability of Epoxy-coated
Reinforcement, Transportation Research Board/National Research Council, No 403, March 1993, ppl7-28.
12 Schiessl P & Reuter C, Epoxy-Coated Rebars in Europe:Research Projects, Requirements and Use, Transportation Research Board/National Research Council, No403, March 1993, pp29-45.
13 Weyers R E & Cady PD, Cathodic Protection of Concrete Bridge Decks, Journal of American Concrete Institute, Nov-Dee 1984, pp618-622.
14 Leffler B, Stainless Steels and Their Properties, Avesta Sheffield AB Research Foundation, 1996, ppl-36.
CHAPTER 2
2. LITERATURE REVIEW
2.1 Fibre Reinforced Plastic(FRP) Reinforcement
2.1.1 Fibre Types & Forms
Definition o f fibre: A fibre may be defined as a linear filament of material with a more or less uniform, small cross-section of thickness or diameter less than 100pm and aspect ratio (ratio of length to thickness or diameter) greater than 1001. The
typical tensile properties of fibre materials are shown in Appendix l 1. The
classifications of the fibres are shown in Figure 2.1.
Background
The natural polymer fibres (wool, silk, and cotton) have been known and used
extensively in the textile industry for thousands of years. The FRP industry started in 1940 due to the electronic needs of World War II in respect of manufacture of the radars for military aircraft2. Carbon Fibre Reinforced Plastic (CFRP) and Aramid Fibre Reinforced Plastic (AFRP) were developed and used mainly in the aerospace industry. They have been introduced to concrete structures as reinforcements subsequently.
Composites can be split into two categories: those with long fibres (continuous fibre- reinforced composites) and those with short fibres or staples (discontinuous fibre- composites). Fibre composites contain two components, fibre and resin. Those of commercially available fibres used in the production of grids, rods, plates and ropes for concrete reinforcement cover the following range:
gu re 2.1 Th e cl as sif ic at ion of the f ib re s by ty pe .
o to to to to « ea 'eb'M WU
ea J2 •eb co <
JLI
N a H AVi IV u pfi fa CmOa o •xs« V c u E >. o Ph S c >> CO
« o*
cu o
Pi fe ” eu ’o
•a £ J s g*ca
>. o
'O *Go
o l
' T T T
[image:37.626.139.462.45.747.2]2.1.1.1 Carbon Fibres Background
Carbon fibres are black colour and are produced from organic cellulose based precursors such as cotton, rayon, PAN (Polyacrylonitrile) being carbonized without melting followed by graphitisation at high temperatures of 1000 °C -2000°C and of 2500 °C -3000°C respectively. Apart from offering higher modulus and strength than all reinforcing fibres, carbon fibres are not affected by stress corrosion at room temperature unlike glass and polymeric fibres. Thomas Edison first achieved the transformation of cotton and bamboo strips in to carbon fibres to use as filaments in incandescent electric lamp3.
Avvlications o f Carbon Fibres
Carbon fibres were mainly developed for the aerospace industry and have been used in automotive, mass transportation (railways), chemical industry (water pipelines) and medical (bone plates)4.
2.1.1.2 Aramid Fibres Background
Aramid fibre is a generic name for synthetic organic fibres called aromatic polyamide fibres. Trade name of Kevlar was commercialised by Du Pont Company in 1972 in the USA and it is the most commonly used fibre throughout the world. Several other commercial aramid fibres are namely Nomex (USA), Teijinconex and Technora (Japan) and Twaron (Holland)5. Kevlar fibres are bright yellow colour and are in different types such as Kevlar (used as rubber reinforcement), Kevlar 29 (used for ropes, cables, coated fibres, architectural fabrics and ballistic protection fabrics, Kevlar 49 (used as reinforcement for epoxy, polyester, and other resins).
Avvlications o f Aramid Fibres
2.1.1.3 Glass Fibres Background
Ancient Egyptians were the first civilisation, which made glass. The idea of fibre glass was first described by Robert Hooke in 1665 and the modem industry started recognising the use of it as plastic reinforcement, in the 1930s when the Owens- Coming Fibreglass Corporation was set up in the U.S.A7. Glass fibre is a generic term like carbon fibre or steel. Common glass fibres are silica based (50%-60% Si02) and contain a host of other oxides of calcium, boron, sodium, aluminium and iron.
Table 2.1 contains the compositions of some commonly used glass fibres. In borosilicate E-glass, E stands for electrical and it was originally developed for
electrical insulators having a good strength and reasonable elastic modulus and better resistance to water and to acids than the standard alkali soda lime silica glass (A- glass) as used in windows or containers. In C-glass, C stands for corrosion and it has a better resistance to chemical corrosion than E-glass. In alumino-magnesium silicate S-glass, S stands for the higher silica content and it has higher strength and elastic modulus than other types plus it is able to withstand higher temperatures than other glasses but also is more expensive.
Table 2.1 Approximate chemical compositions o f some glass fibres (wt %)
A-glass C-glass E-glass S-glass
Si02 72-72.5 60-65 52-56 64.3-65
AI2O3 0.6-1.5 2 -6 12-16 24.8-25
CaO 9-10 9-10 16-25 0 .0 1
MgO 2.5-3.5 3-4 0 - 6 10-10.3
Na20 13-14.2 7.5-12 0 -1 0-0.27
b2o3 - 2-7 8-13
-The most often used glass composition is E-glass and it is available in a variety of forms and is the least expensive. C and S glasses are used when high chemical resistance, stiffness and strength are the main requirements.
Avvlications o f Glass Fibres
2.1.1.4 Steel Fibres Background
Steel fibres were first patented in the USA in 19628. They are usually manufactured by three processes (1) by cutting cold drawn wire, (2) by slitting steel sheet, (3) by extracting them from a pool of molten steel (melt extract) for producing straight or deformed shapes having circular, rectangular or irregular cross sections.9 10
Depending on their grade, the tensile strengths of steel fibres range from 345MPa to 2070 MPa. Their sizes range from 13 x 0.25mm to 64 x 0.76mm. Many researchers worked on using steel fibres in concrete in order to reduce cracking by making the concrete tougher (enhanced energy absorption) and more ductile. Also, using steel fibres substantially increases shear and tensile strength of concrete11.
Avvlications o f Steel Fibres
The proven applications of steel fibre reinforced concrete include shotcrete, precast concrete, slabs and floors, pavements, seismic structures and repairs.
2.1.1.5 Comparison of Carbon, Aramid and Glass Fibres
The Table in Appendix 2 adopted from Yang5 shows the comparison of selected high
performance fibres. Fibre flexibility is associated with modulus of elasticity and the diameter. The diameter becomes the dominant parameter controlling the flexibility in high-modulus fibres. For a given E value, the smaller the diameter the more flexible it is.
Kevlar aramid fibres have rather poor strength properties in compression compared with those in tension although this can be solved by utilising cost effective (based on specific properties) advanced hybrid composites such as Kevlar/carbon or
Kevlar/glass.
Glass fibres are not moisture absorbent and are not degraded by exposure to sunlight. They have a very high resistance to chemicals and can be used up to 500 °C and will not bum. They are the least expensive fibres compared to carbon and aramid fibres.
Kevlar aramid and high strength polyethylene fibres are employed for both rigid and flexible stmctures whereas carbon and glass fibres are mostly limited to the
reinforcement of rigid composites. Glass and carbon fibres are definitely the first choice for applications at exteremely high temperatures. Another important characteristic of these high performance fibres is their rather low values of strain (generally less than 2-3%) to fracture. For this reason, it is necessary to distribute these low ductility slender fibres into a binding medium called a resin matrix. The function of the matrix is not just for holding the fibres together but also for
transmitting the applied loads to the fibres. The nature of fibre and resin matrix bonding also influences the strength and toughness of a composite.
2.1.2 R esin Types
Fibre composites are formed in a resin matrix, which can be either:
• thermosetting (e.g. epoxy-Araldite, phenolformaldehyde-Bakelite, polyester, vinlyester, polyaromatic, urea formaldehyde).
• thermoplastic (e.g. polycarbonate, polythelene, polypropylene, polystyrene, polyvinyl chloride (PVC), polytetrafluoroethylene (PTFE), polymethyl methacrylate (Perpex or Plexiglass), polyamides (Nylon).
Background
resins) are relatively high breaking strain, good flexural properties and good bonding whereas high elastic modulus resins (rigid resins) offer high compressive strength, brittleness and relatively poor bonding. In general, the resin matrix should bond well with fibres, protect the fibres from permanent damage and be capable of transferring large forces as a result of high shearing strength13.
2.1.2.1 Thermosetting
Thermosetting resins supplied as liquids, pastes and solids harden upon application of heat. They display good resistance against creep and severe environmental conditions (heat, cold, radiation, humidity and chemical atmospheres)14. Typical physical and
mechanical propertis of commercial matrix materials15 are given in Table 2.2.
Table 2.2 Typical physical and mechanical properties o f thermosetting resins
Polyester Epoxy Vinylester
Tensile strength(MPa) 20-100 55-130 70-80
Tensile modulus(GPa) 2.1-4.1 2.5-4.1 3-3.5
Ultimate strain(%) 1-6 1-9 3.5-5.5
Poisson’s ratio - 0.2-0.33
-Density(kg/m3) 1000-1450 1100-1300 1100-1300
Tg(°C) 100-140 50-260 90-140
Coefficient of Thermal
Expansion CTE (10'6/°C) 55-100 45-90 21-73
Cure shrinkage(%) 5-12 1-5 5.4-10.3
Comvarison o f Polyester. Vinylester and Epoxy Resins
in combination with Kevlar aramid fibres. Thermoset composites are generally stiffer, more thermally stable and brittle than thermoplastic composites.
2.1.2.2 Thermoplastic
Thermoplastic resins are those that melt or soften upon application of heat. They are also available in the form of liquids, pastes and solid. In contrast to thermosettings, thermoplastic resins display weakness against creep and severe environmental
conditions. Their strength and stiffness are lower than thermosetting resins. They are employed for fast assembly packaging materials and plastic film laminates.
Thermoplastic resins are more compatible with aramid fibres. Nylon is the most often used thermoplastic in Kevlar aramid fibre composites.
Table 2.3 Typical physical and mechanical properties o f common thermoplastic resins16
Property
Fibre Type
Glass trasition temperature (°C)
Density
(kg/m3) Coefficient of Thermal Expansion (xlO'6 °C)
Tensile Strength (MPa)
Tensile Elastic Modulus (GPa)
Polyethylene -120 920 220 8 0.5
PTFE -120 2100 110 20 0.5
Polyproplene -27; 10 900 110 30 1.3
Nylon 66 57 1140 90 70 2.6
Polycarbonate 150 1220 55 60 2.7
Polymethylmethacrylate 80-100 1180 65 70 2.9
Polystyrene 80-100 1050 70 50 3.0
Polyvinylchloride 80 1400 70 50 3.2
2.1.2.3 Manufacture of Different Type and Size of FRP Reinforcements
Regardless of the manufacturing technique, there are three stages common to construction of FRP composites: (1) deciding which type of resin will be used with which type of fibre, (2) forming resin and fibre into the required shape, (3) shaping and curing of the composite material into its final geometry.
The manufacturing process affects the mechanical properties of FRP composites. However, it possible to achieve the best mechanical properties through using strong fibres, tough resin, long fibre geometries and high volume fibre densities.
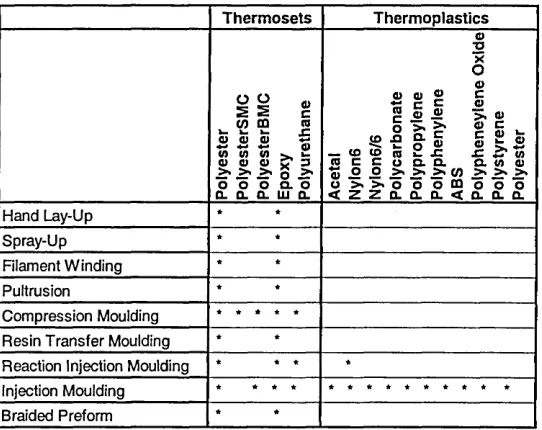
Table 2.4 adopted from Ellyin18 shows the types of FRP composite manufacturing techniques and the suitable resins used for each technique. It can be seen that the thermosetting resins can be used in the majority of the techniques. The Table also indicates that the polyester and epoxy resins are suitable for the pultrusion process.
Table 2.4 The common type resins used in dijfrent manufacturing technique
T h erm o sets T herm oplastics
P ol ye st er P ol ye st er S M C P ol ye st er B M C E po xy P ol yu re th an e A ce ta l N yl on 6 N yl on 6/ 6 P ol yc ar bo na te P ol yp ro py le ne P ol yp he ny le ne A B S Po ly ph en ey le ne O xi de P ol ys ty re ne P ol ye st er Hand Lay-Up Spray-Up Filament Winding Pultrusion
Compression Moulding * * * * * Resin Transfer Moulding
Reaction Injection Moulding * * * « Injection Moulding
Braided Preform
The pultrusion process has been in use since the 1950s and it has been widely accepted by civil engineering, architectural and construction industries due to its fast speed of operation and good quality control at a relatively low cost. The mechanical and physical properties of final product are dependent on the process variables such as fibre volume, pulling speed and temperature inside the die zone which contains three parts in which temperature increases gradually to provide temperature gradient from the surface of the product to its core19. A two-point loading test conducted on a
rectangular shape pultruded product made of graphite fibre and epoxy resin by Lackey
Lackey in another paper are 9.08-18.16kN for graphite/epoxy pultrusion and less than 4.54kN for glass/epoxy22.
The pultrusion process is particularly suitable for manufacturing composite components with continuous, constant cross-section profiles. The combination of glass fibre and polyester resin is the most common composition of FRP products used in this technique. The GFRP rebars supplied by the manufacturer in the USA and used in this investigation were also produced by pultrusion process. Pultruded composites offer relatively better physical properties. This can be combined with reduced cost and durability. They have a better surface finish and close tolerances compared to other composite manufacturing processes due to the axial nature of the process. Researchers have investigated the pultrusion process for many years. Although the manufacturing process is not complicated, the effects of different process parameters and their complex interactions are critical for obtaining an optimum product23.
2.1.3 Com parison o f FRP Reinforcements com pared to Conventional Steel Reinforcem ents
Besides its corrosion resistance, potential advantages of FRP reinforcements compared to steel are:
• High strength
• Fatigue characteristics of high performance fibres are three times higher than steel • High energy absorption
• Low density
• Low conductivity and electrical interference
• Lower concrete cover in concrete applications such as cladding panels25 • Low maintenance cost
However, potential disadvantages exist for FRP reinforcements and these are:
• High cost (5 to 50 times more than steel, however cost of stainles steel also high approximately 6 times more than steel)
• Low modulus of elasticity
• Glass fibre deterioration by alkaline attack (this may be counterbalanced by using alkaline resistant glass fibres and polyester or vinylester resins26)
• Anchorage for prestressing FRP tendons needs special attention
• Long-term strength of FRP reinforcement can be lower than short-term static strength (it has been reported by Saadatmanesh , that the long-term strength of glass FRP is approximately 70% of its short-term strength)
• FRP reinforced element is difficult to modify and recycle once it is erected27
2.1.3.1 Manufacturers of FRP Composites for Concrete
Summary of products and manufacturers of FRP composites for concrete are given in
Table 2.5 Manufacturers o f FRP composites
TRADE NAME MANUFACTURER USE & FORM MAKEUP
KODIAK IGI International
Gratings, USA Rebar
Glass fibre reinforced plastic and polyester resin
POLYSTAL Stabag and Bayer AG,
Germany
Rebar and prestressing tendon
Glass fibre reinforced plastic and polyester resin
ISOROD Pulltall Inc., Canada Rebar Glass fibre reinforced
plastic and polyester resin
IMCO IMCO Reinforced
Plastics Inc., USA Rebar
Glass, carbon or aramid fibre reinforced plastics
JITEC Cousin Frere, France Rebar
Glass or carbon fibre reinforced plastic and
vinylester resin
DYWIDUR DYWIDAG-Systems
International, Germany Rebar
Glass fibre reinforced plastic and epoxy resin
NEFMAC Nefcom Corporation,
Japan
2D & 3D reinforcing grids
Glass, carbon or aramid fibre reinforced plastics
PARAFIL ROPE ICI Linear Composites,
UK Prestressing strands
Aramid fibre reinforced plastic FIBRA A-ICS Corporation/Mitsui Construction Co.Ltd., Tokyo, Japan Rebar & prestressing strands
Aramid or/and carbon fibre reinforced plastics
and epoxy resin
ARAPREE
AKZO and Hollandsche Beton Groep nv,
Holland