THB BCONOMIC RBSBARCH INSTITUTB
Adaptation of the CSO 1960 Input-Output Table for Decision-making Use
R. C. Geary
The object generally is to recast the
35 x Z6 Table into the form of Table 4 of [i~, This latter from has been shown to be effective for
decision model making, without the troublesome iterations required for other models. Feasibility (or otherwise) of different sets of assumption is determinable from the model in one piece, so to speak. The present,
purely methodological~ memorandum deals only with the recasting of (a) the primary input rows and (b) the stock column in the final demand quadrant. The processes used are quite elementary. D. Simpson is attending to the inter-industry quadrant and the remaining columns of final demand.
Primary Input
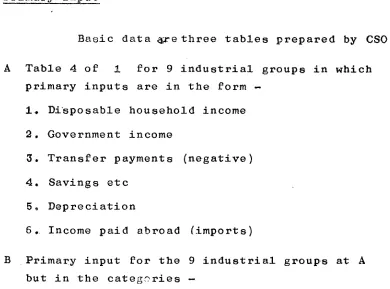
Basic data ~re three tables prepared by CSO
A Table 4 of 1 for 9 industrial groups in which primary inputs are in the form
-I. Disposable household income 2. Government income
3. Transfer payments (negative) 4. Savings etc
5° Depreciation
6. Income paid abroad ~imports)
[image:1.579.110.500.528.817.2]-a. Indirect taxes
b. Subsidies (negative) c. Wages and snlaries etc d. Profits and rent
e. Depreciation
C The 36-industry table in which the primary
input categories are as in B except that single totals are given for d + e,
C is of much more recent date than A and B and therefore contains amendments in totals of
identical scope. A and B are completely reconcilable; for each of the 9 industry groups the totals of
primary input are identical; items A3 and A5 are respectively the same as Bb and Be~ The problem is to recast the C version into the A version~ with identical totals for each of the 36 industries,
6 Income paid abroad. The A total (all industries) of ~19.090m, was revised slightly to ~19,49Om. in Co
In the 9 groups the figures were revised upwards proportionately. In each group the resulting
totals were distributed proportionately according to d + e of C.
4 Savin~ and 5 Depreciation. The A group totals were distributed according to d + e of C.
2. Government income. The indirect taxes part is known from C for each of the 36 industries. Direct taxes were derived for the 9 industrial groups as the difference between A2 and Ba and shown in column
over:-(1)
(2)
{4)
Industrial Di re ct Reference Ratio group taxes (era) income
total (£m)*
(2) .
I 3.451 133.6OO .O25831
II 1.409 90,609 ,068368
llI 0.872 12.649 .O68938
IV 1.348 19.557 .O68927
V 1.082 17,09.3 ,063561
VI 3.472 34.198 .IO1526
VII 2,318 34,395 mO67531
VIII 3.O38 12.039 .952347
IX 96.966 229. 500 ,i17499
i
* GNP- indirect taxes + subsidies - depreciation From the regularity of some of the ratios in column (4), it is probable that this is like the way CSO derived the estimates, originally. The
ratios in column (4) were applied to the reference income for C, to give estimated direct taxes in each of the 36 industries. Government income was then given as the total of direct and indirect income.
For reconciliation, the original (A and B) totals compare with the totals as revised for direct taxes and government income as follows (~m)
:-Industrial Direct taxes Govt. income
... A
group
Original Revise d Original Revised
I 3.451 3.369 15.010 14.928
II I. 409 I. 400 3.O16 2,940
III 0.872 0. 840 43.421 43. 390
IV i, 348 1.478 1.726 1,781
V 1 .O82 1 .I14 3.868 3.914
VI 3.467 3.661 4.703 4.534
VII 2.318 2.285 3.045 3.Oll
VIII 3 .O38 3.313 3.557 3.778
4
-Direct taxes compare satisfactorily° The only discrepancy in government income, that at IX, is obviously due to a ~evision in indirect taxes given as £13o995mo in A and ~9oiOlmo in Co
3o Transfer payments are given for all 36 industries in Ca
l, Disposable household income the largest constituent, is found as a residue, the difference between industrial GNP and heads 2 - 5, determined in the manner indicated.
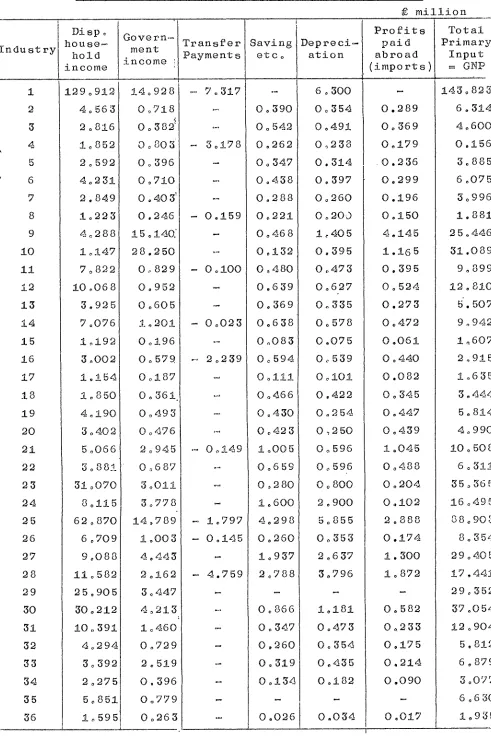
The final estimates of Primary Input are given in TabJ_e io The estimate for 2 Government income for industry 34 - Domestic service, namely
£0~779mo, is probably too large~ though domestics d__oo pay taxes by~-ay of Social Security contributions.
It was decided not to lower the figure because (i)such a reduction would be speculative and (ii) the
t~_ eoome mo
resulting ~ ~ ~ dification of all the multip-licity of figures would be unlikely to affect
materially any of the forecaots etc derived from the Table o
A general reconciliation of the A and C versions of i Disposable household income in the
1
LO
!
’q~
0
~
c~
co
~
c~
~ 0
¯
o
¯
¯
©
¯
¯
o
¯
O
LO
LO
’.O
O1
~
"~1
D,
I-"1
H I-4
o
.~
0
¯ H
1
¯ H
0)
~)
~
o
¯ ~1
.o
.~
o
¯ H
~)
0
0
"~1
~
°
o.~
~
~
o
o
;~
~
p
~0
o ~ ~; ~:
o
-,H
0
0.,
Stock Ratios
-6-In addition to the sources mentioned above,
data for this section, as regards industries included
in CIP, are derived from [21 , where year-end stocks
are in 4 categories
-i ~ater-ials
2 Work in progress
3 Goods made by the establishments
4 Goods purchased for resale without change
A characteristic of the Irish I-O Table is that stock
changes itemised by industry pertain to Irish-made
goods, with all imported stocks in a single total,
whereas totals at heads i and 4 contain imported as
well as home-made goods° The main task here is, in
fact, to isolate home-made from imported goods in
I + 4. The doubtfully includible head 4 is relatively
small in the stock totals.
The niethods used was to distribute i + 4
totals according to the ratios derived from the I-0
Table for (a) home materials in the CIP industries
2 - 24 to (b) total (a) plus imports. The ratios
were then multiplied industry by industry 2 - 24 to
give estimates of domestic stocks. The results are
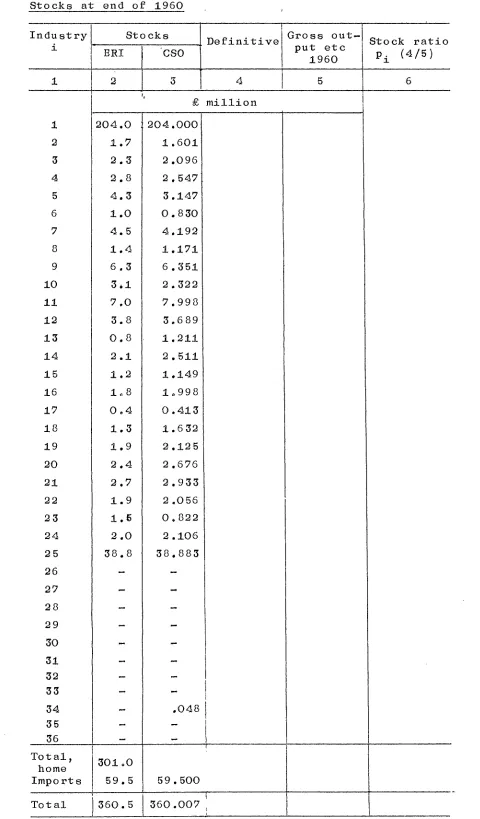
shown in column (9) ef Table 2 for industries 2 - 24.
A reconciliation with the original 7-industry groupings
7
-II III IV V VI VII VIII
Total Ii - VIII
i ,’, , ,
}~omo produced ~~ocks Original Revised
(Table 2 )
14 o0 8°6 11 o7 7°8 12o5 0o9 2ol 57.6
16o3 9~4 10 o7 7°0 11 o2 1.4 2°0 58 o0
It should be pointed out that in Table 2 industries 23 and 24~ namely Construction and
.~lectricity~ gas~ water correspond exactly to the 9-category groups VII and VIII respectively° In VII and the considerable construction part of VIIi
CIP operates on a "work-done~ and not a "work completed" basis° Accordingly~ work in progress in the case of these two industrial groups is brought to I.-O account in the fixed capital foz~mation column~ insofar as it is "new~ the interindustry entries are only in respect of repairs and maintenance° For the
estimation of stocks for 2Z and 24~ work in progress was left out of account°
The reconciliation i8 quite satisfactory~ having regard to the nature of the data and the rather heroic expedient to which recourse was had to identify
domestic stocks° The concordance of the totals at £58 million is quite remarkable°
As to stocks for heads ~.. and 25 ~ 36,
- 8
-heads 26 - 36 so that one may presume stock levels nil.
This means that the original end-1960 level for group
IX- Services - may be attributed to head 95 - Transport,
trader i.e. ~$8.8 m. There has been little alteration
in the import total so imports stocks are set at their
original level of ~59.5 m. The full estimation is
shown in Table 2.
CSO has been asked to supply their version
of stock levels at end-1960, classified as in the I-O
table. It will be interesting to compare the two
series. The derivation of the stock ratios Pi can
9
-TABLE I :
Input-Output 1960 - Adaptation of PRI~,~ARY INPUT
£- million Industry 1 2 3 4 A 5 6 7 8 9 10 11 12 13 14 15 16 17 18 19 20 21 22
23
24 25 26 27 28 2930
31
32
33
34
35
36
Di sp o house-hold income 129 o912 40563 20816 1o852 20592 40231 2.849 10223 4~288 1 o147 70822 10 °068 3°925 70076 1 o192 3 °002 1.154 1o850 4o190 3 o402 5 ~066 3o88Z 31 o070 8 o115
62 o 870 6 °709 9 ~088 11o582 25 °905 30 o 212 10 ,, 391 4°294 30392 2 o275 5o851 i~595
]
Govern-ment income 140928 0 o718 4 0o382" 0 o 803 0og96 0 o 710 0,403; 0. 246 15 o 140. 28.250 0~.829 0.952 0 o605 J o 201 0o196 0 o 579 0 o187 0o361 0 °493 0 0476 2 o945 0 °687 3 o01! 3 ,,778 14 °789 1 °003 4.443 2 o162 3 °447 4o213 1 o 460’ 0 °729 2o519 0°396 00779 0 o265 Transfer Payments Saving etCo7 o 317 --- 0 o 390 °- 00542 30178 0.262 - 00347 -, 0°438 -- 0.288 0.159 0o221 - 0°468
¯ - 0 o132 0 o i00 0 o 480
- 0.639
- 0.369
0°023 0.638 ¯ - 0°083 20239 0°594 - 0 o111
~ 0 0466 0 o 430 ,~ 0°423 0o149 Io005 .~ 0o659 - 0.280 - Io600 1~797 4°298 0o145 0°260 - 1°957
4.759 2 °788
--. 0°866 - 00347 - 0,260 - 00319
- 0 o134
¯ - 0.026
Depreci.-ation 6,300 0°354 0 o491 0,238 0. 314 0 o 397 0 o 260 0 °200 1,405 0.395 0 ,,473 00627 0.335 00578 0.075 0.539 0 o i01 0.422 0,254 0~250 00596 0o596 0 o 800 2 o 900 50855 0°353 20637 3.796 1°181 0 °473 Oo 354
0.435
0 o182 0 ,,034 Profits paid abroad (imports) 0.289 0°369 0 o179 0.236 00299 0.196 0.150 4.145 1.165 0.395 00524 0.273 00472 0 o061 0 o 440 0.082 Oo 345 0 °447 0.439 i °045 0 °488 0 0204 0 ,,102 2.888 0.174 1. 300 1 o 8720°582 0,,233 0.175 0.214 0.090 0 o017
To t al Primary
Input = GNP
1430823 6.314 4 ~ 600 0.156 8°885 6 °075 30996 1o881 25 °446 31.089 9,899 12 o 810 5’. 507 9°942 I~607 2 o915 1 o635 3.444 5 ° 814 4 ° 990 10 o 50 8 6 o 31! 35°365 160495
88o9Oa
8°354 290405 zt.~ !7.4 .± 29°352 37.054 12 o 904 5,812 [image:9.579.44.535.104.844.2]10
-TABLE 2
Stocks at end of 1960
[image:10.579.59.539.72.891.2]11
-"Towards an Input.-Output Decision Model for Ireland’7 by R0 C. Geary~ SSISI, 1964-65.