a Process Model
Heike Heidemeier Jacobs University Bremen
Klaus Moser
University of Erlangen-Nuremberg
(July 2008)
LASER Discussion Papers - Paper No. 17
(edited by A. Abele-Brehm, R.T. Riphahn, K. Moser and C. Schnabel)
Correspondence to:
Prof. Dr. Klaus Moser, Lange Gasse 20, 90403 Nuremberg, Germany, Email: [email protected].
This meta-analysis explores agreement in self and supervisory ratings of job performance (k = 128 independent samples). It suggests a three-stage model of the rating process and reviews the empirical evidence for the relevance of each of these three stages to an understanding of agreement in ratings. The proposed three-stage model serves as the guiding rationale for the examination of an extensive set of variables that moderate rater agreement. Results are reported for two indicators of rater agreement (correlational and mean level agreement). Self-supervisor ratings yielded an overall correlation of r = .22 (rho = .34; k = 115; n = 37752). Position characteristics and the use of non-judgmental
performance indicators were the main moderators. Leniency in self-ratings is indicated by higher mean levels of self-ratings compared to supervisory ratings. Within Western samples, performance
self-ratings showed leniency (d = .32, delta = .49; k = 89; n = 35417) dependent on contextual features, scale format, and scale content.
Copyright statement
The copyright of this document has been transferred on behalf of the authors to the American
Psychological Association (APA), Journal of Applied Psychology (http://www.apa.org/journals/apl/). This article may not exactly replicate the final version published in the APA journal. It is not the copy of record. This document has been posted for the purpose of discussion and rapid dissemination of preliminary research results.
Author note
Writing of this paper has been partially supported by a grant from the Deutsche Forschungsgemeinschaft to the second author.
Performance appraisals serve a variety of purposes in organizations such as making administrative decisions, satisfying legal requirements, or assessing training needs. The focus of this article is on self-ratings. Trends in performance evaluation have emerged that led to a growing importance of self-assessment including the introduction of management systems that employ self-evaluations as a basis for negotiating goals (e.g., “Management by Objectives”, Drucker, 1954), or the use of appraisals for purposes of employee development (Murphy & Cleveland, 1995). As self-management generally becomes an increasingly relevant demand (e.g. Frayne & Geringer, 2000), so does one of its core components, appropriate self-evaluation (Bandura, 1986; Cervone, Mor, Orom, Shadel, & Scott, 2004).
Self-otheragreement in ratings warrants specific consideration due to the effects it has on the targets’ attitudes and behaviors. For example, according to Bass and Yammarino (1991) the degree of self-other congruence in ratings may be related to job performance. This hypothesis has been confirmed by a number of authors (Atwater, Ostroff, Yammarino & Fleenor, 1998; Atwater & Yammarino, 1992; Furnham & Stringfield, 1994) and triggered a debate as to whether self-other congruence itself should be used as an assessment measure in predicting effectiveness on the job (e.g., C. Fletcher & Baldry, 2000; Randall, Ferguson & Patterson, 2000). A related idea is that making a person aware of discrepancies between his or her self-view and the views of others can be a source of insight (Kwan, John, Kenny, Bond, & Robins, 2004; London & Smither, 1995; Smither, London, Vasilopoulos & Reilly, 1995) and can help the targets increase their effectiveness on the job (Leslie & Fleenor, 1998; Smither, London, & Reilly, 2005).1 Complementing these findings, research has accumulated evidence that “discrepant feedback”, i.e. feedback which results if others’ ratings are less favorable than self-ratings, or if the pattern of high and low ratings diverges from self-reports, may lead to negative outcomes. Such unwanted consequences include negative beliefs about the accuracy and
usefulness of ratings as well as generally negative affective reactions (Brett & Atwater, 2001), reduced satisfaction with the appraisal, lower acceptance of evaluation procedures (Brett & Atwater, 2001; Farh, Werbel & Bedeian, 1988; Halperin, Snyder, Shekel & Houston, 1976), and reduced willingness to participate in career planning (Wohlers, Hall & London, 1993). Given the psychological implications of “discrepant feedback”, factors that systematically influence the mean difference between self and other ratings, deserve much interest.
Research in performance ratings continues to be a very active field. Many factors that may determine the properties of performance ratings have been examined, and interest in the self as a source of appraisal is still growing. These numerous findings call for an integrating overview of the empirical evidence accumulated and, more importantly, for an organizing theoretical framework. To help research and practitioners interpret self-other discrepancies in ratings, it is worthwhile to review the influence that study and sample characteristics, as well as features of the context and the appraisal instrument, have on the outcomes of ratings.
Purpose of the Current Meta-analysis
The current meta-analysis seeks to make four important contributions to the existing literature. First, we suggest a three-stage model of the rating process and review the empirical evidence for the relevance of each of these three stages to agreement in ratings. The proposed model organizes moderator variables into a theoretical framework. A taxonomy of moderator variables is presented and the influence of moderators is related to the three stages of the rating process. Second, the current meta-analysis integrates results for both mean-level and correlational agreement between self- and supervisory ratings. The two indicators of rater agreement, effect size indexes r and d, have been reported to be empirically independent from each other (Warr & Bourne, 1999). Presenting moderator results for both indicators of rater agreement in a single study allows for an immediate comparison of results and their discussion
from the perspective of a common theoretical framework. Third, the current meta-analysis examines a comprehensive set of contextual factors that potentially moderate self-other agreement, some of which have not been included in meta-analytical research before. Fourth, the database of primary studies has grown substantially, which especially warrants an updated estimate of leniency in self-ratings (see Harris & Schaubroeck, 1988).
Measures of agreement in performance ratings. The body of research we examine assesses correlational agreement by correlating employees’ self-ratings for a given dimension of performance with their supervisors’ ratings. Our study links self-ratings to supervisory ratings rather than to other rating sources for several reasons: Cumulative evidence suggests that supervisors are the most reliable source of job performance ratings (Conway & Huffcutt, 1997; Viswesvaran, Ones & Schmidt, 1996), are likely to be particularly important for job incumbents, and are in fact more strongly related to performance as measured by external criteria (promotions, salary, etc.) than are ratings from other sources (e.g., Atkins & Wood, 2002; Becker & Klimonski, 1989; Beehr, Ivanitskaya, Hansen, Erofeev & Gudanowski, 2001). Analyzing mean difference scores as a second measure of rater agreement, our study considers self-ratings to be lenient to the degree that self-raters overrate their own performance relative to their supervisors; that is, tend to rate it at higher mean levels. (The term “leniency” is used here as it is also in primary research articles. Note, that “leniency” as a common rater bias refers to a different phenomenon, namely that of raters employing scales differently to a group of targets).
Previous Research
Three previous meta-analyses have examined self-evaluations. Two have studied the convergence of self-ratings with supervisory ratings of job performance (Conway & Huffcutt, 1997; Harris & Schaubroeck, 1988). A third meta-analysis examined the agreement of self-evaluations with a variety of performance criteria (Mabe & West, 1982).
Mabe and West (1982). Mabe and West (1982) analyzed a rather comprehensive set of factors that may moderate the relationship between self-evaluations and relevant criteria (overall
r = .31). They grouped moderators into two broad categories: person variables (intelligence, achievement status, locus of control) and measurement conditions. Four of the measurement conditions accounted for most of the variance in the validities of self-evaluations (the expectation that self-assessments will be validated, social comparison instructions, experience with self-evaluation, and instruction of anonymity). We suggest that reexamining some of these moderator hypotheses may be worthwhile for two reasons. First, the set of studies that Mabe and West analyzed makes it questionable whether their results are applicable to the area of job performance. Mabe and West integrated findings for various subject populations (including e.g., college students (81%), managerial samples, and psychiatric patients), as well as various performance categories (e.g., scholastic ability, technical or physical skill, intelligence, job interview performance) and criterion measures (objective tests, grades, and ratings). The present study is confined to samples in which both self-evaluation and criterion measures consist of ratings of performance, and studies that are limited to a specific context, namely questionnaire-based ratings of performance on an actual job. Second, unlike Mabe and West (1982), we will estimate leniency in self-evaluations and also test whether some of their moderator hypotheses apply to mean-difference scores as indicator of rater agreement.
Harris and Schaubroeck (1988). This meta-analysis found an uncorrected correlation of
r = .22 (rho = .35) between self and supervisory ratings of job performance. The authors examined three moderators of rater agreement, job-type and two variables pertaining to the format of ratings: dimensional as opposed to global performance, and behavioral as compared to trait-like scale labels. Only job-type moderated correlational rater agreement. We seek to contribute to the existing literature in that we present a theoretical framework that guides the
selection of a (more) comprehensive set of contextual influences on correlational rater agreement. The meta-analysis of Harris and Schaubroeck (1988) is the only one that also examined leniency in performance ratings. A mean weighted difference between self- and supervisor-ratings of d = .70 indicated that self-ratings were more than half a standard deviation higher than mean supervisory ratings. But given the small number of samples in this meta-analysis (18 independent samples), meta-analytical evidence for leniency in self-ratings is comparatively weak. We not only provide an improved estimate of overall leniency in self-ratings, but conduct moderator analyses.
Conway and Huffcutt (1997). In a more recent study of multi-source performance ratings these authors report estimates of rater convergence among self, supervisor, peer, and subordinate appraisals. Conway and Huffcutt provide estimates of within-source rater reliabilities as well as estimates of between-source validity for ratings made from different perspectives. They found self-other correlations to be rather low, ranging from .14 to .22, and reported results for three moderator variables (managerial position, complexity level, interpersonal vs. cognitive dimensions). As in earlier research, only job-type moderated self-supervisor agreement: correlations were lower for managerial and higher complexity jobs. While previous research showed that job-type is a key moderator for inter-rater correlations, we put forward an examination of its influence on mean difference scores. Additionally, we try to disentangle the effects of job complexity and managerial position.
Theoretical Framework and Hypotheses
The social-cognitive processes involved in performance rating have been described by several authors (DeCotiis & Petit, 1978; Landy & Farr, 1980; Feldman, 1981; DeNisi, Cafferty & Meglino, 1984; Campbell & Lee, 1988; Hauenstein, 1992). These models describe and differentiate the information processing tasks involved in the collecting and integration of cues.
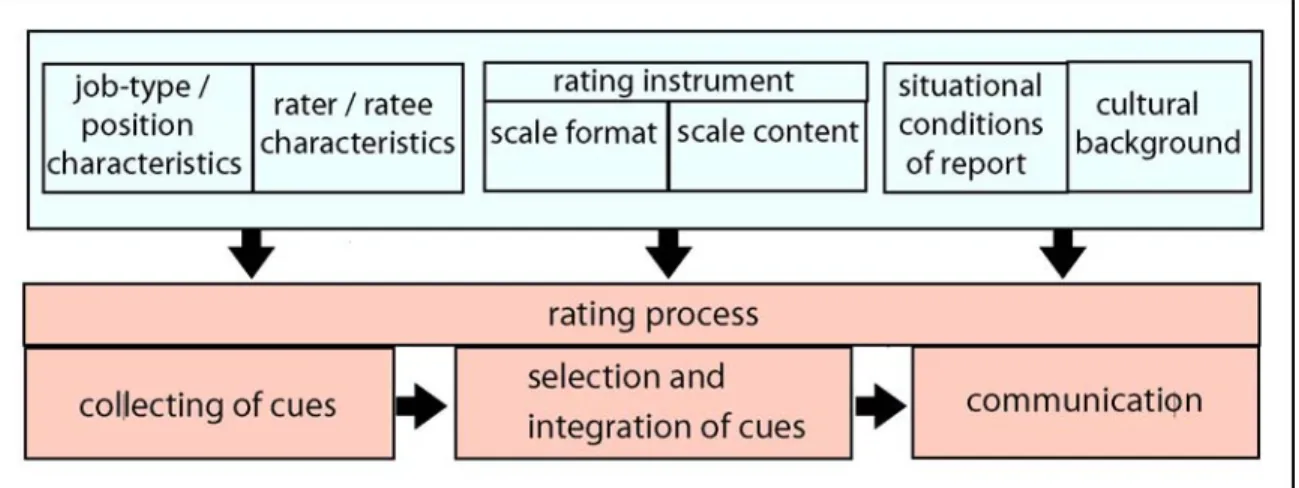
For instance, the process model presented by Landy and Farr (1980) considers observation and retrieval/judgment as two major cognitive stages in performance appraisal, and according to Feldman (1981), performance ratings are the outcome of a dual process (evaluation and decision making) that includes four major cognitive tasks (attention, categorization, recall, and information integration). In accord with more recent approaches (e.g., Murphy and Cleveland, 1995) we argue that purposeful behavior should also be considered in order to understand the outcomes of appraisals. We build on previous work and contribute in that we integrate various perspectives into three cognitive stages of the rating process: the collecting of cues, the selection and integration of cues (judgment), and communication. Furthermore, we decided on a taxonomy of factors that influence the outcomes of the rating process, which classifies relevant factors into five categories: job-type and position characteristics, rater and ratee characteristics, properties of the scales including their format and content, conditions of report, and cultural background (for an overview of relevant factors see also, Murphy & DeShon, 2000; Murphy & Cleveland, 1995). We identified moderator variables that are representative of the five categories of our taxonomy, but limit our discussion to those that are likely to be available in primary research articles. Figure 1 displays a graphical summary of the five-category taxonomy of moderators (top row of figure 1) as well as the three cognitive stages of the rating process (bottom row). Moderators from each of the taxonomy’s categories in the top row of figure 1 exert their influence at specific stages of the rating process. We believe that the proposed three-stage process model is suited for integrating and summarizing various mechanisms that explain why contextual influences serve as moderators of rater agreement. In the following, mechanisms of moderation will be discussed in detail.
##### - include figure 1 about here - ######
We conceive of the collecting of cues for performance as the first stage of the rating process. Cues can stem from the observation of behavior, work results, categorical or stereotype-based information processing (e.g., the ratee’s position in the hierarchy), or from other sources (e.g., previous ratings, feedback from other raters). We avoid the term “observation” that has been used in other models (Landy & Farr, 1980) since we wish to point out that observation of the target is only one source of input into the rating process. In fact, performance ratings are mostly memory-based. At this first stage of the rating process, low or high agreement between two raters’ (later) judgments can be attributed to variables that affect the nature of cues for performance that serve as input into the rating process.
The most important feature of these cues is their ambiguity, which should mainly influence self-supervisory correlations. The ambiguity of cues is lower if work results are well-defined and easy to observe (Wherry & Bartlett, 1982). Accordingly, we will examine the degree to which work environments are standardized (i.e., the distinction of blue-collar and white-collar jobs) and job complexity as moderators of rater agreement (Harris & Schaubroeck, 1988; Conway & Huffcutt, 1997). Other factors include the rater’s opportunity to observe (Rothstein, 1990), the rater’s motivation to observe, and how representative the observed behavior is of job performance. (We will limit our analysis to position characteristics since a preliminary literature search revealed that other factors would scarcely be available in primary articles). All of these factors should affect conceptual disagreement between raters and rating difficulty (Cheung, 1999; Viswesvaran et al., 2002). Job complexity was assessed in two different ways. First, job complexity information was retrieved from the Standard Occupational Classification system to differentiate five levels of job complexity according to the amount of preparation and experience needed (“ONET job complexity”: see the method section). Second, educational level was coded using information on educational degrees reported for the samples (comparing samples with 80%
Master’s degrees and higher degrees to samples with lower percentages of such degrees). This way, we could differentiate three levels of educational attainment: unskilled mostly blue-collar, skilled mostly white-collar, and highly educated samples with at least 80 percent Master’s degrees. Educational level can serve as a proxy for task complexity based on the assumption that the assignment of personnel aims for a match of job demands and educational level. Educational level is an indirect assessment of the intended construct, but has the advantage that it can be coded with high reliability (cf. Gerhart, 1988).Moreover, we seek to make a stronger argument that managerial work may yield especially low rater agreement. Managerial positions are specific in several aspects, including a sometimes hard to observe association of work behavior and results, a rather great importance of interpersonal behavior, and the achieving of results by working through others. We try to disentangle the effects of managerial position and job-complexity to determine whether managerial samples truly yield lower self-other agreement.
Hyp. 1: Correlational agreement is higher if samples stem from more standardized work environments (blue-collar vs. white-collar samples).
Hyp. 2: Correlational agreement is lower for samples with high (ONET) job complexity. Hyp. 3: Correlational agreement is lower for samples with higher levels of education. Hyp. 4: Correlational agreement is lower for managerial samples even when ONET job complexity / level of education is controlled for.
The second important mechanism that is related to the first stage of the rating process pertains to the assignment of the stimulus to a category and later recall of information that is also likely to be category-based (Feldman, 1981). An example of raters relying on heuristics in performance ratings is provided by research on performance expectations or the performance-cue effect (Staw, 1975; Baltes, & Parker, 2000; Martell, & Leavitt, 2002) that may cause response bias during later ratings (Martell, Guzzo, & Willis, 1995). Position characteristics (educational
level or managerial position) may provide cues that give rise to category based assessment. In a rather exploratory way, we examine the effects that position characteristics have on mean-difference scores.
Stage II: Selection and Integration of Cues
During actual appraisals, raters have to reach a judgment based on the retrieval of information regarding the targets’ behavior on the job. Cues for performance have to be selected and integrated into an assessment of the target. At this second stage, interrater agreement depends on (1) whether raters identify the same cues to be relevant, and (2) whether they use these cues in the same way (note the parallel to probabilistic models of accuracy in social perception research, e.g., Goldstein, 2004). The rating instrument can now be considered a major intervening variable2. Relevant properties of the rating instrument include both scale format and scale content. Independent of the cues that raters recall regarding performance, stimuli and clues provided by the rating instrument may influence rater behavior; the extent to which raters lack a common understanding of the behavior they are to evaluate, and use idiosyncratic or implicit theories (Kenny, 1991).
Properties of the Rating Instrument and Correlational Agreement
Scale format and correlational agreement. Employing behaviorally defined scales (i.e., items that provide concrete descriptions of behavior – see Smith, & Kendall, 1963 –, or behaviorally anchored rating scales) and using non-judgmental performance indicators may partly eliminate conceptual disagreement between sources and reduce the level of inference involved in ratings. In the case of non-judgmental performance indicators (performance criteria that are independent of human judgment, e.g., time to complete a task, financial indicators3), ratings not only involve lower levels of inference, but can also be rendered verifiable. At minimum, such ratings may appear more verifiable to raters, and respondents may be more
reluctant to distort ratings as this involves the risk of losing face through a potential or imagined validation of ratings. Another approach to explaining low self-other correlations draws on the idea that self-raters have no clear reference standard for making their judgments. More specifically, self-raters lack information about relevant comparison standards, or choose a comparison standard other than the one intended by the designers of the appraisal system. In sum, the following hypotheses were examined regarding the influence of scale format:
Hyp. 5a4: Correlational agreement is higher if behaviorally defined rating scales are used. Hyp. 6a: Correlational agreement is higher if performance indicators are non-judgmental. Hyp. 7a: Correlational agreement is higher if scales are defined in relative terms or instruct subjects to consider a comparison group.
Scale content and correlational agreement. The assumption that scale content influences correlational agreement in ratings will be tested through comparing (1) overall and dimensional performance, (2) ratings for performance and trait-like scale labels (= scale labels that represent characteristics of a person that are rather stable over time and are likely to be thought of as "traits" by laypeople, such as "outgoingness", "creativity", "self-confidence", and "action orientation"; see also Harris & Schaubroeck, 1988), as well as (3) ratings for task and contextual performance (to make this distinction we refer to the work of Borman & Motowidlo, 1993, and Motowidlo & van Scotter, 1994). Central to the related hypotheses is a potential reduction in conceptual disagreement and the level of inference. Even if perceptions of performance in specific dimensions differ, the overall impression of an employee may reach higher levels of agreement. Task performance includes explicit expectations that are held towards job incumbents, and job incumbents are more likely to receive feedback concerning their task proficiency from supervisors. On the part of the supervisors, ratings for contextual performance may be less accurate. Conway (1999) reported that supervisors tended to pay less attention to
contextual performance in targets than colleagues did, and are likely to have less opportunity to observe related behavior in their subordinates. Finally, for reports of personality, self-deceptive tendencies apply and may add to the subjective selecting and weighting of performance-relevant cues that constitute conceptual disagreement.
Hyp. 8a: Correlational agreement is higher for ratings of global / overall performance as compared to dimensional ratings.
Hyp. 9a: Correlational agreement is higher if task performance is rated rather than contextual performance.
Hyp. 10a: Correlational agreement is lower if traits (personality characteristics) are rated rather than (contextual and task) performance.
Scale length and correlational agreement. Psychometric theory predicts that instrument length, i.e., the number of items integrated into a final measure, should be positively related to reliability, and thus the validity of ratings. If raters provide repeated evaluations by responding to a greater number of items, random response error should decrease, and so should conceptual disagreement, as a larger number of items describe the intended construct better. Testing this prediction is of interest since some researchers have suggested that it does not necessarily hold for ratings of job performance (Viswesvaran et al., 1996).
Hyp. 11: Correlational agreement is higher for aggregate than for single-item measures.
Properties of the Rating Instrument and Leniency
A case of systematic bias in ratings is specific to self-ratings, e.g., self-deception, which is motivated by self-protective or self-enhancement needs (Jones, 1990). Moreover, leniency effects can be attributed to impression-management behavior, which arises if respondents consider the possible consequences that their ratings may have. These two mechanisms (self-deception and impression-management) can not easily be separated and contribute jointly to the
outcomes of appraisals (Tetlock, & Manstead, 1985). We will examine properties of scale format that determine how well scales are defined, and properties of scale content that determine the perceived importance of ratings, and the extent to which ratings pose a threat to a positive view of the self.
Scale format and leniency. Whether scale properties that render scale constructs more or less “well-defined” (see Farh & Dobbins, 1989) moderate leniency in self-ratings can be examined by comparing self-ratings for (1) behaviorally defined scales as compared to behavioral item labels (e.g., “leadership ability”), and by (2) comparing ratings for non-judgmental as opposed to non-judgmental performance indicators. Ambiguity in scale labels should decrease self-other agreement as self-raters may select and weigh cues for good performance more freely and in ways that help maintain a positive view of the self. Moreover, social comparison scales or instructions are predicted to influence leniency in self-ratings. When asked to rate their job performance, individuals may select a frame of reference that helps them to control the psychological implications that social comparisons have.
Hyp. 5b: Leniency in self-ratings is lower for behaviorally defined scales.
Hyp. 6b: Leniency in self-ratings is lower for non-judgmental performance indicators. Hyp. 7b: Leniency in self-ratings is lower if scales are defined in relative terms or instruct subjects to consider a comparison group.
Scale content and leniency. Based on the assumption that assessments of overall performance are more threatening to the self than evaluations of specific performance dimensions, we will compare mean difference scores for ratings of overall/global performance with ratings for specific domains of behavior. In addition, the relevance of the dimension rated should influence leniency (Fox, Caspy & Reisler, 1994). We will examine such an effect by comparing ratings for task- and contextual performance. In work settings, task performance is
generally of higher perceived relevance than contextual performance (Conway, 1999). Finally, ratings for traits as compared to performance constructs as scale labels are prone to stir self-deceptive responding and self-enhancement. Selective recall and weighting of information that is in accordance to the self-raters' self-concept is likely to be pronounced if qualities are rated that are perceived as rather global and stable characteristics of a person, rather than work results.
Hyp. 8b: Leniency in self-ratings is higher for ratings of global/overall performance as compared to dimensional ratings.
Hyp. 9b: Leniency is higher if task- rather than contextual performance is rated. Hyp. 10b: Leniency is higher if traits (personality characteristics) are rated rather than task- and contextual performance.
Stage III: Communication
The third stage of the rating process refers to the notion that performance appraisals may incorporate goal-directed behavior. Having reached a judgment, raters have to communicate their judgments by means of a final rating. This can serve various goals such as being accurate, preventing trouble, or gaining rewards (e.g., Murphy & Cleveland, 1995). Accordingly, it can be expected that raters systematically distort their ratings, which will mostly concern the mean level of ratings (e.g., Aitkenhead, 1984). The impression-management view (Schlenker, 1980; Jones & Pittman, 1982) is highly relevant for the communication stage of performance rating as it suggests that employees manage their self-presentation to serve personal goals and to avoid negative outcomes. Thus, different situational incentives (“situational conditions of report") should moderate leniency in self-ratings.
Conditions of Report and Leniency
Primary research has examined three distinguishable rating purposes: administrative use, developmental feedback, and data gathered for research purposes. Therein, the hypothesis will be
tested that administrative ratings show increased levels of leniency because they are tied to valuable outcomes and rewards (e.g. Farh & Werbel, 1986; Harris, Smith & Champagne, 1995; Jawahar & Williams, 1997). In contrast, if appraisals are part of developmental feedback sessions, low self-other agreement can be perceived as an undesirable outcome for several reasons. Targets may perceive low congruence in ratings as a loss of face. A possible reaction then is that targets present themselves in rather modest ways, or even try to guess others’ views of themselves as targets. More positively, job incumbents make highly serious efforts to rate themselves as accurately as possible since they wish to learn from the outcomes of appraisals. Either of the two strategies should result in lower mean-difference scores. Thus, the following predictions regarding the effects of rating purpose were tested.
Hyp. 12a: Leniency in self-ratings is higher if ratings are made for administrative rather than research purposes.
Hyp. 13a: Leniency in self-ratings is lower if ratings are made for developmental rather than research purposes.
If it is true that impression-management concerns contribute to leniency in self-ratings, then the expectation that ratings may be validated should reduce leniency. In fact, empirical evidence exists that shows how a possible disconfirmation of self-descriptions decreases the favorability of self-ratings (e.g., Aitkenhead, 1984). Therefore, we will also assess whether a leniency-effect emerges in self-ratings of job performance due to the expectation that ratings could be validated (in the context of performance appraisal, ratings can be validated either by comparison to other data, such as tests, or socially, via a feedback meeting). Note that Mabe and West (1982) found the expectation that self-reports may be validated to be among the four variables that best predicted correlational agreement between self-appraisal of performance and other criteria. We will assess whether this hypothesis holds for ratings of job performance and
applies to mean difference scores.
Hyp. 14a: Leniency in self-ratings is lower if targets expect their ratings to be validated.
Cultural background. Finally, an important contextual variable is the respondents’ cultural background (Yu & Murphy, 1993; Seike & Takata, 1997; Kwan, et al., 2004). In the following, a broad distinction of Western and Asian cultures is made to delineate the influence of collectivism and individualism on leniency in self-ratings. As Aycan and Kanungo (2002, p. 399) stated, “in individualistic cultures, self-serving bias in performance evaluations occurs more frequently than ‘self-effacement’ or ’modesty bias’, while the reverse holds true for collectivist cultures” (see also, Kim, Park, & Suzuki, 1990; Ramamoorthy & Carroll, 1998). Power distance is correlated with collectivism; according to Aycan and Kanungo (2002), in high power distance cultures, performance appraisals serve to reinforce the authority structure (Fletcher & Perry, 2002), and incentives for leniency do not exist (Blanton & Christie, 2003). With respect to performance ratings, Farh, Dobbins, and Cheng (1991) were the first to present empirical evidence that a modesty-effect in self-appraisals may be observed in Asian societies. However, note that we do not wish to imply that a broad distinction of individualism and collectivism is sufficient to characterize differences in culture between “Eastern” and “Western” countries. The number of samples available does not allow for anything more than sorting countries into broad regional categories in order to test the influence of cultural differences. Within “Western” samples, we differentiate between US and European samples.
Hyp. 15: Samples from more individualistic societies show increased levels of leniency.
Conditions of Report and Correlational Agreement
So far we have restricted our analysis of report conditions to systematic effects on mean difference scores. However, conditions of report such as the purpose for ratings and expecting a validation of ratings can also affect self-supervisory correlations. To the extent that
administrative ratings are intentionally distorted, they should yield lower interrater correlations as compared to ratings that were collected for research purposes only. Developmental ratings, in contrast, may reflect demand characteristics that make in-agreement ratings desirable. In addition, the accountability of raters for their ratings decreases when ratings are made for research purposes (London, Smither & Adsit, 1997), and random response error may increase due to low rater motivation if ratings are not of high relevance. Thus, we predict administrative ratings to yield lower and developmental ratings to yield higher correlations as compared to research-based ratings. Therein, we consider research-based ratings to serve as a standard for comparison (informing respondents that ratings are collected for “research purposes only” is typically considered a means to reduce rater bias). Similarly, accountability and rater motivation is relevant for a potentially positive effect of the expectation that ratings may be validated.
Hyp. 12b: Correlational agreement is lower if ratings are made for administrative rather than research purposes.
Hyp. 13b: Correlational agreement is higher if ratings are made for developmental rather than research purposes.
Hyp. 14b: Correlational agreement is higher if self-raters expect a validation of ratings. In sum, the current meta-analysis examines a comprehensive set of contextual factors that potentially moderate self-other agreement. We suggest a three-stage model of the rating process and review the empirical evidence for the relevance of each of these three stages. The proposed model incorporates, unlike earlier models, the influence that situational conditions (i.e., goal-directed behavior) have on the outcomes of the rating process (“communication stage”).
Method
Literature Search Procedures
primary studies. The first strategy involved examining the reference sections of previous research reviews and relevant primary research (Conway & Huffcutt, 1997; Harris & Schaubroeck, 1988; Hoyt & Kerns, 1999; Mabe & West, 1982; Viswesvaran et al., 1996). Second, computer searches of the PsychInfo database, the Business Source Premier database (EBSCO), the Educational Resources Information Center database (ERIC), and the Dissertations Abstracts Database (UMI ProQuest) were conducted. Keywords such as performance appraisal and job performance were combined with the terms self-ratings, self-appraisal, self-evaluation and multi-source ratings to identify potentially relevant studies. Third, a manual search of the following journals was completed: Academy of Management Journal, International Journal of Selection and Assessment, Human Relations, Journal of Applied Psychology, Journal of Occupational and Organizational Psychology, Organizational Behavior and Human Decision Processes, and Personnel Psychology. Finally, we wrote to authors whom we knew to have unpublished relevant data.
Inclusion Criteria and Inter-coder Reliability
To be included in the current analysis, research reports had to (1) contain a quantitative measure of agreement for self and supervisory ratings – either a correlation coefficient, or mean levels of ratings together with standard deviations, (2) be set in field settings (laboratory research studies were not included), and (3) report ratings made for job performance (data gathered in educational contexts, or in the context of assessment centers were not included). Coding criteria were specified in a coding manual, and inter-coder reliabilities were calculated before the first author coded the entire set of articles. To obtain an estimate of inter-coder reliability, ten randomly chosen research articles (40 coefficients) were selected for coding by a second person who held a PhD in organizational psychology. Based on these 40 coefficients, we calculated intercoder reliabilities for all variables whose coding involved a judgment. These included the
distinction of blue-collar and white-collar jobs (agreement percentage: 92%, Kappa: .75), five levels of job complexity (Spearman correlation = .85, Kappa: .51,) the classification of overall, task, or contextual performance (84%, .76), and judgmental vs. non-judgmental ratings (91%, .75). Only the distinction of traits from other performance constructs (44% agreement) did not reach a satisfactory reliability level. Therefore, the two raters discussed each scale label for all studies to select for those of which both raters agreed represented personality characteristics.
The ONET based Measure of Job Complexity
Two raters referred to the Occupational Information Network database (ONET, http://online.onetcenter.org) to code all samples. Searches were run for specific occupations based on job titles and other information about the sample and the setting that was provided in primary articles. The database considers educational requirements as well as the amount of training (on-the-job training, and/or vocational training) and work experience needed to categorize occupations into five levels of job complexity (Job Zones). Zone One occupations (“little or no preparation needed”) sometimes require a high school diploma or a formal training course, while no previous work-related skill or experience is needed, and a few days to a few months of on-the-job training enable workers to do their jobs (examples: cashier, service station attendant). Zone Two occupations (“some preparation needed”) usually require a high school diploma and may require some vocational training (examples: metal worker, retail salesperson). Occupations in Zone Three (”medium preparation”) sometimes require a Bachelor’s degree and three or four years of apprenticeship or vocational training. Often workers must have passed a licensing exam, and usually need one or two years of informal training and on-the-job experience (examples: municipal clerk, machinist). Most Zone Four occupations (“considerable preparation”) require a four-year bachelor's degree and a minimum of two to four years of work-related skill, knowledge, and experience (examples: market research analyst, airline pilot).
Finally, Zone Five occupations (“extensive preparation”) require a master's or even a Ph.D. degree and more than five years of experience (examples: surgeon, chief executive)5.
Meta-analytical Techniques
We employed the modified weighted-least-squares regression procedures implemented in the SPSS macros for meta-analysis described by Lipsey and Wilson (2001). A random effects model was used to calculate an overall effect size estimate that generalizes beyond the current set of primary research articles. The fixed-effects model was employed for moderator analyses to generate results that permit inference on the current set of primary research findings (an approach that was used by previous meta-analyses as well, and allows for immediate comparison of results). To deal with the fact that primary research articles often report more than one effect size, we used Cooper’s “shifting unit of analysis” approach (Cooper, 1998, p.152). An inter-correlation table was used to inform the analysis about possible confounds within moderator variables. Finally, note that we employed the unbiased estimator of index d provided by Hedges (1981) to guard against biased estimates in cases of small sample sizes.
Corrections for Study Artifacts
We made corrections for two study artifacts, sampling error and error of measurement, correcting correlations and mean differences for both supervisor- and self-rating unreliability (Hedges & Olkin, 1985; Hunter & Schmidt, 1990). For supervisory ratings, unreliability was estimated through the formulas presented in Hoyt (2000), i.e., by combining coefficient alpha as an intra-rater measure of scale reliability with an estimate of rater and dyadic bias obtained from generalizability studies (Hoyt & Kerns, 1999). Thus, we avoided the more problematic use of interrater reliabilities (see Murphy & DeShon, 2000; Schmidt, Viswesvaran, & Ones, 2000). Seventy-five of the primary research articles provided coefficient alpha for their scales (mean alpha: .85). This approach resulted in an average correction factor of .51 (which is actually close
to meta-analytical estimates of interrater agreement (.52); see Viswesvaran et al., 1996). For single items and for those cases that did not report alpha, we employed the average correction factor of .51. rerate reliability was used to correct for unreliability in self-ratings. Rate-rerate reliability assigns transient error (random variance from differences in mood, mental state, etc.) to measurement error, assuming that the level of performance remains constant throughout the period between test and retest. As test-retest periods were short, the resulting correlation between the two time points can be attributed to a lack of reliability rather than a change in true scores of performance, i.e., a lack of stability (Sturman, Cheramie, & Cashen, 2005). Again, we applied the sample-size-weighted average of all rate-rerate reliabilities (ryy = .74; k = 30) to replace missing information. Unreliability in difference scores depends on unreliability in self- and supervisory ratings, and is adversely affected if correlations of both are high (Murphy, & Davidshofer, 2005). As the correlation between self- and supervisor ratings is typically low, it should be adequate or even slightly conservative to correct mean-difference scores using the product of unreliability in self- and supervisory ratings. Leniency in self-ratings may imply that self-ratings show range restriction as self-raters tend not to use the full range of the scales presented to them. We do not consider this effect to be in need of any artifact correction. Leniency in self-ratings is not sample-based and is not an outcome of study design, but reflects behavior that truly characterizes self-raters. As inference does not depend on corrections for attenuation, we based the reporting of results on sample-size weighted coefficients; nonetheless, effect-size estimates corrected for attenuation appear in tables one to three.
Results
A total of 102 research articles were located that were published between 1955 and 2007 which reported information on 128 independent samples. For a total of 115 independent samples, self-supervisory correlations (504 correlation coefficients – note that most studies report several
coefficients – with a total of 37,751 respondents), and for 89 samples, mean difference scores (altogether 437 mean difference scores; 35,417 respondents) were obtained. A majority (84; 66%) of the studies retrieved were conducted in the United States. Forty-four articles reported information on samples from Australia (2), Canada (1), China (1), Finland (1), Germany (4), Great Britain (13), Israel (2), Malaysia (1), Nigeria (1), the Netherlands (5), Poland (1), Republic of China (9), Russia (1), and two mixed samples. The majority of studies used convenience samples and collected data from an average of 359 respondents. The most frequent setting of the research was the private sector industry (k = 87; 74%), followed by public service and government agencies (k = 25; 21%), and the military (k = 6; 5%).
Meta-analytical Results for Overall r and d
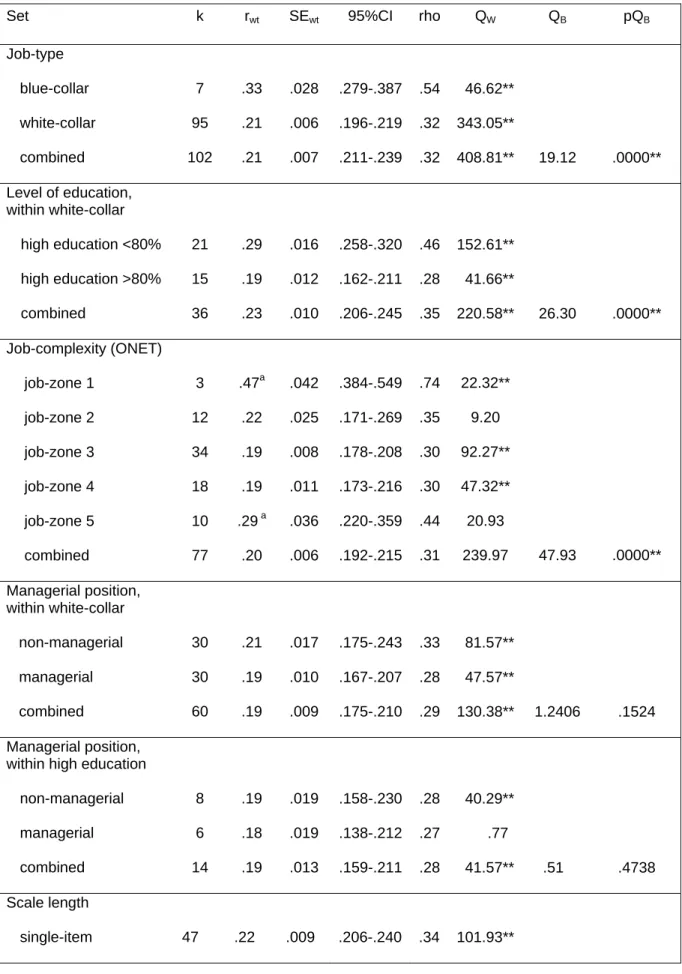
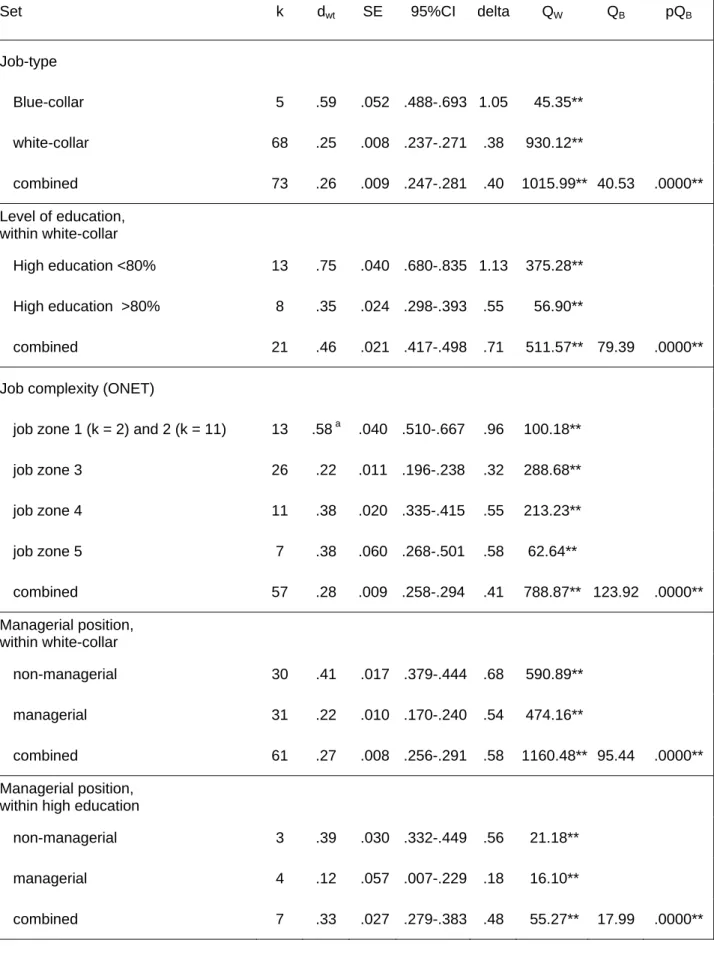
An average correlation of r = .22 (rho = .34) for self-supervisor correlations was obtained when r was corrected for sampling error (sampling error and unreliability). The overall sample-size weighted estimate of leniency in self-ratings yielded a mean difference of d = .32 (delta =
.49, after corrections for unreliability), indicating that self-ratings were at higher mean levels than supervisory ratings (see table 1)6. This difference in mean levels was highly significant. Omnibus tests of homogeneity revealed significant heterogeneity for both index r (Q = 460, df = 114, p = .000) and d (Q = 1586, df = 88, p = .000). Thus, and since our moderator analyses were driven by theoretical predictions, the next step was to conduct moderator analyses.
##### - insert Table 1 “overall results” about here - #####
Moderator Analyses
Collecting of cues – position characteristics. Position characteristics moderated both correlational and mean-level agreement. Higher levels of education were associated with lower correlational agreement (highly educated: r = .19; white-collar: r = 21; blue-collar: r = .33), as was ONET job complexity (as a pseudo continuous covariate in a weighted least square
regression, BetaONET = -.14, SE = .01, p = .025). Tables 2 and 3 display effect size estimates for each of the five levels of the ONET guided complexity rating. Note that a valid interpretation of results regarding “job complexity” requires simultaneous consideration of “job complexity” and “managerial position” (both job-type characteristics are confounded as managerial samples never fell into complexity categories 1 and 2, but typically into categories 3 and 4, sometimes 5). In a joint weighted least square regression both covariates showed a significant negative relationship with correlational agreement (BetaONET = -.13, SE = .01 , p = .04; Betamgmt = -.15, SE = .01 , p = .03); i.e. managerial position remained negatively associated with inter-rater correlations after ONET job complexity was controlled for. Within the subset of samples that reported information on educational degrees, managerial position did not explain variability in correlational agreement over and beyond educational attainment (see Table 2). An exploratory test of job-type as a moderator of leniency revealed that both less standardized work environments and job complexity were associated with lower mean difference scores (blue-collar: d = .59; white-collar: d = .25; job zone 1/2: d = .58; job zone 5: d = .38; see Table 3 for detailed results). Within those white-collar samples that reported information on educational degrees, higher educational attainment was associated with lower levels of leniency (low percentages of Master’s degrees: d
= .75; high percentages: d = .35). Managerial samples yielded lower levels of leniency in self-ratings after educational level or ONET complexity were controlled for (d = .22 within white-collar samples and d = .12 within highly educated samples; in a regression with “ONET complexity” and “managerial position” as covariates, managerial position even remained the only significant predictor of index d: BetaONET = .04, SE = .02, p = .23; Betamgmt = -.34, SE = .02,
p = .00).
Selection and integration of cues – report format. Among scale format properties, only the use of non-judgmental (r = .46) as opposed to judgmental performance indicators (r = .21)
showed a significant moderator effect regarding correlational agreement (Q = 38.36, df = 1, p = 0000). It is worth noting that scale length failed to influence correlational agreement: single-item measures yielded correlations (r = .22) that were almost identical to that of aggregated measures (r = .21). Further exploratory analyses showed that within aggregated measures, composite scores which integrated a number of heterogeneous items (several performance dimensions) showed significantly higher self-supervisor correlations (r = .23) than aggregated scores that were based on a set of homogeneous items (r = .18; Q = 12.73, df = 1, p = .0004) 7. Scale content also influenced self-supervisor correlations. Correlations tended to be lower for personality traits (r = .17) than for ratings of task or contextual performance (r = .21; Q = 8.28, df = 1; p = .0040). Both scale format and scale content affected leniency in self-ratings. The use of social comparison scales reduced leniency in self-ratings from d = .33 to d = .21 (Q = 52.78, df = 1, p = 0000); while neither the use of non-judgmental performance indicators nor of behavioral item descriptions affected mean difference scores positively. Sorting scale labels into three categories of performance constructs yielded significantly different estimates of leniency for contextual performance (d = .32), task performance (d = .27), and trait labels (d = .45). Finally, self-ratings for single-item measures of global performance (d = .34) were significantly more lenient than single-item measures of performance in specific domains (d = .20; Q = 12.34, df = 1, p = .0004).
##### - insert Tables 2 and 3 “moderator analyses” about here - #####
Communication – conditions of report. The magnitude of correlation coefficients tended to depend on the expectation that ratings may be validated (Q = 5.57, df = 1, p = .0182), but was not affected by rating purpose once the influence of sample composition (managerial samples) was controlled for. In contrast, both rating purpose and expecting a validation affected leniency in self-ratings. Mean-difference scores were significantly lower for research-based ratings (d = .24) as compared to developmental ratings (d = .39) and administrative ratings (d = .40). Again,
“managerial position” was controlled for as “developmental samples” consisted mostly of managers as respondents. Within managerial samples, research-based ratings still showed lower levels of leniency (d = .18 vs. d = .33). When a validation of ratings was expected, the amount of leniency in self-ratings decreased from d = .27 to d = .23, but this tendency was not significant (Q = 1.88, df = 1, p = .1705). Finally, leniency in self-reports differed between the subset of Asian samples (d = .09), European samples (d = .17) and samples stemming from the USA (d = .32). Therein, the difference between US based samples and both European and Asian samples reached significance (Q = 38.74, df = 1, p = .0000), as well as did the difference between Asian and European samples (Q = 3.81, df = 1, p = .0488).
Discussion
The current overall meta-analytical estimate of the correlation between self- and supervisory ratings of r = .22 (r = .34, when corrected for measurement error) is consistent with earlier meta-analyses (Conway & Huffcutt, 1997; Harris & Schaubroeck, 1988). It confirms the notion that correlational agreement in self- and other ratings of performance is of low to medium magnitude. The fact that the current overall effect size estimate is consistent with previous results is encouraging in that we do not have to assume that unexpected changes occurred in the database of primary studies. Our results estimate leniency in self-ratings to be at a lower level than the previous meta-analytical results provided by Harris and Schaubroeck (1988), who reported index d to be .70. Still, self-ratings were found to overrate supervisory ratings by one third of a standard deviation. To explore whether the considerable difference between the current result and that of Harris and Schaubroeck (1988) reflects true changes in the database rather than computational differences, we conducted a separate analysis that included only research articles that had been published before 1988. This analysis in fact produced a higher overall sample size weighted mean difference of d = .51 (k = 22; delta = .82). In conclusion, it seems that more
recent studies yield lower levels of leniency.
Our review demonstrated the relevance of three cognitive stages in the rating process, including the collecting of cues, the selection and integration of cues, and communication. Referring to the first stage, we analyzed several position characteristics (blue/white collar, managerial position, educational level, job complexity) that may particularly affect the ambiguity of cues for performance. Position type is a comprehensive category that determines various characteristics of an appraisal situation simultaneously, including the nature of cues that are available for later recall.In fact, earlier meta-analyses (Conway & Huffcutt, 1997; Harris & Schaubroeck, 1988) found job type to be nearly the only moderator of correlationalagreement in performance ratings. Our results confirm the relevance of job complexity (assessed through educational level and ratings guided by the ONET database) and managerial position as moderators of correlational agreement. We tried to disentangle the influence of job complexity and managerial position; wherein our results depended on how job complexity was assessed. When educational level (high versus low percentages of Masters’ degrees) was controlled for, managerial samples yielded correlation coefficients that were similar to those obtained from other samples. However, managerial samples indeed produced lower correlations when job complexity was controlled for by using the five-level ONET complexity measure. Specific domains of behavior that are characteristic of managerial work (interpersonal behavior, supervisory responsibility, working through others) may cause correlations to be lower while job complexity, operationalized through the amount of preparation and experience needed, varies across managerial samples. But this could not be investigated further since the information available in primary studies concerning the nature of managers’ responsibilities was limited. In an exploratory analysis, we also found evidence that position characteristics are related to mean difference scores. This might be interpreted as evidence for category-based information
processing in performance ratings. Higher educational level, higher ONET complexity ratings (job zones 3 to 5), and managerial positions were associated with reduced mean difference scores. Within samples of similar job complexity (educational level or ONET ratings), managers tended to yield lower mean difference scores. Further research is needed to determine the exact mechanisms underlying these findings.
Related to the second stage of the rating process, selection and integration of cues, we examined variables that influence how cues for performance are selected and integrated into a judgment depending on features of the instrument used, i.e., on scale format and scale content. Only rather strong approaches to alleviating conceptual disagreement, such as the use of non-judgmental performance indicators, made a noticeable impact on correlational agreement. Regarding the influence of scale content, we found the use of trait-like scale labels to be associated with especially low levels of correlational agreement. Other approaches to reducing rater bias through scale design failed to positively influence self-other correlations (see also Landy & Fair, 1983). Contrary to the findings of Mabe and West (1982), this included the use of social-comparison scales. Job performance is a complex construct that has many facets. It is possible that this complexity allows raters to successfully avoid negative comparisons with others, and unlike in other contexts (academic performance, sports), to strongly attribute better outcomes of others to situational advantages. An impressive example for the failure of performance ratings to follow the predictions of classic psychometric theory is our finding that single-item measures reached equal levels of correlational agreement as compared to aggregated scores (on average, aggregate ratings were based on 12.1 items). Similarly, a meta-analysis of Viswesvaran et al. (1996) on reliability estimates of performance ratings found that longer forms were associated with higher intra-rater reliabilities (coefficient alpha) but not higher inter-rater reliabilities. Why might reliability advantages fail to affect interrater correlations positively? In
their early model of the rating process, Wherry and Bartlett (1982) distinguished three error components that arise in performance ratings: measurement error, areal bias, and overall bias. Measurement error, or random response error, can be reduced by adding extra items to a scale. ”Areal bias”, i.e., bias held against an individual as a performer in a specific area of behavior, can be reduced by integrating items that assess performance in various areas. In fact, in a post hoc analysis, we found that integrating heterogeneous items (from several scales), rather than homogeneous items (from a single scale), influenced rater agreement positively. ”Overall bias”, i.e., a general bias against an individual regardless of performance domain, can only be reduced by integrating ratings made by various raters. To the extent that overall bias and areal bias are the dominating error components in performance appraisal, longer scales exert comparatively little influence on rater agreement. Besides, the use of ad-hoc designed scales is not uncommon in performance appraisal. Aggregating several scales or items with low intra-rater consistency can reduce the variability of the scores, so that the total variance of aggregated scores then turns out to be lower than that of scores based on fewer or even single items (Hoyt & Kerns, 1999). In the articles reviewed, coefficient alpha ranged from .32 to .95 with a mean of .73 for self-ratings, and from .51 to .96 with a mean of .85 for supervisory ratings, so that aggregate ratings were not consistently associated with higher levels of intra-rater reliability.
While scale properties mostly failed to influence inter-rater correlations, they have systematic effects on mean-level discrepancies between and other-ratings: Leniency in self-ratings was moderated by scale format (social comparison scales), as well as scale content (overall vs. dimensional ratings; task vs. contextual performance vs. traits). This confirms the notion that biased or self-deceptive information processing is pronounced for less well-defined (“global”) performance dimensions. These facilitate a selective recall and weighing of information that is in accordance with the self-raters’ self-concepts (self-enhancement bias) or
give rise to impression-management behavior (Farh & Dobbins, 1989; Baumeister & Jones, 1978). Contrary to our hypothesis which referred to the perceived importance of task and contextual performance (Yammarino & Waldman, 1993; Conway, 1999), employees tended to overrate their contextual performance more than their task performance. The fact that contextual performance is likely to be less well defined seems to be of greater relevance to rating outcomes than its comparatively lower perceived importance. As expected, ratings for traits showed particularly high levels of leniency that were higher than those found for task, contextual, and overall performance. A possible explanation is that trait ratings do not only address past behavior but also raters’ expectations of current and future behavior (Wilson & Ross, 2001).
Finally, the third stage of the hypothesized rating process takes into account that ratings may be considered an act of communication that is directed to others, and is therefore related to situational conditions of report. Two important such variables could be included in the current meta-analysis: expecting a validation of self-ratings (e.g., through test results or a meeting with the supervisor), and rating purpose. The current study is the first to include employee development into the study of rating purpose and provides evidence of a purpose effect. Unexpectedly, results suggest that developmental performance ratings (within managerial samples) are inflated as compared to those found in research based settings. In contrast, expecting a validation of ratings tended to be associated with more modest self-appraisals. Thus, developmental settings seem to elicit self-presentational concerns that do not operate in ways similar to the expectation that ratings will be validated; rather, they elicit a more overly positive self-presentation. After all, research-based ratings seem to yield the lowest level of distortions in self-ratings despite the lower accountability of raters. Future research should further examine the demand characteristics that are present in developmental feedback settings, and their determinants. Regarding effects of cultural background, the current investigation could not
confirm a modesty bias (i.e., that self ratings are lower than supervisory ratings) within a number of Asian countries (see Yu & Murphy, 1993), but our findings indicate that both mean-level and correlational agreement may be higher for less individualistic societies.
Conclusions and Practical Implications
The current study presented parallel analyses of mean level and correlational agreement. While correlational agreement was largely determined through the nature of cues that are available during early stages in the rating process (position characteristics and the use of scales with non-judgmental performance indicators were the only moderators), mean difference scores seem to depend on features of the whole appraisal process, from the collecting of cues, their selection and integration, to the communication of evaluations. Given the visibility and the psychological implications of mean difference scores in performance ratings, meta-analytical evidence on factors that moderate their magnitude is instructive. Difference scores should only be interpreted and communicated back to recipients of feedback while taking into account that patterns of mean-level agreement depend on contextual features of the rating process, scale format, and scale content. Importantly, rating purpose affects the magnitude of mean difference scores, and results for respondents with different educational backgrounds, and may not be comparable. Given that we found that social comparison scales (scales with relative rather than absolute scale anchors) were able to reduce leniency in self-ratings, they should be employed much more often than has been the case. Finally, and in agreement with many textbooks that have advised against their use, ratings for traits – but also for overall performance – elicit unnecessarily high levels of leniency in self-ratings. In sum, the increasing use of self-ratings in performance appraisals is a challenge given the negative implications of “discrepant feedback”. The current meta-analysis provides standards of comparison that can guide the interpretation of feedback results as well as suggestions that may help guard against unnecessary discrepancies.
Limitations and Future Research
Several limitations and challenges for future research exist within this study. First, the moderators examined in the present meta-analysis could not explain all the variation in effect sizes between samples (see the significant QW values that indicate within group heterogeneity, tables 2 and 3). Additional moderator variables may be relevant, and some of the coded moderator variables may lack precision. For future meta-analytical research it will be important to conduct simultaneous analyses of all relevant covariates, which requires a still much larger set of samples (or that researchers report more complete information about their samples). Second, research in field settings has not accumulated a large enough database for addressing the effects of individual differences, and besides, some individual difference variables (such as ratee gender) are typically confounded with other variables (such as the type of job sampled). To allow for a meta-analytical study of these effects, field researchers should control for confounds or should report effect sizes for subgroups of their samples separately and more regularly than has been the case. Also, more research in diverse Asian countries is needed to validate the generalizability of the “modesty-hypothesis”. In addition, theoretical explanations as to exactly how culture influences rating behavior should be advanced in the context of performance rating in organizations (see Heine, Lehman, Markus, & Kitayama, 1999; Amy, Abramson, Hyde, & Hankin, 2004). The evidence that could be accumulated is sufficient to already demonstrate the relevance of each of the three stages of the process model through exemplary moderator effects. Other moderator variables can be incorporated into the suggested taxonomy and be linked to the process model; but future research should aim at increasing our understanding of why it is not possible to explain variability in effect sizes more completely.
References
Studies included in the meta-analysis are marked with an asterisk.
Aitkenhead, M. (1984). Impression-management and consistency effects in the processing of feedback. British Journal of Social Psychology, 23, 213-222.
Amy, H. M., Abramson, L. Y., Hyde, J. S., & Hankin, B. L. (2004). Is there a universal
positivity bias in attributions? A meta-analytic review of individual, developmental, and cultural differences in the self-serving attributional bias. Psychological Bulletin, 130, 711-747.
*Arnold, J., & Davey, K. M. (1992). Self-ratings and supervisor ratings of graduate employees' competences during early career. Journal of Occupational and Organizational
Psychology, 65, 235-250.
*Atkins, P. W. B., & Wood, R. E. (2002). Self- versus others' ratings as predictors of assessment center ratings: Validation evidence for 360-degree feedback programs. Personnel
Psychology, 55, 871-904.
*Atwater, L. E., Ostroff, C., Yammarino, F. J., & Fleenor, J. W. (1998). Self-other agreement: Does it really matter? Personnel Psychology, 51, 577-598.
*Atwater, L. E., & Yammarino, F.J. (1992). Does self-other agreement on leadership perceptions moderate the validity of leadership and performance predictions? Personnel Psychology, 45, 141-164.
Aycan, Z., & Kanungo, R. N. (2002). Cross-cultural industrial and organizational psychology: A critical appraisal of the field and future directions. In N. Anderson & D. S. Ones (Eds.),
Handbook of industrial, work and organizational psychology, Volume 1: Personnel psychology (pp. 385-408). London, England: Sage.
*Baird, L. S. (1977). Self and superior ratings of performance: As related to self-esteem and satisfaction with supervision. Academy of Management Journal, 20, 291-300. Baltes, B.B., & Parker, C.P. (2000). Reducing the effects of performance expectations on
behavioral ratings. Organizational Behavior and Human Decision Processes, 82, 237-267.
Bandura, A. (1986). Social foundations of thought and action: A social cognitive theory. Upper Saddle River, NJ: Prentice-Hall.
officers for understanding successful performance. Applied Psychology: An International Review, 40, 437-454.
Baumeister, R. F., & Jones, E. E. (1978). When self-presentation is constrained by the target's knowledge: Consistency and compensation. Journal of Personality and Social
Psychology, 36, 1978, 608-618.
*Becker, T. E., & Klimoski, R. J. (1989). A field study of the relationship between the
organizational feedback environment and performance. Personnel Psychology, 42, 343-358.
*Becker, T. E., & Vance, R. J. (1993). Construct validity of three types of organizational citizenship behavior: An illustration of the direct product model with refinements.
Journal of Management, 19, 633-682.
*Beehr, T. A., Ivanitskaya, L., Hansen, C. P., Erofeev, D., & Gudanowski, D. M. (2001). Evaluation of 360 degree feedback ratings: Relationships with each other and with performance and selection predictors. Journal of Organizational Behavior, 22, 775-788. *Blackburn, R. T., & Clark, M. J. (1975). An assessment of faculty performance: Some
correlates between administrator, colleague, student, and self-ratings. Sociology of Education, 48, 242-256.
*Blank, W., Weitzel, J. R., & Green, S. G. (1990). A test of the situational leadership theory.
Personnel Psychology, 43, 579-597.
Blanton, H., & Christie, C. (2003). Deviance: A theory of action and identity. Review of General Psychology, 7(2), 115-149.
Borman, W. C., & Motowidlo, S.J. (1993). Expanding the criterion domain to include elements of contextual performance. In N. Schmitt & W. Borman, C. (Eds.), Personnel Selection in Organizations (pp. 71-98). San Francisco, CA: Jossey-Bass.
*Brett, J. F., & Atwater, L. E. (2001). 360° Feedback: Accuracy, reactions, and perceptions of usefulness. Journal of Applied Psychology, 86, 930-942.
*Brief, A. P., Aldag, R. J., & Van Sell, M. (1977). Moderators of the relationship between self and superior evaluations of job performance. Journal of Occupational Psychology, 50, 129-134.
*Brutus, S., Fleenor, J. W., & London, M. (1998). Does 360-degree feedback work in different industries? A between-industry comparison of the reliability and validity of multi-source performance ratings. Journal of Management Development, 17, 177-190.
Campbell, D. J., & Lee, C. (1988). Self-appraisal in performance evaluation: Development versus evaluation. Academy of Management Review, 13, 302-314.
*Carless, S. A., Mann, L., & Wearing, A. J. (1998). Leadership, managerial performance and 360-degree feedback. Applied Psychology: An International Review, 47, 481-496.
Cervone, D., Mor, N., Orom, H., Shadel, W. G., & Scott, W. D. (2004). Self-efficacy beliefs and the architecture of personality: On knowledge, appraisal, and self-regulation. Baumeister, R. F. & Vohs, K. D. (Eds.) (2004). Handbook of self-regulation: Research, and
applications (pp. 188-210). New York: Guilford Press.
Cheung, G. W. (1999). Multifaceted conceptions of self-other ratings disagreement. Personnel Psychology, 52, 1-36.
*Church, A. H. (1997). Do you see what I see? An exploration of congruence in ratings from multiple perspectives. Journal of Applied Social Psychology, 27, 983-1020.
*Church, A. H., Rogelberg, S. G., & Waclawski, J. (2000). Since when is no news good news? The relationship between performance and response rates in multirater feedback.
Personnel Psychology, 53, 435-451.
*Cleveland, J. N., & Shore, L. M. (1992). Self- and supervisory perspectives on age and work attitudes and performance. Journal of Applied Psychology, 77, 469-484.
Conway, J. M. (1999). Distinguishing contextual performance from task performance for managerial jobs. Journal of Applied Psychology, 84, 3-13.
Conway, J. M., & Huffcutt, A. I. (1997). Psychometric properties of multisource performance ratings: A meta-analysis of subordinate, supervisor, peer, and self-ratings. Human Performance, 10, 331-360.
Cooper, H. (1998). Synthesizing research. A guide for literature reviews. Thousand Oaks, CA: Sage.
*Costigan, R. D., Insinga, R. C., Kranas, G., Ilter, S. S., Berman, J. J., & Kureshov, V. A. (2005). Self-ratings of workplace behaviour: Contrasting Russia and Poland with the United States. International Journal of Management, 22, 341-350.
DeCotiis, T.A., & Petit, A. (1978). The performance appraisal process: A model and some testable hypotheses. Academy of Management Review, 21, 635-646.
DeNisi, A.S., Cafferty, T.P., & Meglino, B.M. (1984). A cognitive view of the performance appraisal process: A model and research propositions. Organizational Behavior and Human Performance, 33, 360-396.