GLOBAL WARMING CONTINUES UNABATED
Ph.D Indian Forest Service, 3/184, Vibhav khand, Gomtinagar, Lucknow, Uttarpradesh, India
ARTICLE INFO ABSTRACT
The year 2016 was the warmest on record in all major global surface temperature datasets, although, in some, the difference between 2016 and the second warmest year, 2015, was within the margin of uncertainty. In the three dataset
the 1961
value set in 2015. This is also about 1.1 °C above the pre
dataset3 was even warmer, with global mean temperatures 0.62 °C above the 1981
°C warmer than those of 2015. The concentration of green house gases have also multiplied manifold in the last couple of decades. The World Meteorological O
of the Global Climate states that the latest analysis of observations from the WMO Global Atmosphere Watch Programme shows that globally averaged surface mole fractions for CO2, methane (CH4) and nitrous oxide (N2O) reached new highs in 2015, with CO2 at 400.0 ± 0.1 ppm, CH4 at 1 845 ± 2 parts per billion (ppb) and N2O at 328.0 ± 0.1 ppb. These values constitute, respectively, 144%, 256% and 121% of pre industrial (before 1750) levels. Comprehensive globa
later in 2017. The increase of CO2 from 2014 to 2015 was larger than that observed from 2013 to 2014. The green house gases have direct correlations with the rise in temperature. The temperature is ris
where it hurts the ecosystem most. The roof of the world that is what Tibet has long been known as is also heating up. The rain
region’ particularly India. T average.
average by almost one and a quarter (1.22) degrees Celsius (C) per deca
summer. Varied temperatures across different regions within and near the Arctic Circle have been observed. Average temperature trends increased by one
half a degr
Peninsula has been one of the most rapidly warming parts of the planet. This warming is not only restricted to the land but can also be noted in the Southern
Antarctic Peninsula have increased over 1°C since 1955. Deforestation is also a serious issue and carbon sink is being lost in the process of development. Over the past 25 years the world’s forest area ha
from 4.1 billion ha to just under 4 billion ha, a decrease of 3.1 percent. The green house gases already present in the atmosphere are good enough to keep earth being warmed for hundred years to come even if their emission is brought to zero lev
Copyright©2017, Uma Shanker Singh. This is an open access article distributed under the Creative Commons Att use, distribution, and reproduction in any medium, provided the original work is properly cited.
INTRODUCTION
Human activities contribute to climate change by causing changes in Earth’s atmosphere in the amounts of greenhouse gases, aerosols (small particles), and cloudiness. The largest known contribution comes from the burning of fossil fuels, which releases carbon dioxide gas to the atmosphere. Greenhouse gases and aerosols affect climate by altering incoming solar radiation and out-going infrared (thermal) radiation that are part of Earth’s energy balance. Ch
atmospheric abundance or properties of these gases and particles can lead to a warming or cooling of the climate system.
*Corresponding author: Uma Shanker Singh, Ph.D Indian Forest Service 3/184, Vibhav khand, Gomtinagar, Lucknow, Uttarpradesh, India.
ISSN: 0975-833X
Article History:
Received 25th February, 2017 Received in revised form 18th March, 2017 Accepted 26th April, 2017 Published online 19th May,2017
Key words:
Climate Change, Antarctica, Deforestation, Carbon Sink, Green House Gases.
Citation: Uma Shanker Singh, 2017. “Global warming continues unabated
RESEARCH ARTICLE
GLOBAL WARMING CONTINUES UNABATED
*Uma Shanker Singh
3/184, Vibhav khand, Gomtinagar, Lucknow, Uttarpradesh, India
ABSTRACT
The year 2016 was the warmest on record in all major global surface temperature datasets, although, in some, the difference between 2016 and the second warmest year, 2015, was within the margin of uncertainty. In the three dataset used by WMO, 2016 was 0.83 °C +/− 0.1 0°C warmer than the average for the 1961–1990 reference period (0.52 °C above the 1981–2010 average), 0.06 °C above the previous highest value set in 2015. This is also about 1.1 °C above the pre-industrial period. The ERA
ataset3 was even warmer, with global mean temperatures 0.62 °C above the 1981
°C warmer than those of 2015. The concentration of green house gases have also multiplied manifold in the last couple of decades. The World Meteorological Organization (WMO) 2016 in its Statement on the State of the Global Climate states that the latest analysis of observations from the WMO Global Atmosphere Watch Programme shows that globally averaged surface mole fractions for CO2, methane (CH4) and nitrous oxide (N2O) reached new highs in 2015, with CO2 at 400.0 ± 0.1 ppm, CH4 at 1 845 ± 2 parts per billion (ppb) and N2O at 328.0 ± 0.1 ppb. These values constitute, respectively, 144%, 256% and 121% of pre industrial (before 1750) levels. Comprehensive global greenhouse data for 2016 will not be available until later in 2017. The increase of CO2 from 2014 to 2015 was larger than that observed from 2013 to 2014. The green house gases have direct correlations with the rise in temperature. The temperature is ris
where it hurts the ecosystem most. The roof of the world that is what Tibet has long been known as is also heating up. The rain-maker: the Tibetan plateau influences the timing and intensity of monsoons in the region’ particularly India. The plateau’s temperature has increased by 1.3C (34.4F), three times the global average. Arctic and Antarctic regions have been warmed to a point of no return.
average by almost one and a quarter (1.22) degrees Celsius (C) per deca
summer. Varied temperatures across different regions within and near the Arctic Circle have been observed. Average temperature trends increased by one-third of 1 degree C per decade over sea ice, and they also rose half a degree C per decade over the lands of Eurasia. Over the past 50 years, the west coast of the Antarctic Peninsula has been one of the most rapidly warming parts of the planet. This warming is not only restricted to the land but can also be noted in the Southern Ocean. Upper ocean temperatures to the west of the Antarctic Peninsula have increased over 1°C since 1955. Deforestation is also a serious issue and carbon sink is being lost in the process of development. Over the past 25 years the world’s forest area ha
from 4.1 billion ha to just under 4 billion ha, a decrease of 3.1 percent. The green house gases already present in the atmosphere are good enough to keep earth being warmed for hundred years to come even if their emission is brought to zero level today.
is an open access article distributed under the Creative Commons Attribution License, which use, distribution, and reproduction in any medium, provided the original work is properly cited.
Human activities contribute to climate change by causing changes in Earth’s atmosphere in the amounts of greenhouse es, aerosols (small particles), and cloudiness. The largest from the burning of fossil fuels, which releases carbon dioxide gas to the atmosphere. sols affect climate by altering going infrared (thermal) radiation that are part of Earth’s energy balance. Changing the atmospheric abundance or properties of these gases and particles can lead to a warming or cooling of the climate
Indian Forest Service Uttarpradesh, India.
Since the start of the industrial era (about 1750), the overall effect of human activities on climate has been a warm influence. The human impact on climate during this era greatly exceeds that due to known changes in natural pro
as solar changes and volcanic eruptions. result in emissions of four principal green dioxide (CO2), methane (CH4
halocarbons (a group of gases containing fluorine, chlorine and bromine). These gases accumulate in the atmosphere, causing concentrations to increase with time. Significant increases in all of these gases have occurred in the industrial era .All of these increases are attributable to human activities.
Carbon dioxide has increased from fossil fuel use in transportation, building heating and cooling and the manufacture of cement and other goods. Deforestation
International Journal of Current Research
Vol. 9, Issue, 05, pp.50108-50117, May, 2017
INTERNATIONAL
OF CURRENT RESEARCH
Global warming continues unabated”, International Journal of Current Research
3/184, Vibhav khand, Gomtinagar, Lucknow, Uttarpradesh, India
The year 2016 was the warmest on record in all major global surface temperature datasets, although, in some, the difference between 2016 and the second warmest year, 2015, was within the margin of − 0.1 0°C warmer than the average for 2010 average), 0.06 °C above the previous highest industrial period. The ERA-Interim reanalysis ataset3 was even warmer, with global mean temperatures 0.62 °C above the 1981–2010 average and 0.18 °C warmer than those of 2015. The concentration of green house gases have also multiplied manifold in the rganization (WMO) 2016 in its Statement on the State of the Global Climate states that the latest analysis of observations from the WMO Global Atmosphere Watch Programme shows that globally averaged surface mole fractions for CO2, methane (CH4) and nitrous oxide (N2O) reached new highs in 2015, with CO2 at 400.0 ± 0.1 ppm, CH4 at 1 845 ± 2 parts per billion (ppb) and N2O at 328.0 ± 0.1 ppb. These values constitute, respectively, 144%, 256% and 121% of
pre-l greenhouse data for 2016 wipre-lpre-l not be avaipre-labpre-le untipre-l later in 2017. The increase of CO2 from 2014 to 2015 was larger than that observed from 2013 to 2014. The green house gases have direct correlations with the rise in temperature. The temperature is rising to the level where it hurts the ecosystem most. The roof of the world that is what Tibet has long been known as is also maker: the Tibetan plateau influences the timing and intensity of monsoons in the he plateau’s temperature has increased by 1.3C (34.4F), three times the global Arctic and Antarctic regions have been warmed to a point of no return. Temperatures increased on average by almost one and a quarter (1.22) degrees Celsius (C) per decade over sea ice in the Arctic summer. Varied temperatures across different regions within and near the Arctic Circle have been observed. third of 1 degree C per decade over sea ice, and they also rose ee C per decade over the lands of Eurasia. Over the past 50 years, the west coast of the Antarctic Peninsula has been one of the most rapidly warming parts of the planet. This warming is not only restricted Ocean. Upper ocean temperatures to the west of the Antarctic Peninsula have increased over 1°C since 1955. Deforestation is also a serious issue and carbon sink is being lost in the process of development. Over the past 25 years the world’s forest area has declined from 4.1 billion ha to just under 4 billion ha, a decrease of 3.1 percent. The green house gases already present in the atmosphere are good enough to keep earth being warmed for hundred years to come even if
ribution License, which permits unrestricted
Since the start of the industrial era (about 1750), the overall effect of human activities on climate has been a warming influence. The human impact on climate during this era greatly exceeds that due to known changes in natural processes, such as solar changes and volcanic eruptions. Human activities result in emissions of four principal greenhouse gases: carbon
4), nitrous oxide (N2O) and the
halocarbons (a group of gases containing fluorine, chlorine and bromine). These gases accumulate in the atmosphere, causing concentrations to increase with time. Significant increases in all of these gases have occurred in the industrial era .All of these increases are attributable to human activities.
e has increased from fossil fuel use in tation, building heating and cooling and the manufacture of cement and other goods. Deforestation
INTERNATIONAL JOURNAL OF CURRENT RESEARCH
releases CO2 and reduces its uptake by plants. Carbon dioxide is also released in natural processes such as the decay of plant matter.
Methane has increased as a result of human activities related to agriculture, natural gas distribution and landfills. Methane is also released from natural processes that occur, for example, in wetlands. Methane concentrations are not currently increasing in the atmosphere because growth rates decreased over the last two decades.
Nitrous oxide is also emitted by human activities such as fertilizer use and fossil fuel burning. Natural processes in soils and the oceans also release N2O.
Halocarbon gas concentrations have increased primarily due to human activities. Natural processes are also a small source. Principal halocarbons include the chlorofluorocarbons (e.g., CFC-11 and CFC-12), which were used extensively as refrigeration agents and in other industrial processes before their presence in the atmosphere was found to cause stratospheric ozone depletion. The abundance of chlorofluorocarbon gases is decreasing as a result of international regulations designed to
Ozone is a greenhouse gas that is continually produced and destroyed in the atmosphere by chemical reactions. In the troposphere, human activities have increased ozone through the release of gases such as carbon monoxide, hydrocarbons and nitrogen oxide, which chemically react to produce ozone. As mentioned above, halocarbons released by human activities destroy ozone in the stratosphere and have caused the ozone hole over Antarctica.
Water vapor is the most abundant and important greenhouse gas in the atmosphere. However, human activities have only a small direct influence on the amount of atmospheric water vapor. Indirectly, humans have the potential to affect water vapor substantially by changing climate. For example, a warmer atmosphere contains more water vapor. Human activities also influence water vapor through CH4 emissions, because
CH4 undergoes chemical destruction in the stratosphere,
producing a small amount of water vapor.
Aerosols are small particles present in the atmosphere with widely varying size, concentration and chemical composition. Some aerosols are emitted directly into the atmosphere while others are formed from emitted compounds. Aerosols contain both naturally occurring compounds and those emitted as a result of human activities. Fossil fuel and biomass burning have increased aerosols containing sulphur compounds, organic compounds and black carbon (soot). Human activities such as surface mining and industrial processes have increased dust in the atmosphere. Natural aerosols include mineral dust released from the surface, sea salt aerosols, biogenic emissions from the land and oceans and sulphate and dust aerosols produced by volcanic eruptions.
Rise in temperature
Instrumental observations over the past 157 years show that temperatures at the surface have risen globally, with important regional variations. For the global average, warming in the last century has occurred in two phases, from the 1910s to the 1940s (0.35°C), and more strongly from the 1970s to the
present (0.55°C). An increasing rate of warming has taken place over the last 25 years, and 11 of the 12 warmest years on record have occurred in the past 12 years. Above the surface, global observations since the late 1950s show that the troposphere (up to about 10 km) has warmed at a slightly greater rate than the surface, while the stratosphere (about 10– 30 km) has cooled markedly since 1979. This is in accord with physical expectations and most model results. Confirmation of global warming comes from warming of the oceans, rising sea levels, glaciers melting, sea ice retreating in the Arctic and diminished snow cover in the Northern Hemisphere.
Recently the World Meteorological Organization (WMO) has issued a report on the global climate titled “WMO Statement on the State of the Global Climate in 2016”which states about the change in global temperature, carbon dioxide concentration in the atmosphere etc over a period of time and this has been observed that the year 2016 was the warmest on record in all major global surface temperature datasets, although, in some, the difference between 2016 and the second warmest year, 2015, was within the margin of uncertainty. In the three dataset mean2 used by WMO, 2016 was 0.83 °C +/− 0.1 0°C warmer than the average for the 1961–1990 reference period (0.52 °C above the 1981–2010 average), 0.06 °C above the previous highest value set in 2015. This is also about 1.1 °C above the pre-industrial period. The report further finds that the ERA-Interim reanalysis dataset3 was even warmer, with global mean temperatures 0.62 °C above the 1981–2010 average and 0.18 °C warmer than those of 2015. It was found to be the warmest year on record for both land areas and oceans and in northern and southern hemispheres. The five- and ten-year mean temperatures also reached their highest values on record, with 2012–2016 and 2007–2016 respectively being 0.65 °C and 0.57 °C above the 1961–1990 average (0.34 °C and 0.26 °C respectively above the 1981–2010 average). Each of the 16 years since 2001 has been at least 0.4 °C above the 1961–1990 average, a mark which, prior to 2001, had only been reached once, in 1998. The report further observes that global temperatures continue to be consistent with a warming trend of 0.1 °C to 0.2 °C per decade and this is very worrisome part from global warming point of view. Differences between datasets largely reflect their areal coverage. With warmth in 2016 being especially pronounced in data-sparse regions of the Arctic, the difference between 2015 and 2016 values is greatest in those datasets which either represent the full Arctic (ERA-Interim reanalysis of the European Centre for Medium Range Weather Forecasts) or extrapolate station data over long distances (GISTEMP dataset produced by the US National Air and Space Administration.
Unusual hot summer in 2017
likely to be more than 1°C above normal. The IMD further stated that the deviation from the normal temperature would reduce progressively while moving towards the southern regions of the country. It said there was “47 per cent probability” of maximum temperatures being more than normal in the states of Punjab, Himachal Pradesh, Uttarakhand, Delhi, Haryana, Rajasthan, Uttar Pradesh, Gujarat, Madhya Pradesh, Chhattisgarh, Bihar, Jharkhand, West Bengal, Odisha and Telangana, and a few other regions. It warned that these areas were likely to experience “above normal moderate to severe heat wave conditions” during this period. This has been further predicted that “border line” to “weak” La Nina conditions was currently prevailing over the Pacific Ocean and these were likely to weaken further and become neutral ahead of the monsoon season. As such, the sea surface temperatures in the Pacific Ocean were unlikely to have any influence on the summer temperatures over the country, it said. Averaged over all land and ocean surfaces, temperatures have warmed roughly 1.33°F (0.74ºC) over the last century, according to the Intergovernmental Panel on Climate Change (IPCC's Climate Change 2007: Synthesis Report Summary for Policymakers) . More than half of this warming, about 0.72°F (0.4°C) has occurred since 1979. Because oceans tend to warm and cool more slowly than land areas, continents have warmed the most (about 1.26°F or 0.7ºC since 1979), especially over the Northern Hemisphere. Global warming is now 0.6°C in the past three decades and 0.8°C in the past century. James Hansen (2006) in his paper Global temperature change says that, ‘’It is no longer correct to say most global warming occurred before 1940. A better summary is: slow global warming, with large fluctuations, over the century up to 1975, followed by rapid warming at a rate ≈0.2°C per decade. Global warming was ≈0.7°C between the late 19th century (the earliest time at which global mean temperature can be accurately defined) and 2000, and continued warming in the first half decade of the 21st century is consistent with the recent rate of +0.2°C per decade.’’
Trends in global co2 emission
The history of gaseous composition in the atmosphere is very important to understand as this has lot many things to say. The atmospheric history is known to us for the last 4.5 million years and the earlier secondary atmosphere is supposed to contain oxygen, carbon dioxide, methane, carbon monoxide, water vapor and a little of hydrogen and nitrogen. In Precambrian age the sun’s luminosity was 28% low compared to today’s intensity. Oxygen was also very low and it constituted 1%, its concentration began to rise only about 2 billion years ago and reached to the level of 15-20% only in proterozoic era. Phanerozoic and Cenozoic age is closely associated with high concentration of carbon dioxide which started to lower down in second half of Cenozoic age and came to the present day value by the plestocene. (Borzenkova and Turchinovich 2009) The first decade of the new millennium has witnessed unprecedented increases in emissions reflecting ongoing high levels of energy usage for heat, electricity and transport within Annex 1 nations coupled with the very rapid industrialization of many non-Annex 1 nations, particularly China and India. Total cumulative emissions produced by nations that underwent industrialization in the nineteenth century and first half of the twentieth century will be eclipsed if the five billion people currently resident in non-Annex 1 nations remain or become locked into a fossil fuel economy. The World Meteorological Organization (WMO) 2016 in its
Statement on the State of the Global Climate states that the latest analysis of observations from the WMO Global Atmosphere Watch Programme shows that globally averaged surface mole fractions for CO2, methane (CH4) and nitrous
oxide (N2O) reached new highs in 2015, with CO2 at 400.0 ±
0.1 ppm, CH4 at 1 845 ± 2 parts per billion (ppb) and N2O at
328.0 ± 0.1 ppb. These values constitute, respectively, 144%, 256% and 121% of pre-industrial (before 1750) levels. Comprehensive global greenhouse data for 2016 will not be available until later in 2017. The increase of CO2 from 2014 to
2015 was larger than that observed from 2013 to 2014 and that averaged over the past 10 years, despite no significant change in emissions from fossil-fuel 11 Sea-level measurements are transitioning to a new satellite and full 2016 data from the merged dataset will be available later in 2017. M. Venkataramanan et al. (2011) in his article’’ Causes and effects of global warming claims that Over the last 100 years’’, the average air temperature near the Earth’s surface has risen by a little less than 1 degree Celsius or 1.3 degrees Fahrenheit. Deforestation increases the severity of global warming. The ocean is a huge carbon sink, holding about 50 times as much carbon as the atmosphere. The oceans are no longer able to store carbon as they have in the past. Burning fossil fuels such as natural gas, coal, oil and gasoline raises the level of carbon dioxide in the atmosphere, and carbon dioxide is a major contributor to the greenhouse effect and global warming. The impact of climate change is visible on our living pattern and in our ecosystem as well. We are losing our priceless biodiversity very fast and we do not yet how much we have lost till today in term of their numbers and their generic value. The global
Living Planet Index (LPI) 2014 shows an overall decline of 52 per cent between 1970 and 2010. Due to changes in across biomes, this percentage has decreased considerably in comparison with previous publications. Falling by 76 per cent, populations of freshwater species declined more rapidly than marine (39 per cent) and terrestrial (39 per cent) populations. The most dramatic regional LPI decrease occurred in South America, followed by the Asia pacific region. In land-based protected areas, the LPI declined by 18 per cent, less than half the rate of decline of the overall terrestrial LPI.
Relationship of carbon dioxide emission with the rise in temperature
Inone of the study On the Relationship between Atmospheric Carbon Dioxide and Global Temperature this was found that the global Earth’s temperature follows the trend in the atmospheric CO2 before the period of the climate hiatus. However, it was observed that the trends are not in phase during the hiatus when the heat trapped by the atmospheric CO2 goes mostly into the ocean. This is supported by comparison of the CO2 trend with the trend in the ocean heat content. The phase relationships are found to be chaotic on shorter time scales than the annual time scale. On the annual time scale, the atmospheric CO2 changed in anti-phase with the global temperature anomaly changes in the time period from 1986 to 2008 except for the end of it. This relationship was reversed in 1979 and after 2010 when CO2 and
since the 19th Century the human emissions are the main cause of the global warming over the past 150 years. Since human emissions are the cause of the global warming, reducing emissions will reduce the amount of warming in the future (Michael J. Ring, 2012).
Global warming potential of green house gases
Other GHGs contribute more to global climate change than CO2 on a per-unit basis, although their relative impacts vary
with time. The global warming potential (GWP) of a given GHG expresses its estimated climate impact over a specific period of time compared to an equivalent amount by weight of carbon dioxide. For example, the current 100-year GWP for N2O is 296, which indicates that one ton of N2O will have the
same global warming effect over 100 years as 296 tons of CO2.
Internationally-agreed GWP values are periodically adjusted to reflect current research on GHGs' behavior and impacts in the atmosphere. However; CO2 is still the most important
greenhouse gas because it is emitted in far larger quantities than other GHGs. Atmospheric concentrations of CO2 are
measured in parts per million, compared to parts per billion or per trillion of other gases, and CO2's atmospheric lifetime is 50
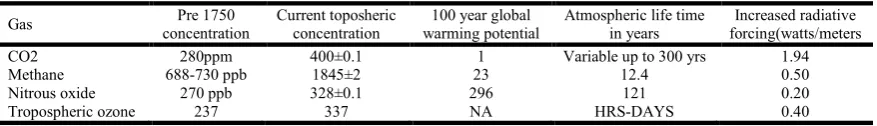
to 200 years, significantly longer than most GHGs. As illustrated in Table 1, the total extent to which CO2 has raised global temperature (referred to as radiative forcing and measured in watts per square meter) since 1750 is significantly larger than forcing from other gases (IPCC 2014).
Warming is across the global landscape Tibet
Tibet Autonomous Region is located at longitude 78°25'-99°06' east and latitude 26°44'- 36°32' north on the southwest border of China and covers the majority of the Qinghai-Tibet Plateau. Bordering India, Bhutan, Nepal and Sikkim to the south and the west, Yunnan Province to the southeast, Sichuan Province to the east with Qinghai Province and Xinjiang Uygur Autonomous Region to the north. Tibet is the second largest region in China (after Xinjiang Uygur Autonomous Region), occupying a total area of over 1,200,000 sq.km, at an average altitude of more than 4,000m. The roof of the world that is what Tibet has long been known as. The phrase conjures up images of summits, with their mountain peaks, glaciers, permafrost and the nomads who live on the land. A roof is also symbolic of a home, and is the structure that protects the entire ecosystem but today the roof is structurally compromised. Tibet’s glaciers are melting, and this needs to be protected. Its permafrost is degrading, and needs to be taken care of. Tibet is suffering from massive deforestation and damming projects, and requires immediate relook into those projects. It is an environmentally strategic area and its importance to the sustainability of the world’s fragile ecosystem cannot be understated. Tibet is the world’s highest and largest plateau, but in addition to being the “roof of the world”, here are a few other equally suitable epithets. The third pole: the Tibetan
plateau has 46,000 glaciers, making it home to the third largest concentration of ice after the south and north poles. The water tower of Asia: the Tibetan plateau is the head source of Asia’s six largest rivers. These waters are a critical resource to the more than 1.3 billion people in the world’s 10 most densely populated nations surrounding the plateau. The rain-maker: the Tibetan plateau influences the timing and intensity of monsoons in the region. The plateau’s temperature has increased by 1.3C (34.4F), three times the global average. Glaciers on the Tibetan plateau are melting at a rate of 7% annually and if the current rate continues, two-thirds of the glaciers on the plateau will be gone by 2050. The alpine permafrost, critical for the health of the planet, is at serious risk. On the Tibetan plateau, the permafrost stores more than 12,300m tones of carbon and 10% of this permafrost Glaciers on the Tibetan plateau is also melting at a rate more than 7% annually. In A Preliminary Study of the Heating Effect of the Tibetan Plateau a time series data on Temperature was collected from Tibetan Plateau and studied in detail and it was found that the immense and towering Tibetan Plateau acts as a heating source and, thus, deeply shapes the climate of the Eurasian continent and even the whole world. In the study climate data was collected in between 2001 to 2007 from 109 observation stations and its mean temperature data was analyzed and compared with the neighboring Sichuan Basin, and a correlation and simple linear regression was derived to reveal the altitudinal pattern of temperature.
The data then derived at according to the linear relationships of temperature and altitude for each month, it was compared with air temperature differences on the same elevation between the main plateau and surrounding mountains and the Sichuan Basin so as to quantify the heating effect and then an inference on its implication on timberline of the plateau was drawn. The results showed that
The heating effect of the plateau is significant. The temperature of the main plateau area was higher than that of free air on the same elevation above the neighboring areas; on the elevation of 4500 m (the main plateau), temperature is 1–6°C higher in the main Plateau than over the Sichuan Basin for different months and 5.9–10.7°C higher than in the Qilian Mountains in the northeastern corner of the plateau. Even at altitudes of 5000–6000 m in the main Plateau,
there are 4 months with a mean temperature above 0°C. The mean temperature of the warmest month (July) can reach 10°C at about 4600–4700 m. This may help explain why the highest timberline in the northern hemisphere is on the southeastern Tibetan Plateau. (Yonghui Yao, 2013)
[image:4.595.79.518.408.471.2]The glaciers are the best indicators of global warming and there are about 46000 glaciers in Tibet and they are widely distributed. In yet another study on Remote Sensing of Glacier
Table 1. Current greenhouse gas
Gas concentration Pre 1750 Current toposheric concentration warming potential 100 year global Atmospheric life time in years forcing(watts/meters Increased radiative
CO2 280ppm 400±0.1 1 Variable up to 300 yrs 1.94
Methane 688-730 ppb 1845±2 23 12.4 0.50
Nitrous oxide 270 ppb 328±0.1 296 121 0.20
Change in the Central Qinghai-Tibet Plateau and the Relationship with Changing Climate in Tibet plateau it was found that glaciers are receding. In the study carried out by the researchers, glaciers over the Qinghai-Tibet Plateau (QTP) have been analyzed in particular as it represent important freshwater reserves and the melt water feeding many major rivers of Asia. This study examined the area and thickness change of glaciers in the Dongkemadi (DKMD) region over central QTP by exploring all available Landsat images from 1976 to 2013 and satellite altimetry data over 2003–2008, and then analyzed the relationships between glacier variation and local and macro scale climate factors based on various remote sensing and re-analysis data. Results show that the variation of glacier area over 1976–2013 is characterized by significant shrinkage at a linear rate of 0.31 to 0.04 km2 per year. Glacier retreat slightly accelerated in the 2000s, and the mean glacier surface elevation lowered at a rate of 0.56 m per year during 2003–2008 (Linghong Ke et al., 2017). Lying 4,700m above sea level on the Tibetan plateau is Namtso Lake. As one of the largest lakes on the plateau, Namtso is fed partly by run-off from the region's glaciers, which also acts as a store of water for the surrounding grasslands. Between the years 2000 and 2014, Namtso expanded by an area of around 50km2, a consequence of ever increasing glacier melting triggered by some of the fastest temperature rises on the planet. Glaciers in the Tibetan Autonomous Region have shrunk by 15% over the past 30 years. Annual run-off from glaciers rose from 61.5bn m3 to 79.5bn C3 during the same period. The glaciers both in the Himalayan region and glaciers in the northern plateau region are melting must faster than 30 -40 years ago. In the last 20 years, some of the small glaciers have disappeared. It has been estimated that if melting continues at current levels, two-thirds of the plateau's glaciers will likely to be gone by 2050, potentially affecting up to two billion people in China, India, Pakistan, Bangladesh and Bhutan.
Climate change in arctic region
The Arctic is named for the north polar constellation “Arktos” Greek for “bear.” It is 14.5 million square km (5.5 million square miles), almost exactly the same size as Antarctica and has been inhabited by humans for close to 20,000 years. It consists of the ice-covered Arctic Ocean and surrounding land, including all of Greenland and Spitsbergen, and the northern parts of Alaska, Canada, Norway, and Russia. Its boundary is defined by either the northern limit of stands of trees on land (the tree line), or the Arctic Circle, an imaginary line of latitude located at 66 degrees 33 minutes North. North of this line, the sun never sets on the summer solstice (June 21st). The average July temperature remains ~10°C (50°F). Some of the land parts of the Arctic, like Greenland, are covered with ice sheets; others, like Alaska, have lush tundra. These areas have large mammals, such as caribou, bears, wolves and foxes, and a variety of plants. In summer, migratory birds and other wildlife come to the Arctic to raise their young. The Arctic is the northernmost region of Earth. The Arctic is almost entirely covered by water, much of it frozen. Some frozen features, such as glaciers and icebergs, are frozen fresh water. In fact, the glaciers and icebergs in the Arctic make up about 20% of Earth’s supply of freshwater. Sea ice helps determine Earth’s climate. Sea ice has a very bright surface, or albedo. This albedo means about 80% of sunlight that strikes sea ice is reflected back to space. The dark surface of the liquid ocean, however, absorbs about 90% of solar radiation. Due to thermohaline circulation, the Arctic’s thick, reflective sea
ice moderates ocean temperatures around the world. When compared to longer- term, ground-based surface temperature data, the rate of warming in the Arctic from 1981 to 2001 is eight times larger than the rate of Arctic warming over the last 100 years. There have also been some remarkable seasonal changes. Arctic spring, summer, and autumn have each warmed, lengthening the seasons when sea ice melts by 10 to 17 days per decade. Temperatures increased on average by almost one and a quarter (1.22) degrees Celsius (C) per decade over sea ice in the Arctic summer. Varied temperatures across different regions within and near the Arctic Circle have been observed. Average temperature trends increased by one-third of 1 degree C per decade over sea ice, and they also rose half a degree C per decade over the lands of Eurasia. Temperatures over North America experienced the highest regional warming, increasing by 1.06 degrees C per decade.
Greenland cooled by less than one-tenth of a degree C per decade. The cooling found over Greenland was mainly at high elevations, while warming trends were observed around its periphery. Provisional satellite data produced by the US National Snow & Ice Data Centre shows there were just over 11.1 million square kilometers of sea ice on 1 June this year, compared to the average for the last 30 years of nearly 12.7 million square kilometers. This difference is more than 1.5 million square kilometers is about the same size as about six United Kingdom’s. Over the period of modern satellite observations, Arctic sea-ice extent at the end of the melt season (September) has declined at a rate of >11% per decade, and there is evidence that the rate of decline has accelerated during the last decade. While climate models project further decreases in sea ice.
The economic significance of a seasonally sea-ice-free future Arctic, the increased connectivity of a warmer Arctic with changes in global climate, and large uncertainties in magnitude and timing of these impacts make the problem of rapid sea-ice loss in the Arctic a grand challenge of climate science. (Vladimir M. Kattsov, 2010) Arctic is changing and increasingly drawing the world’s interest. The arctic rim countries are looking Arctic as a measure commercial venture without fully understanding what will happen to many poor and developing economies in the world. They understand that the opening of the Arctic is the greatest event in human history since the coming of the ice age. In their view the exploitation of the Arctic will open a whole new ocean for human activity and knowledge, with the region’s vast energy, mineral and marine resources fueling technological innovations no less revolutionary than the impact of the discovery of the Pacific on the Old World. The importance of this region in terms of climate change, world fisheries, new transportation corridors, and prospects for growing economic activity as the sea ice melts in response to rising CO2 emissions, will not only doom
The five Arctic coastal states the United States, Canada, Russia, Norway, and Denmark (of which Greenland is a territory) have made or are in the process of preparing submissions to the Commission on the Limits of the Continental Shelf regarding the outer limits of their extended continental shelves. Changes to the Arctic brought about by warming temperatures will likely allow more exploration for oil, gas, and minerals. Warming that causes permafrost to melt could pose challenges to onshore exploration activities. Increased oil and gas exploration and tourism (cruise ships) in the Arctic increase the risk of pollution in the region (Ronald O'Rourke, 2017). These factors have spurred the Arctic coastal states to support offshore oil and gas development, and the region is experiencing other growing commercial interest and activity. However, Changes in the Arctic can influence the global climate through three major mechanisms:
The amount of the sun’s energy reflected back to space decreases as snow and ice melt, leading to a more intense surface warming.
The melting of Arctic ice and increased regional precipitation can add freshwater to the oceans, and potentially affect ocean currents in the North Atlantic. As warming progresses, more greenhouse gases could
be released into the atmosphere by the thawing of the permafrost. However, warming can increase biological growth, and thus absorption of CO2.
By 2100, melting of Arctic glaciers alone will have contributed to a sea level rise of roughly 5 cm out of the projected 10-90cm total rise for this century.Melting of the Greenland ice sheet may increase this number significantly. Access to Arctic resources is likely to be affected by climate change, including: wildlife, such as whales, seals, birds, and fish sold on world markets; and oil, gas and mineral reserves. Arctic ecosystem changes will have an impact on a global scale, notably by affecting migratory species’ summer breeding and feeding grounds. Many countries are currently developing new research strategies and committing significant financial resources to expanding national research activities in the Arctic. This is not only the case for Arctic rim countries, but also for distant countries such as China, India or South Korea. The Arctic is also receiving more attention from the EU (“Arctic Communication”) and the International Council for Science (“Grand Challenges in Global Sustainability Research”). However, some additional efforts are needed to master the tasks raised by the rapid changes in the Arctic as below
To observe the changes in the Arctic in more detail To measure the feedback effects of polar and global
processes in the Earth system and
To improve prediction models. (Rapid Climate Change in the Arctic 2015)
Antarctica is also warnings
Antarctica is unique among the continents for being almost totally covered by glacier ice. Although this ice cover in its entirety is often referred to as a single ice sheet (the Antarctic Ice Sheet), there are in fact two major areas of ice which differ from each other in both their physical characteristics and history: the East and West Antarctic Ice Sheets. The East Antarctic Ice Sheet is both larger and thicker than the West Antarctic Ice Sheet, as well as being much older. At
14,000,000 square kilometers (5,400,000 square miles), it is the fifth-largest continent. For comparison, Antarctica is nearly twice this size of Australia. About 98% of Antarctica is covered by ice that averages 1.9 km (1.2 mi; 6,200 ft) in thickness, extending to all but the northernmost reaches of the Antarctica peninsula. The continent itself is not centered over the South Pole, and instead, the greater portion of Antarctica lies within the Eastern Hemisphere (as defined by the Prime Meridian). The West Antarctic Ice Sheet occupies a smaller area of land within the Western Hemisphere and is flanked by the Weddell Sea on one side and the Ross Sea on the other. The Transantarctic Mountains extend across the continent forming a convenient physical boundary to demarcate East Antarctica (or Greater Antarctica) from West Antarctica (or Lesser Antarctica). Most of Antarctica is south of the Antarctic Circle, with the exception of parts of the East Antarctic coastline and the Antarctic Peninsula which extends northwards from West Antarctica to about 63°S. In addition to the continental land mass, Antarctica has several large and small islands; for example, the South Shetland Islands just north of the Antarctic Peninsula. Some of Antarctica’s islands are permanently linked to the mainland by ice, whereas others are connected only seasonally in step with the pattern of sea ice expansion and retreat. Much of the continent’s coastline is fringed by ice shelves.
continent and Southern Ocean are sentinels for the rest of the world on the impacts of ocean acidification and global warming.
Changes in the Antarctic physical environment
Esperanza Station on the Antarctic Peninsula has recorded what may be the highest temperature ever observed on the Antarctic continent. On March 24 2015 a temperature of 17.5° C was measured, beating the previous record of 17.1° C, also recorded at Esperanza, on April 24, 1961. The new record occurred during a period of warm, maritime north-westerly airflow arriving at the Peninsula, with an increase in the temperature as a result of the Foehn effect as the air crossed the Peninsula. The 2015 Antarctic ozone hole was relatively large compared to holes from the past 35+ years (Paul Krummel, Paul Fraser and Nada Derek, 2016). In terms of total area, the 2015 hole set new daily records from October to mid-November. A number of recent papers have highlighted that temperature and precipitation change over the Antarctic continent is very closely tied to conditions of the surrounding sea ice and ocean surface temperature (Bracegirdle et al., 2015; Krinner et al., 2014; Schmithusen et al., 2015). Key implications of this are that reliable reconstructions of sea ice in the past, and climate model projections into the future, are of central importance to reconstructing past and predicting future climate conditions over the Antarctic continent. The latest palaeo climate analyses from sediment cores collected from the Southern Ocean show that during the last glacial period carbon storage in sediments was greatly amplified, which caused bottom waters to become less well oxygenated (Jaccard et al., 2016). During the last deglaciation a decrease in the supply of dust to the Southern Ocean surface reduced the supply of the limiting nutrient Fe, hence reducing productivity, which in turn reduced the oceanic entrapment of CO2 by
plankton, hence reducing ocean carbon storage and encouraging an increase in global atmospheric CO2 and an
increase in the oxygenation of bottom waters. A new ocean-atmosphere-ice climate model applied by scientists from the Alfred Wegener Institute suggests that exceeding critical temperature limits in the Southern Ocean may cause the marine-based West Antarctic Ice Sheet to collapse, as it appears to have done during the last warm interglacial 125,000 years ago, when polar temperatures were about 2° C warmer than today, causing a sharp rise in sea level (Sutter et al., 2016).
The time frame for such a collapse, if global warming continues under the ‘business-as-usual ‘scenario of the IPCC, is around 1,000 years. The model suggests that the first stage of the collapse involves retreat of the ice shelves that buttress the glaciers draining the hinterland. In the second phase those glaciers discharge rapidly into the ocean, draining the inland ice. The resulting rise in sea level accentuates the process. Estimating how much decay of the Antarctic ice sheet will contribute to sea level rise in the future is a very active area of research. A key unknown is the dependence of sliding on basal friction. (Ritz et al., 2015) doubted the previous estimates of maximal loss of up to 1 m by 2100 and around 1.5 m by 2200, and suggested they were implausible under current understanding of physical mechanisms and potential triggers. That conclusion appeared to be supported by new findings from the application of coupled sea-level and ice sheet models by Gomez et al. (2015), who found that ice retreat tends to be accompanied by a rise in bedrock elevation and a lowering of
sea-level close to the ice sheet (because of gravitational effects – glacial isostatic adjustment), thus tending to keep the ice sheet stable. These processes tend to work best where global warming forecasts are low. With fast warming, the slow process of glacial isostatic adjustment cannot keep up with rapid rates of loss of ice. However, a recent study by DeConto and Pollard (2016) used a model coupling ice sheet and climate dynamics including previously underappreciated processes linking atmospheric warming with hydro fracturing of buttressing ice shelves and structural collapse of marine terminating ice cliffs that is calibrated against Pliocene and Last Interglacial sea-level estimates and applied this to future greenhouse gas emission scenarios. They estimated that Antarctica has the potential to contribute more than a meter of sea-level rise by 2100 and more than 15 meters by 2500, if emissions continue unabated.
In this case, atmospheric warming will soon become the dominant driver of ice loss, but prolonged ocean warming will delay its recovery for thousands of years. Another model by Golledge et al. (2015) suggests that unless anthropogenic greenhouse-gas emissions are reduced to half of 1990 levels by 2050, global mean annual surface temperatures are likely to exceed 2° C above pre-industrial values by 2100 leading to a sea level rise of around 1 m, which is at the upper end of current IPCC estimates. With further warming the future contribution to a rise in sea level from Antarctica is substantial, because collapse of buttressing ice shelves leads to a dynamic ice-sheet response that greatly increases grounded ice discharge for hundreds to thousands of years into the future. In the model, ice-shelf stability is vulnerable to a critical temperature threshold. Prolonged ocean warming of 0.5° C above present, together with atmospheric warming of 2° C, leads to the loss of 80% to 85% of all floating ice in Antarctica. High emission scenarios lead to ice loss from Antarctic that will raise sea level by 0.6–3 m by the year 2300.“In the scenarios in which ice shelves are lost, the long-term contribution of the Antarctic ice sheet to global sea-level rise ranges from roughly 3 to 9 m. (Robel, 2015).
Global forest change
Over the past 25 years the world’s forest area has declined from 4.1 billion ha to just under 4 billion ha, a decrease of 3.1 percent. The rate of global forest area net loss has slowed by more than 50 percent between the periods 1990–2000 and 2010–2015.This is a result of a combination of reduced forest area loss in some countries and increased gains in others. It appears that net forest area change has stabilized over the past decade. The largest proportion of the world’s forests is found in high-income countries, followed by upper-middle, lower-middle and low-income countries. This is also true for the area of natural and planted forest.
Table 2. Global change of forests
Annual net change
Year
Forest (Thousand
hectare)
Period
Area (Thousand
hectare)
Rate of change (%) 1990 4128269
2000 4055602 1990-2000 -7267 -0.18 2005 4032743 2000-2005 -4572 -0.11 2010 4015673 2005-2010 -3414 -0.08 2015 3999134 2010-2015 -3308 -0.08 Source: Global Forest Resources Assessment 2015
Change in the boreal and temperate domains has been gradual, while decline in the tropics has not – per capita forest area has nearly halved over the last 25 years. In the subtropics it has declined by over 35 percent. The Table-10 shows a global change in Forest area. The change is systematically designed as globally, natural forest area is decreasing and planted forest area is increasing. As of 2015 reported natural forest accounts for 93 percent of total forest area. The global annual net loss of natural forests decreased from some 10.6 million ha in the 1990s to 6.5 million ha between 2010 and 2015.
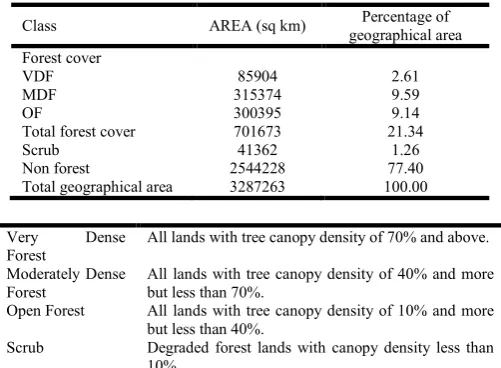
Forest cover change in India
The forest cover includes all lands which have a minimum area of one hectare and have a tree canopy density of 10% and above irrespective of ownership and legal status including orchards, palm, bamboo etc. The forest area is different as defined earlier. The total recorded forest area in the country is 769,538 sq km which constitutes 23.41% of the total geographical area. The total forest cover of the country is estimated to be
Table 3. Forest cover of India
Class AREA (sq km) Percentage of
geographical area Forest cover
VDF 85904 2.61
MDF 315374 9.59
OF 300395 9.14
Total forest cover 701673 21.34
Scrub 41362 1.26
Non forest 2544228 77.40
Total geographical area 3287263 100.00
Very Dense Forest
All lands with tree canopy density of 70% and above.
Moderately Dense Forest
All lands with tree canopy density of 40% and more but less than 70%.
Open Forest All lands with tree canopy density of 10% and more but less than 40%.
Scrub Degraded forest lands with canopy density less than 10%.
Source- ISFR 2015, Forest Survey of India, Ministry of Environment, Forest and Climate Change
701,673 sq km which comes to around 21.34% of the geographical area of the nation and the total tree cover of the country as per the assessment is estimated to be 92,572 sq km which constitutes 2.82% of the geographical area. If we add up both forests cover and tree cover of the country it comes to 24.16% of the total geographical area. There has been an estimated increase of 3,775 sq km in the forest cover of the country as compared to 2013 assessment (ISFR 2015). Out of the 29 states and 7 union territories (UT) 24 states and 4 UTs have shown decline in forest cover and there is a huge decline in MDF and it is to the tune of (-) 3913 sq km (here only losses
have been added up).There has been a decline in very dense forest (VDF) also to the tune of (-) 201 sq km and so has open forest to the level of (-) 690 sq km. ISFR,( 2015) calculates losses on the basis of gains, if the country gains 10 sq km and loses 6 sq km then it gains +4 sq km which is wrong in its totality. Forest ecosystem does not work like the flow of CO2 which does not know countries or state’s boundaries and transcends them without any obstruction; on the contrary loss of forest at one place or deforestation in one dense forest triggers the declining trend in the entire ecosystem and remains unstoppable until very drastic measures are taken to contain it. In the hill states the losses are very dangerous and dreadful. The losses in VDF, MDF and OF are (-) 177, (-) 1335 and (-) 326 square kilo meters respectively and mostly the reasons for the deforestation and degradation are shifting cultivation, deforestation, biotic pressure and theft of timber etc. The level of deforestation at different altitudes in the country is also alarming.
The minimum losses (-62 sq km ) have been in the altitude of above 4000 meter and maximum decline in the forest cover is estimated to be in the range of (-) 279 sq km in between the altitudinal range of 2000-3000 meter. The country needs to address the issue deforestation very seriously and the beginning has to be made by creating a database on deforestation, degradation of forest and decline in the forest ecosystem. We have to stop the diversion of forest land for political purposes and the data on the forest land should be made available in the public domain inviting public criticism so that corrective measures could be taken immediately if some wrong has been committed. We don’t know yet as to what is the rate of deforestation at the national level, the information system is completely opaque. As a country the information is not available with us as to what is the level of forest cover in the forest area and it needs immediate attention of the forest bureaucracy. Different studies have been carried out with the data available to find out the level of deforestation. In one of the study this has been found out that the current estimate of gross deforestation in India is quite low (–0.43%) for 2009–2011 compared to the global average of – 0.6%. Even though considerable progress has been made in the protection of forests, gross deforestation rate continues as a focal hindrance.
[image:8.595.37.288.453.637.2]extracted from the Yamuna Valley forests in the Himalayas, which in turn was necessitated because the supply of teak and sal Shorea obusta from peninsular India was getting exhausted. Wood for railway sleepers and as fuel for powering the locomotives facilitated the expansion of both the railways and the British Empire. The other major cause of deforestation immediately after independence was agricultural expansion, often state-sponsored. Much of the rich moist deciduous forests of the humid Terai region in northern Uttar Pradesh for example were cleared to provide land to immigrants from the newly created Pakistan. Most of the woodland once covering the Indo-Gangetic plains was also gradually converted to fields or grazing lands. Indeed between 1951 and 1980, according to the Forest Survey of India (1987), over 26.20 lakh hectares (26,200 sq.kms ) of forest was converted for agriculture purposes all over India.( Kothari, A. 1993).
Driving forces of deforestation
Deforestation is caused by multiple drivers and pressures, including conversion for agricultural uses, infrastructure development, wood extraction (Geist and Lambin, 2002, agricultural product prices, and a complex set of additional institutional and location-specific factors which can be extremely important in certain localities. Most importantly, the specific characteristics and magnitude of (in particular) the socioeconomic drivers behind deforestation vary widely across continents, regions and Countries. Deforestation has a wide range of appearances ranging from selective logging to complete clear-cutting of forests.
Forest as the cheapest mitigation source
In the absence of new forest conservation policies, 289 million hectares of tropical forest will be cleared from 2016-2050, an area about the size of India and one-seventh of Earth’s tropical forest area in the year 2000. It is projected that this tropical deforestation will release 169 GtCO2 to the atmosphere from
2016-2050. It is estimated that a universally applied carbon price of $20/tCO2 from 2016-2050 would avoid 41 GtCO2 of
emissions from tropical deforestation while a carbon price of $50/ tCO2 would avoid 77 GtCO2. These prices correspond to
average costs to land users of $9/tCO2 and $21/tCO2
respectively. By comparison if all tropical countries implemented anti-deforestation policies as effective as those in the Brazilian Amazon post-2004 then 60 GtCO2 of emissions
would be avoided. The analysis corroborates the conclusions of previous studies that reducing tropical deforestation is a sizable and low-cost option for mitigating climate change. Encouragingly, 89% of potential low-cost emission reductions are located in the 47 tropical countries that have already signaled their intention to reduce emissions from deforestation in exchange for performance-based finance(Jonah Busch and Jens Engelmann 2015)
Will it be possible to contain rise in temperature even if we arrest carbon dioxide emission at the present level
In December 2015, political leaders from 195 countries attending the United Nations Climate Change Conference (COP21) in Paris agreed to take action to address the causes and consequences of global climate change. Specifically, they committed to keeping the rise in average global air temperature by the end of this century to “well below 2°C above pre-industrial levels” (i.e. before 1750 and the advent of the
industrial revolution). The 350-year window between 1750 and 2100 may seem like a long time in the context of human lifespan (Clark et al. 2016). It has been argued that any increases in carbon dioxide (CO2) from human activity will
remain in the atmosphere and continue to affect Earth’s climate for tens to hundreds of thousands of years. Notwithstanding changes in air temperature, there is a time lag between rising CO2 levels and the changes in sea levels that inevitably follow (DeConto and Pollard, 2016). To understand this, it is needed to look back, not 250 years, but at least 20,000 years. Over the next 10,000 years, the global mean sea-level rise that will inevitably result from even a modest emissions scenario will reach 25 m, causing inundation of many of the world’s most densely populated coastal cities and regions, directly affecting 1.3 billion people or 19% of the global population (based on 2010 population figures). A higher, business-as usual scenario will result in a global mean sea-level rise of 52 m, with even more devastating effects. With this much longer timeframe in mind, Clark et al. stated that the real consequences of unchecked CO2 emissions will be
“large-scale and potentially catastrophic climate change.” The authors also emphasize the magnitude and urgency of the response that is needed. The only effective response is to move as rapidly as possible towards the complete decarbonization of the world’s energy systems by targeting net zero or negative carbon emissions Most of the green house gases have very long life cycle as shown in table 1 therefore, whatever emissions we have will be more than enough to keep temperature rising for hundreds and thousands of years. The Copenhagen Accord reiterates the international community’s commitment to ‘hold the increase in global temperature below 2 degrees Celsius’. Yet its preferred focus on global emission peak dates and longer-term reduction targets, without recourse to cumulative emission budgets, belies seriously the scale and scope of mitigation necessary to meet such a commitment. (Kevin Anderson, 2017).
REFERENCES
Borzenkova, I. I. and I. Ye, 2009. Turchinovich Environmental structure and function: climate system – Vol. II - History of Atmospheric Composition (published by EOLSS publisher co. Ltd, oxford, United Kingdom, copy right.
Bracegirdle, T. J., D.B Stephenson, T. Phillips, and J.Turner, 2015. The importance of sea-ice extent biases in 21st century multi-model projections of Antarctic temperature and precipitation ; Geophysics Research Letters, pp 1-9. Climate Change, 2007. Synthesis Report ;An Assessment of
the Intergovernmental Panel on Climate Change This underlying report, adopted section by section at IPCC Plenary XXVII (Valencia, Spain, 12-17 November 2007) DeConto, R.M. and D. Pollard, 2016. Contribution of
Antarctica to past and future sea-level rise; Nature 531: doi: 10.1038/nature17145.
Geist, H., and E. Lambin, 2002. Proximate causes and underlying driving forces of tropical deforestation ;
BioScience, 52: 143–150.
Golledge, N.R., D.E. Kowalewski, T.R. Naish, R.H.Levy, C.J. Fogwill, and E.G.W. Gasson, 2015. the multi-millennial Antarctic commitment to future sea-level rise. Nature 526 [7573]: 421.
India State of Forest Report, 2015. Forest Survey of India, Ministry of Environment, Forest and Climate Change Jaccard, S.L., E.D. Galbraith, A. Martinez-Garcia and R.F.
oxygenation and atmospheric CO2 through the last ice age;
Nature 530: 207-210.
James Hansen, Makiko Sato, Reto Ruedy, Ken Lo, David W. Lea, Martin Medina Elizade, 2006. Global temperature change; Proceedings of the National Academy of Sciences; vol. 103, no. 39, pp 1-15.
Jonah Busch and Jens Engelmann; The Future of Forests: Emissions from Tropical Deforestation with and without a Carbon Price, 2016–2050- CGD Working Paper 411; Center for Global Development, pp 1-42, 2015
Kevin Anderson and Alice Bows; Beyond ‘dangerous’ climate change: emission Scenarios for a new world; Phil. Trans. R. Soc. A (2011) 369, 20–44 doi:10.1098/rsta.2010.0290 pp 20-44, 2017
Kothari, A. 1993. Conservation of Biological Diversity in India. Indian Institute of Public Administration, New Delhi (IGES International Workshop report). pp 1-86
Krinner, G., C. Largeron, M. Menegoz, C. Agosta, and C.Brutel-Vuilmet, 2014. Oceanic Forcing of Antarctic Climate Change: A Study Using a Stretched-Grid Atmospheric General Circulation Model; Journal of Climate, 27 [15]: 5786-5800, pp 1-6.
Linghong Ke, Xiaoli Ding, Wenkai Li and Bo Qiu, 2017. Remote Sensing of Glacier Change in the Central Qinghai-Tibet Plateau and the Relationship with Changing Climate; Remote Sensing; Vol. 9, No. 114, pp. 1-19.
Living Planet Report, 2014. Published by WWF, Avenue du Mont-Blanc 1196 Gland, Switzerland www.panda.org and Zoological society of London, Zoological Society of London Regent’s Park, London NW1 4RY, UK
Michael J. Ring, Daniela Lindner, Emily F. Cross, Michael E. Schlesinger, 2012. Causes of the Global Warming Observed since the 19th Century; Atmospheric and Climate Sciences, Vol: 2, 401-415 pp 1-15.
Paul Krummel, Paul Fraser and Nada Derek; CSIRO Oceans and Atmosphere; the 2015 Antarctic Ozone Hole Summary: Final Report; Department of the Environment, Government of Australia, 2016
Peter U. Clark et al., 2016. Consequences of twenty-first-century policy for multi-millennial climate and sea-level change; Nature climate change; 6, 360–369 doi:10.1038/ nclimate2923.
Rapid climate change in the arctic: polar research as a global responsibility; edited by-W.Bertelsmann Verlag GmbH& Co.KG, Bielefeld Published by Bundesministerium für
Bildung und Forschung / Federal Ministry of Education and Research (BMBF) Division System Earth11055 Berlin, 2015
Ritz, C., T.L. Edwards, G. Durand, A.J. Payne, V. Peyaud, and R.C.A. 2015. Hindmarsh ; Potential sealevel rise from Antarctic ice-sheet instability constrained by observations ; Nature 528 [7580]: 115.
Robel, A. 2015. The long future of Antarctic melting ; Nature 526 [7573]: 327-328.
Ronald O'Rourke, 2017. Specialist in Naval Affairs and Coordinator Changes in the Arctic: Background and Issues for Congress Congressional Research Service, 7-5700 www.crs.gov R411532017.
Ruzmaikin, A. and A. Byalko, 2015. On the Relationship between Atmospheric Carbon Dioxide and Global Temperature. American Journal of Climate Change, Vol. 4, 181-186. pp 2-6, 2015.
Schmithusen, H., J. Notholt, G. Konig-Langlo, P.Lemke, and T. Jung, 2015. How increasing CO2 leads to an increased negative greenhouse effect in Antarctica; Geophysical Research Letters, 42 [23].
Sudhakar Reddy, C., Kalloli Dutta and C. S. Jha, 2013. Analyzing the gross and net deforestation rates in India; Current Science, Vol.105 No.11, pp 1492-1500.
Sutter, J., P. Gierz, K. Grosfeld, M. Thoma, and G. Lohmann, 2016. Ocean temperature thresholds for Last Interglacial West Antarctic Ice Sheet collapse ; Geophysics Research Letters: DOI: 10.1002/2016GL067818.
Venkataramanan, M. and Smitha, 2011. Causes and effects of global warming; Indian Journal of Science and Technology, Vol. 4 issue 3: 0974- 6846; pp 226-229. Vladimir M. Kattsov, Vladimir E. Ryabinin, James E.
Overland, Mark C. Serreze, Martin Visbeck, John E. Walsh, Walt Meier, and Xiangdong Zhang, 2010. Arctic sea-ice change: a grand challenge of climate science;
Journal of Glaciology, Vol. 56, No. 200, pp 1115-1121. World Meteorological Organization (WMO) Statement,WMO
No. 1189; published by Chairperson, Publications Board World Meteorological Organization (WMO) 7 bis, avenue de la Paix Tel.: +41 (0) 22 730 84 03 P.O. Box 2300 Fax: +41 (0) 22 730 80 40 CH-1211 Geneva 2, Switzerland E-mail: [email protected] ISBN 978-92-63-11189-0 Yonghui Yao, Baiping Zhang, 2013. A Preliminary Study of
the Heating Effect of the Tibetan Plateau; http://dx.doi.org/ 10.1371/journal.pone.0068750.